Ready to see the market clearly?
Sign up now and make smarter trades today
Education
December 25, 2024
SHARE
Backtesting Techniques: Refining Strategies with DOM Data and Performance Metrics
Have you ever considered the parallels between trading in the financial
markets and a strategic game like chess? Both require a well-defined game
plan and a systematic approach to success. In the world of trading, it’s not
merely about making random moves; it’s about having a meticulously crafted
strategy that stands up to rigorous testing.
In this article, we will explore the techniques that underlie effective
trading strategies and investigate how experimenting with diverse ideas
across numerous trading opportunities can help us build strong strategies
that work in various market situations. Then, we’ll talk about how crucial
it is to include important facts like significant news events or financial
reports when we test our trading plans.
Also, we’ll take a closer look at some of the common errors made by novice
traders when they evaluate their strategies, such as solely focusing on
profitable stocks. By the end of this article, you will have acquired
valuable insights into enhancing your trading practices and making your
trading endeavors more successful. So, let’s begin.
Advanced Techniques in Backtesting
The ability to anticipate and respond to unexpected events is a valuable
asset for traders. Advanced backtesting techniques provide traders with the
tools to refine their strategies and master the art of risk management.
Let’s understand them in detail.
Multi-market and Multi-timeframe Backtesting
Testing across multiple markets and timeframes allows the creation of
strategies that can adapt to varying market conditions. It helps in
developing robust trading approaches that are not overly reliant on specific
market behaviors.
Also, utilizing different timeframes provides a broader dataset for
analysis. It helps in:
-
Reducing the risk of overfitting and
-
Validating the strategies across various market scenarios.
What are the Challenges?
|
Increased Complexity |
Time Consumption |
|
|
Incorporating Fundamental Data
Fundamental factors such as
major economic announcements
, earnings reports, and geopolitical events have a significant impact on
market movements. These events cause sudden shifts in supply and demand and
affect prices, market sentiment, and volatility. Understanding and
accounting for these factors can enhance the accuracy of backtesting.
How to Implement Practically?
Incorporating unexpected news events into a backtest involves:
-
Data Integration:
-
Incorporate the relevant fundamental data into the backtesting
model. -
For instance, including interest rate changes, earnings
announcements, or geopolitical events.
-
-
Scenario Analysis:
-
Analyze how the strategy performed during past instances of
similar unexpected events. -
For example, examining how the strategy behaved during surprise
interest rate changes in historical data.
-
-
Adjusting Strategy Parameters:
-
Modify the strategy parameters to account for the impact of the
unexpected event. -
Mostly, this involves:
-
Adjusting risk management protocols,
-
Altering entry/exit criteria, or
-
Temporarily suspending trading during extreme volatility.
-
-
-
Outcome Analysis:
-
Evaluate the strategy’s performance during and after the
unexpected event. -
Assess how well it managed risk, capitalized on opportunities,
or potentially safeguarded capital during market turmoil caused
by such events.
-
Common Oversights in Backtesting
Most traders make the common mistakes of not accounting for
survivorship bias
and ignoring out-of-sample testing. By avoiding them, traders and analysts
can better determine the robustness and generalizability of their trading
strategies. Let’s delve deeper.
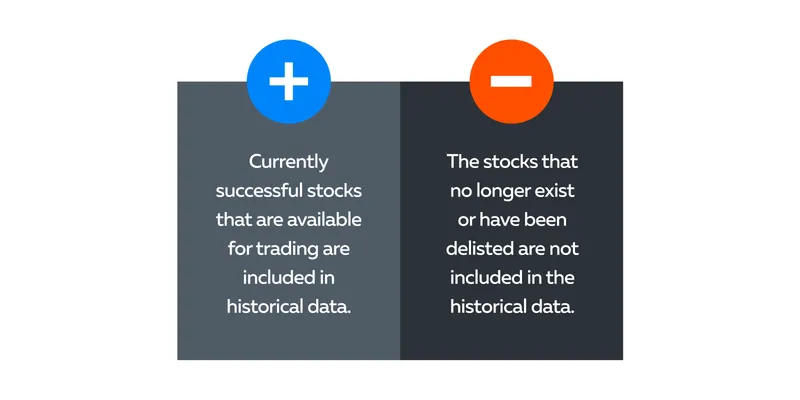
Mistake 1: Not Accounting for Survivorship Bias
Survivorship bias refers to the tendency to analyze only the data of
entities that have survived or persisted. In the context of backtesting, it
occurs when:

How does Survivorship Bias Impact a Trading Strategy?
Survivorship bias excludes data from failed or delisted stocks that:
-
Leads to an overly optimistic view of a trading strategy’s
performance. -
Skews backtesting results by not accounting for stocks that were
present in the past but are no longer part of today’s market.
This oversight can significantly impact trade account management strategies
and lead to potentially unreliable conclusions about a strategy’s
profitability. Thus, traders must utilize databases or historical data that
include information on delisted stocks. This inclusion gives a more accurate
representation of the market and prevents overestimation of strategy
performance.
Mistake 2: Ignoring Out-of-Sample Testing (Preventing Curve Fitting)
Out-of-sample testing is crucial as it validates the effectiveness and
robustness of a trading strategy using data that the strategy hasn’t “seen”
during the development phase. This practice prevents
curve fitting
, a phenomenon where a strategy is excessively optimized to fit historical
data but fails to perform well in real market conditions.
How to Conduct Out-of-Sample Testing and Prevent Curve Fitting
1. Perform Data Segmentation:
• Suppose you have a dataset spanning 10 years.
• Divide this data into two distinct segments: an initial training set and
a later testing set.
2. Train on Historical Data:
• Train your trading strategy exclusively using data from the initial
portion.
• For example, use the data from the first 8 years to develop and fine-tune
your strategy.
3. Testing on Unseen Data:
• Evaluate the strategy’s effectiveness and performance using the data from
the remaining portion.
• For instance, apply your strategy to the last 2 years of data, which your
model has not been exposed to during the training phase.
Improving Your Edge with Advanced Metrics

Utilizing advanced metrics provides a more comprehensive understanding of a
strategy’s risk-adjusted performance. These metrics help traders in making
more informed decisions regarding their investments and risk management
strategies.
One of the advanced metrics is the usage of the
Sharpe Ratio
. It helps in:
-
Quantifying the performance of an investment concerning the
risk-free rate after adjusting for risk. -
Indicating the potential return on investment that could be achieved
for the risk it carries.
A higher Sharpe Ratio signifies better risk-adjusted performance. However,
there are several other performance metrics as well. Let’s understand them
in-depth.
Beyond the Sharpe Ratio
Sortino Ratio and Calmar ratio offer more nuanced insights into risk and
return. See the table below to understand:
|
What are the ratios? |
What do they assess? |
How are they useful? |
How do traders use it? |
|
Sortino Ratio |
It focuses solely on negative volatility or downside |
This metric provides a more targeted view of |
Traders use it to differentiate harmful volatility from
|
|
Calmar Ratio |
It assesses an investment’s performance with its |
It compares the annual return of a portfolio to its |
A higher Calmar Ratio indicates higher returns relative
|
Stress Trading and Monte Carlo Simulations
Both stress testing and Monte Carlo Simulations serve as powerful tools in
risk assessment and strategy evaluation. These methods help traders and
investors prepare for unforeseen circumstances and understand how their
strategies might perform in adverse conditions.
Stress Testing
Stress testing entails subjecting an investment strategy to extreme
hypothetical market conditions to gauge its performance under adverse
scenarios. For example, it analyzes how a strategy would have fared during
significant past economic events, such as the 2008 financial crisis.
Why is it important?
It helps traders and investors by making them:
-
Understand the robustness of their strategies by simulating extreme
market conditions. -
Anticipate potential weaknesses and vulnerabilities in their
strategies. -
Undertake necessary adjustments to enhance resilience.
Monte Carlo Simulation:
A Monte Carlo Simulation is a statistical method that models the probability
of various outcomes in uncertain scenarios. This technique depends on random
sampling and statistical models to estimate mathematical functions and
forecast the likelihood of different scenarios.
Why is it important?
Monte Carlo Simulations help in forecasting potential outcomes by
introducing randomness into the process. It’s useful in trading to simulate
various profit and loss scenarios by:
-
Shuffling trade orders or,
-
Adjusting parameters in multiple iterations.
Depth-of-Market (DOM) Analysis in Backtesting
Bookmap stands out as an advanced market analysis tool, offering a unique
visual representation of
Depth-of-Market
(DOM) data. Instead of presenting bids and asks in a traditional tabular
format, Bookmap provides traders with a real-time heatmap, offering a visual
portrayal of market liquidity and volume.

This dynamic visualization vividly illustrates the concentration and
distribution of bids and asks within the market.
How to Utilize Real-time Market Liquidity and Volume Data in Backtesting
Traders use Bookmap’s DOM data in backtesting to:
-
analyze historical fluctuations in liquidity levels over time
-
identify patterns and trends in market depth, ultimately enhancing
trading strategies
Additionally, Bookmap’s visualization of market volume assists in analyzing
historical trading volumes. Traders can assess volume patterns and
correlations with price movements, which aids in strategy development and
risk management.
How Does Performing Backtesting with Bookmap’s DOM Data Help?
Traders integrate Bookmap’s DOM data into backtesting scenarios to gain a
more comprehensive view of market dynamics during the test period. This
inclusion provides insights into market liquidity and volume that
traditional backtesting methods might not offer.
It helps traders refine their strategies and:
-
Deepens their understanding of market behavior and
-
Offers a unique perspective and a more nuanced understanding of
market dynamics.
Conclusion
Advanced backtesting techniques empower traders with a more comprehensive
understanding of their strategies and the markets they operate within. The
usage of multi-market and multi-timeframe backtesting to the incorporation
of fundamental data ensures that traders can fortify their strategies in an
ever-changing market environment.
Further, exploration of stress testing and Monte Carlo simulations refine
and enhance backtesting processes. Advanced market analysis tools like
Bookmap offer innovative data visualizations and a deeper insight into
market behaviors and dynamics.
Ready to gain a deeper perspective into the markets? Dive into Bookmap’s
advanced visualization of Depth of Market data and refine your trading
strategies.
Sign up now
and elevate your backtesting process!
