See sharpe ratio more clearly in real time.
Compare plans to access deeper market visibility for sharpe ratio.
Education
June 28, 2024
SHARE
What is the Sharpe Ratio in Trading?
Risk and return are the two essential components of every trading strategy, and are what will determine whether the strategy is a winning strategy or a losing one.
Most investments or strategies in financial markets are measured in terms of return, and this has a risk associated with it. Therefore, before investing in anything, a trader needs to assess whether the return is worth the risk or not.
The Sharpe ratio Trading provides traders with a precise measurement that will aid in assessing the potential return on investment, in comparision to the risk associated with it.
Read on if you are interested in knowing more about the Sharpe ratio, how to use it, and its limitations. We’ll go through all the fundamentals in this post.
What is the Sharpe Ratio?
The Sharpe ratio was created by William F. Sharpe, an American Economist and Nobel prize winner in Economic Sciences.
The Sharpe ratio can be understood as the average return on investment as compared to its risk. The ratio is calculated using the average return in excess of the risk-free rate per unit of volatility. It can be used to analyze the past performance of a security or strategy.
The real risk in the Sharpe Ratio is the market’s volatility, which is the changes in price of a security due to factors such as market conditions, unexpected events, news, etc.
- Calculating Risk-Adjusted Returns
The Sharpe ratio can be utilized to calculate the risk-adjusted return, which essentially tells the trader how much risk they need to take to enjoy that rate of return. It is similar to the risk:reward ratio that traders like to look at for each trade, only the risk-adjusted return will show you that return over a series of trades (if looking at a strategy’s results, say in a backtest), or for a particular investment.
Using The Sharpe Ratio
The Sharpe Ratio has a formula that can be used to calculate the value of the ratio. The more significant the Sharpe Ratio, the better is the investment’s risk-adjusted performance.
- The Formula
The formula for Sharpe Ratio is as follows:
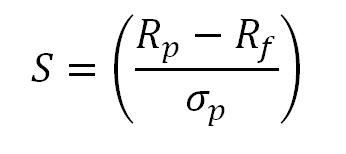
Image soure
Where SR(a) is the Sharpe ratio of the security “a”, rais the rate of return on “a”, R is the rate of return on Risk-free security and SD(ra) is the standard deviation of the rate of return on “a”.
- Examples of the Sharpe Ratio
Consider the case of two securities such that security “A” generates a return of 15 percent while security “B” generates a return of 18 percent. Without considering the associated risks, investing in Security “B” would appear better than investing in “A”. However, imagine that the risk-free rate is 6 percent and the standard deviation for Security “A” is 5 percent, and for Security “B” it is 8 percent.
Utilizing the Sharpe ratio formula, the value of Security “A” will be 1.8, and the value of Security “B” will be 1.5. This indicates that Security “A” provides a higher risk-adjusted return.
In general, a ratio between 1 and 2 is considered good, between 2 and 3 very good, and anything above 3 excellent. But the Sharpe ratio doesn’t tell the full story, and very high Sharpe ratios should be taken with a grain of salt.
Limitations of the Sharpe Ratio
A trader can utilize the Sharpe Ratio to make better trading decisions. However, there are certain limitations that a trader must understand before solely relying on a “good” Sharpe ratio.
- Assuming A Normal Distribution
The Sharpe Ratio assumes that securities returns in the financial market are normally distributed. This is essential for a clean formula, and means that fluctuations in the value of the assets are symmetrical and tend to be more frequent around the mean.
However, this is not the case, and markets experience two sigma moves more than normal distributions assume. This means that the risks associated with a strategy or asset are probably underestimated, and the Sharpe ratio seen may not hold up in the future.
Wrapping Up
Sucessful trading in the financial markets requires accurate control of risk. For this, you must have a way to measure it. The Sharpe ratio is one such method available for ensuring that the rewards for an investment or trading strategy are worth the risks taken.
Bookmap was designed for traders, by traders. Seeing the true liquidity will help you get a price, one of the quickest and most intuitive ways to reduce risk on any trade. Click here to get started.
Sign Up Now