See liquidity more clearly in real time.
Compare plans to access deeper market visibility for liquidity.
Education
August 26, 2024
Updated
SHARE
Deep Dive into Liquidity: Concepts & Importance

Have you ever been plagued with higher transaction costs, increased price slippage, and difficulty entering or exiting positions while trading? If you are unable to assess liquidity, trading becomes a nightmare. Most traders face unexpected losses and greater risk when trading in low-liquidity environments, as they are more prone to significant price movements and market volatility. Hence, it must be noted that liquidity is a crucial aspect of financial markets. It influences everything from trading efficiency to risk management.
In this article, we’ll explore the importance of liquidity in trading and understand how it leads to smoother transactions and reduces costs. Next, we’ll discuss the role of different market participants, such as market makers, institutional investors, and retail traders, in providing liquidity and how economic events, market sentiment, and trading volumes can impact it.
Additionally, we’ll study the various tools and indicators used to measure liquidity, including Average Daily Volume (ADV) and Volume-Weighted Average Price (VWAP). We’ll also explain how analyzing the order book provides insights into market depth and liquidity and introduce liquidity heatmaps as a tool to visualize liquidity distribution across different price levels.
Lastly, you’ll also learn how Bookmap‘s color-coded heatmaps provide advanced insights and help you make better trading decisions. Let’s begin.
An Overview of Liquidity
Liquidity is a crucial concept in finance. It refers to the ability of an asset to be quickly bought or sold in the market without affecting its price. High liquidity implies that there is a large volume of trades happening at any given time. A financial asset with high liquidity often transacts smoothly and quickly.
It is worth mentioning that this liquidity varies in both large-cap and small-cap stocks. Stocks of large companies, such as Apple or Microsoft, are considered highly liquid. This is because these companies:
- Have a high market capitalization,
and
- Are widely held and traded by investors globally.
The high trading volume ensures that buyers and sellers can easily find counterparts to trade with. This significantly minimizes the impact on the stock’s price.
On the other hand, small-cap stocks, which are shares of smaller companies with lower market capitalization, often experience lower trading volumes. This makes them less liquid as there are fewer participants in the market. Lower liquidity leads to significant price changes when trades occur.
Also, it must be noted that the bid-ask spread (the difference between the buying and selling price) is quite wide for small-cap stocks, which is indicative of lower liquidity. Now, for more clarity, let’s study the various types of liquidity in the market:
| Market Liquidity | Funding Liquidity | Accounting Liquidity |
|
|
|
Importance of Liquidity in Trading
Liquidity plays an important role in the functioning of financial markets. See the graphic below to understand how it helps:
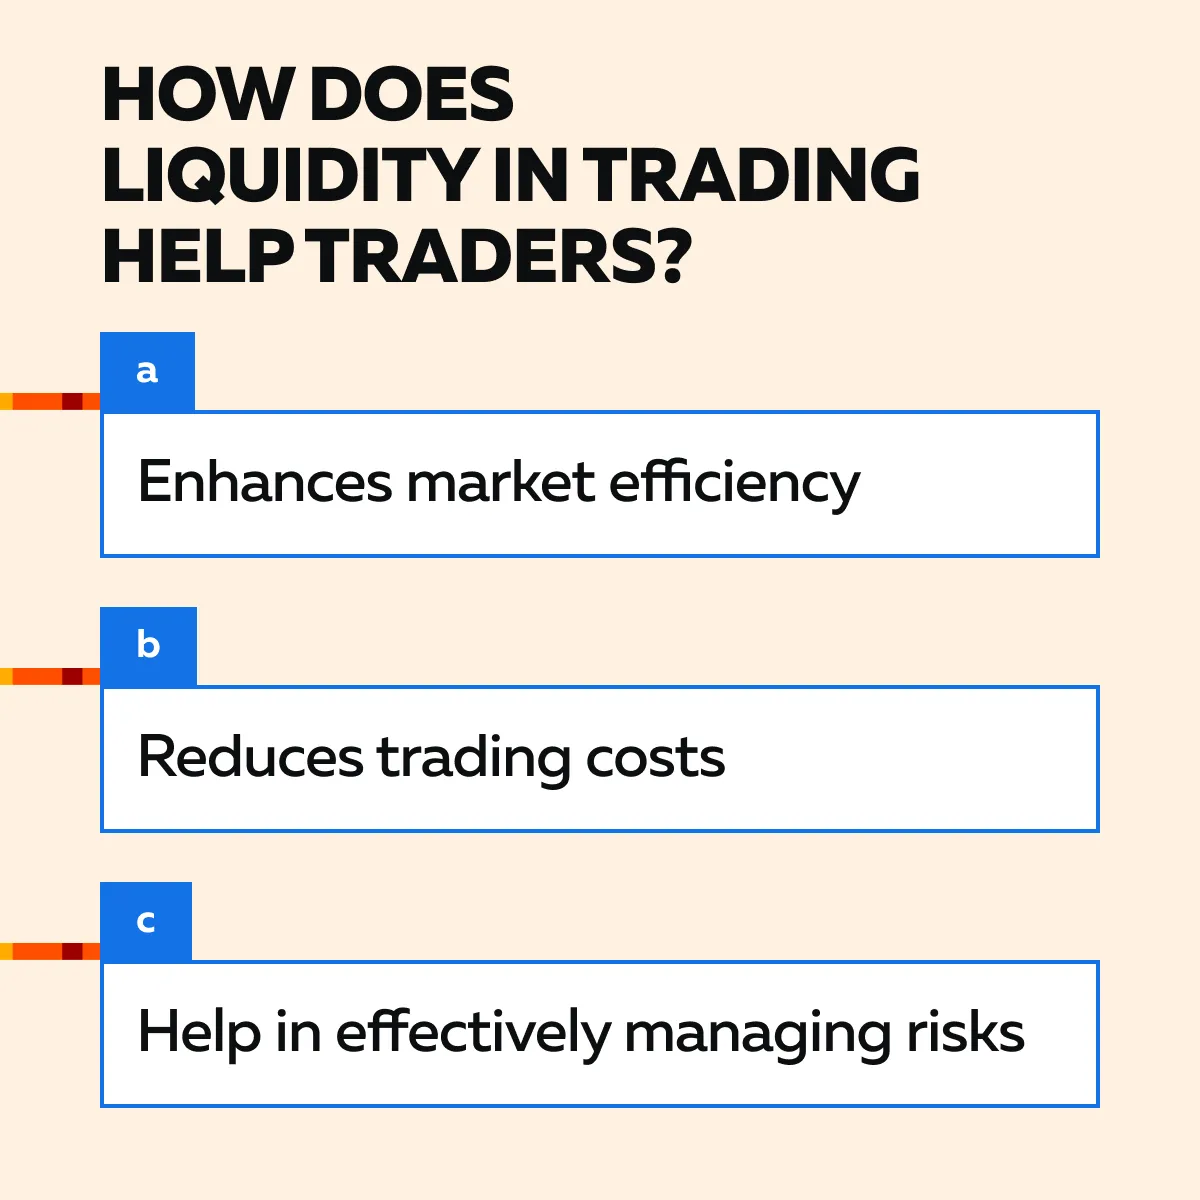
To achieve a better understanding, let’s have a look at its various aspects:
- A) How Does Liquidity Contribute to Market Efficiency?
Liquidity significantly contributes to market efficiency. It facilitates smoother and faster transactions. It is worth mentioning that when assets are highly liquid, buyers and sellers can execute trades quickly without substantial price movements. This ease of trading:
- Ensures that prices reflect all available information promptly,
- Allows for efficient price discovery, and
- Minimizes the chances of market distortions.
- B) How Does High Liquidity Reduce Transaction Costs and Minimize Price Slippage?
High liquidity reduces transaction costs by decreasing the bid-ask spread. In liquid markets, the spread is narrower, making it cheaper to trade. Additionally, high liquidity minimizes price slippage, which occurs when the execution price of a trade differs from the expected price.
On the contrary, in illiquid markets, larger orders significantly move the market price, which leads to higher slippage. Thus, liquid markets:
- Ensure that trades are executed at prices close to the expected value,
and
- Enhance the efficiency and predictability of trading outcomes.
How Does Liquidity Manage Trading Risks?
Liquidity is crucial in managing trading risks. In liquid markets, the ease of buying and selling assets allows traders to enter and exit positions quickly. Such ease also reduces the risk of being stuck in unfavorable trades.
On the other hand, in illiquid markets, the difficulty in finding buyers or sellers leads to significant price fluctuations when executing trades. This difficulty increases the risk of losses. Moreover, traders can also face higher volatility and uncertainty, which usually makes it challenging to manage positions effectively.
What is the Impact of Liquidity on Price Stability and Market Volatility?
Liquidity directly influences price stability and market volatility. Liquid markets are generally more stable. That’s because prices in such markets:
- Move in smaller increments,
and
- Are less susceptible to abrupt changes.
Moreover, this stability is also because of the high number of buyers and sellers who absorb large orders without significant price impacts. On the other hand, illiquid markets exhibit higher volatility. Prices in such markets are more prone to large swings due to the:
- A limited number of participants
and
- Lower trading volume.
This lack of stability also leads to sudden and drastic price changes, which increases the overall risk for traders and investors.
Factors Affecting Liquidity
Liquidity in financial markets is influenced by a variety of factors, such as:
- The roles of different market participants,
- Economic events,
- Market sentiment, and
- Trading volumes.
For a detailed explanation of these factors, let’s study the below points:
What is the Role of Market Participants in Altering Liquidity?
We can divide market participants into market makers, institutional investors, and retail traders. All of them influence the liquidity positions in their own ways. Let’s see how:
- Market Makers
- Market makers play a crucial role in providing liquidity.
- They continuously quote buy-and-sell prices for securities.
- Also, they maintain an orderly market by ensuring that there is always a bid and ask price available, which facilitates smoother trading.
- It must be noted that market makers profit from the spread between the bid and ask prices.
- By doing so, they reduce volatility and ensure that assets can be traded without significant price disruptions.
Want to see how big players move the market? Bookmap helps traders visualize the actions of major players. Enhance your trading strategy today with real-time insights! Sign up with Bookmap now.
- Institutional Investors
- Institutional investors (mutual funds, pension funds, and hedge funds) contribute to market liquidity through their large-scale trades.
- Their substantial buying and selling activities ensure that there is always enough volume in the market to accommodate trades.
- These investors often have the resources and systems to execute large orders efficiently and that too without significantly impacting the market price.
- Retail Traders
- Retail traders, although smaller in scale compared to institutional investors, also play a role in providing liquidity.
- Their collective trading activities contribute to the overall market volume.
- While individual trades may not move the market significantly, the aggregated effect of many retail traders can enhance liquidity.
- This especially holds true for highly traded stocks or assets.
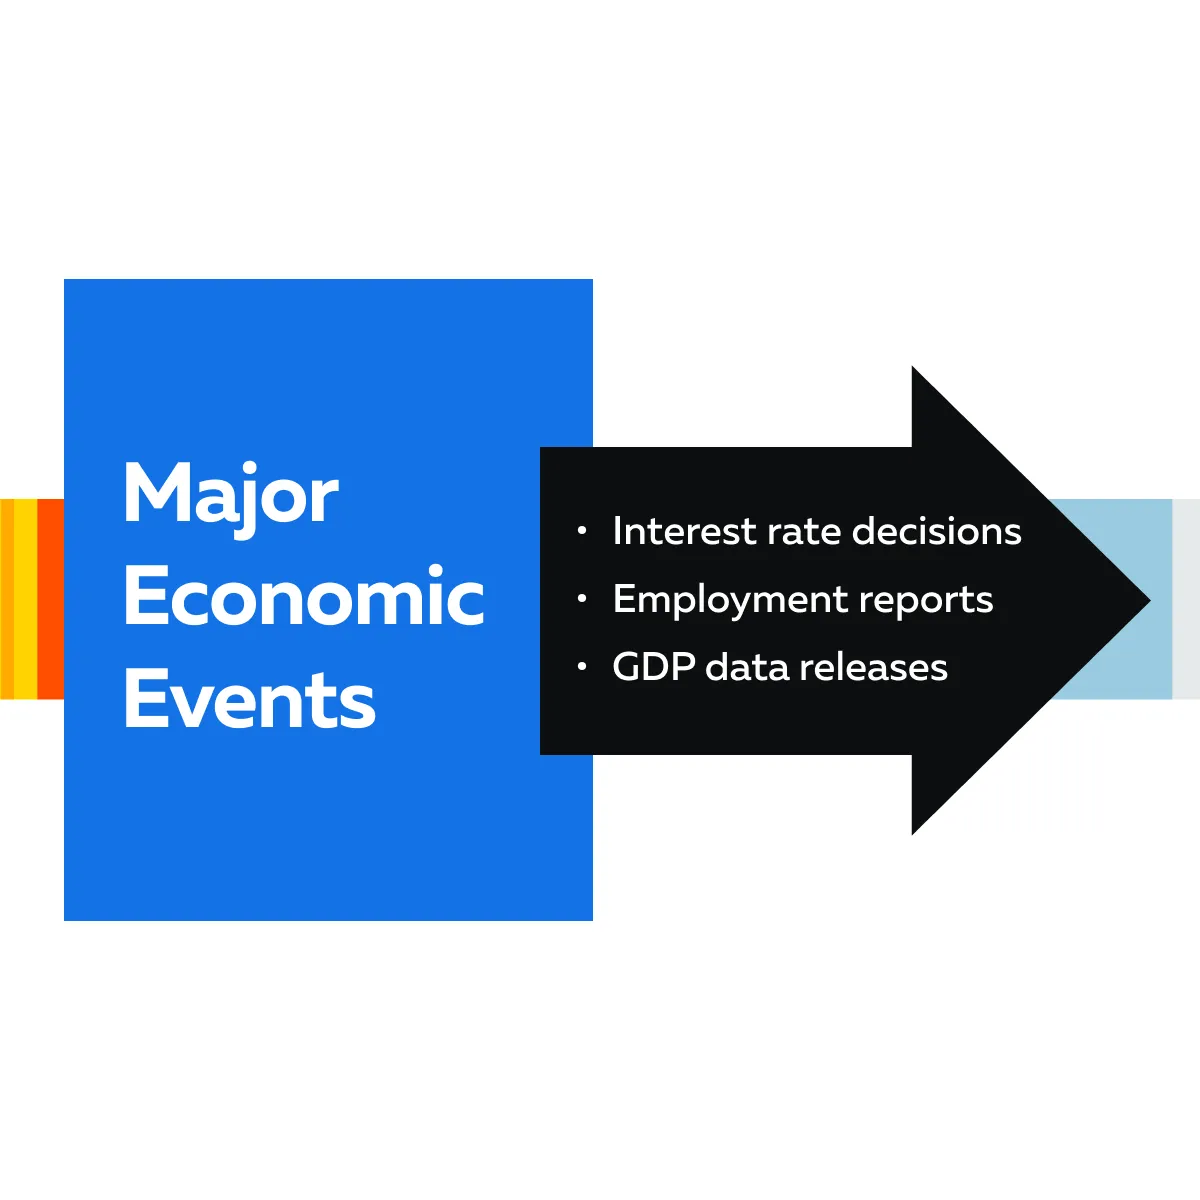
How do Economic Events Impact Liquidity?
Major economic announcements significantly impact market liquidity. See the graphic below and check out some major economic events:
Before such events, traders usually adjust their positions. Such an adjustment leads to increased volatility, which causes the potential liquidity to dry up as uncertainty rises. See the graphic below:
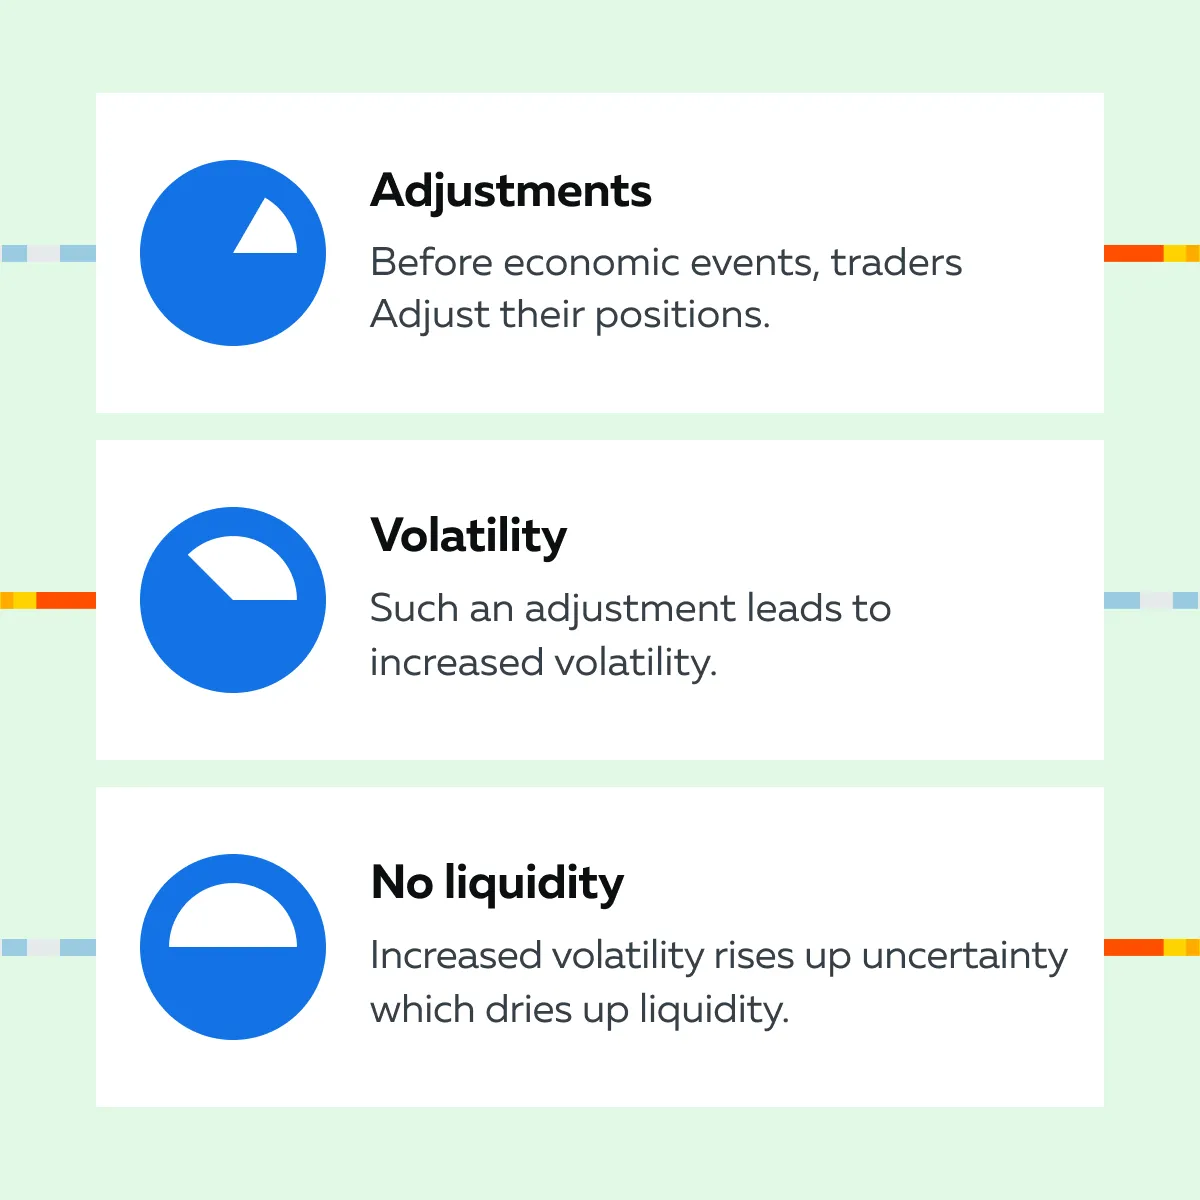
For example,
- Say a large-cap company made a major earnings announcement.
- Such an announcement causes liquidity to evaporate rapidly.
- This makes it difficult to execute trades at the desired prices.
How does Market Sentiment Impact Liquidity?
One should be aware that market sentiment is driven by:
- News,
- Geopolitical events, or
- Economic indicators.
They also significantly impact liquidity. Positive sentiment usually increases market activity and enhances liquidity as investors are more willing to buy and sell assets. Contrarily, negative sentiment leads to panic selling. This situation reduces liquidity and increases market volatility. For example, during a financial crisis, market sentiment often turns bearish. This causes a sharp decline in liquidity and a spike in volatility.
How do Trading Volumes Impact Liquidity?
Trading volumes are a direct measure of market activity. They play a vital role in determining liquidity. Let’s see how:
- Higher trading volumes typically signify higher liquidity. That’s because there are more buyers and sellers in the market.
- On the other hand, low trading volumes lead to illiquidity. This makes it difficult to buy or sell assets without affecting their prices.
Also, during periods of low volume, even small trades lead to significant price movements, which increases the risk for traders.
Tools & Indicators for Measuring Liquidity
Accurate measurement of liquidity is important for effective trading and investment strategies. Various tools and indicators help traders assess liquidity in the market. Below are some of the most commonly used methods for measuring liquidity:
A) Volume Indicators
Average Daily Volume (ADV) is used to assess the usual trading volume of an asset over a specified period. It helps traders understand how actively security is traded. Also, it provides a benchmark for comparing current trading activity. Usually, high ADV indicates high liquidity. This means that the asset can be bought or sold quickly without significantly impacting its price.
How Do Traders Use ADV?
Generally, there are two popular practical applications of ADV:
| Trend Analysis | Liquidity Assessment |
|
|
Apart from ADV, Volume-Weighted Average Price (VWAP) is another indicator that represents the average price at which a security has traded throughout the day (weighted by volume). It provides information related to the overall trading activity and helps traders determine the fair value of an asset.
How Traders Use VWAP?
Like ADV, most traders prefer using VWAP for these two purposes:
| Benchmarking | Trend Confirmation |
|
|
B) Order Book Analysis
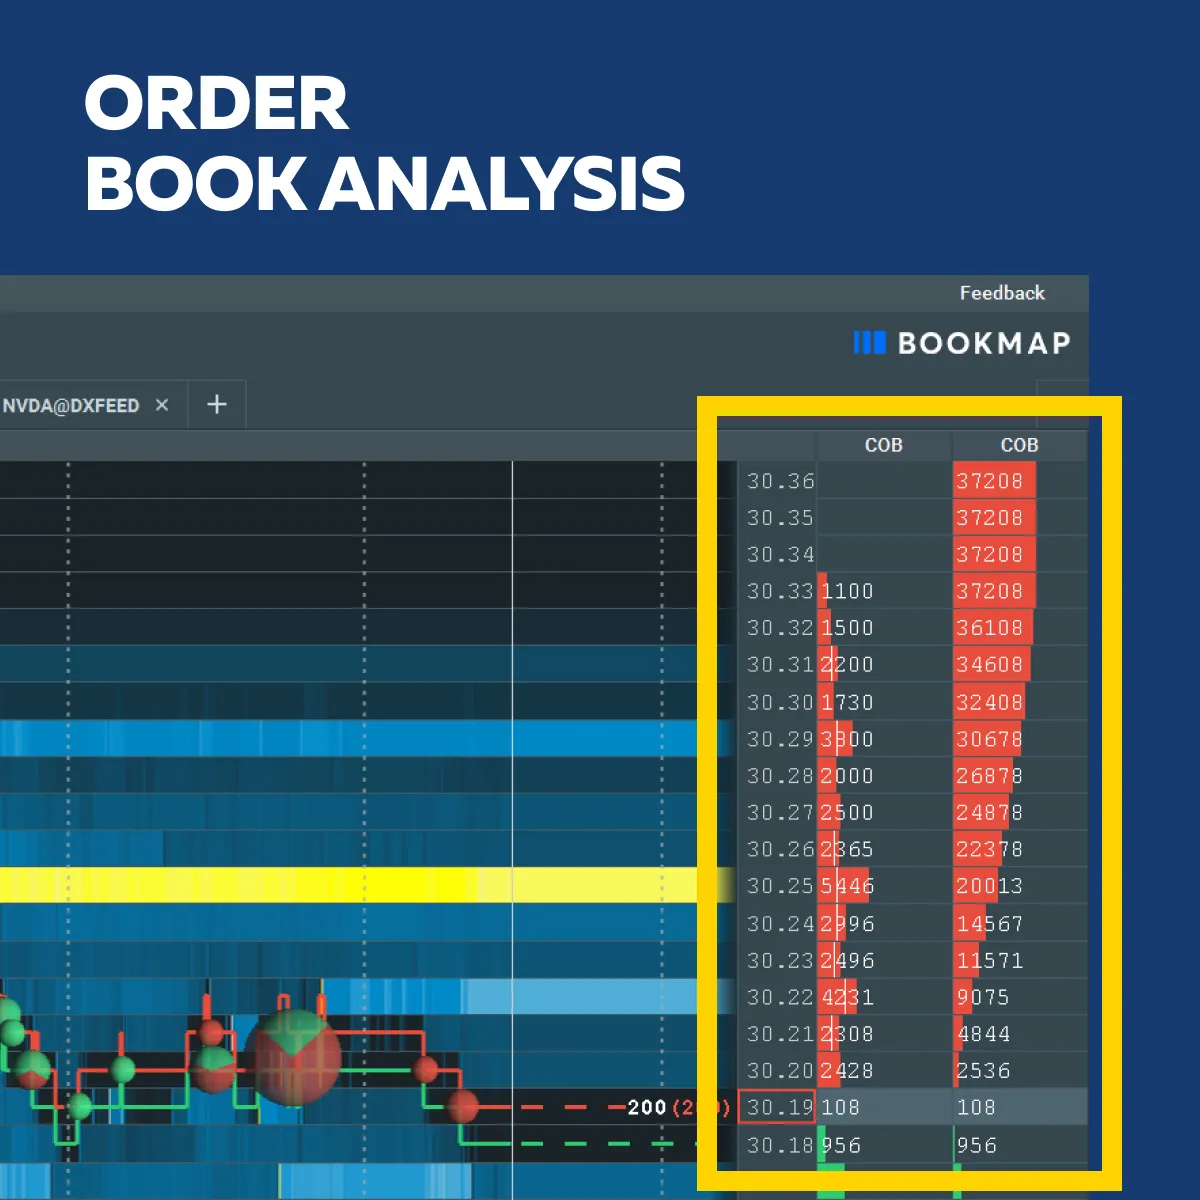
Analyzing the order book provides valuable insights into market depth and liquidity. The order book displays the buy and sell orders at different price levels. It shows the supply and demand dynamics for an asset.
Are you looking to analyze order books in real time? Try Bookmap and assess the depth of the market like never before. Sign up now!
Now, let’s see how market depth and liquidity are related to each other:
- Order Distribution
- The distribution of buy and sell orders at various price levels indicates market depth.
- A large number of orders close to the current price level suggests high liquidity.
- That’s because it indicates the presence of many participants willing to trade at those prices.
- Support and Resistance
- Clusters of buy orders below the current price act as support levels.
- In contrast, clusters of sell orders above the current price serve as resistance levels.
- These areas indicate where liquidity is concentrated and usually impact price movements.
C) Liquidity Heatmaps
Liquidity heatmaps are advanced tools that visualize liquidity distribution across different price levels. They provide a graphical representation of where buy and sell orders are concentrated. This helps traders identify areas of high and low liquidity in the market. With Bookmap, you get access to color-coded heat maps that provide a visual representation of market liquidity. Using them, you can easily identify significant buy and sell zones. Try Bookmap today!
How do heatmaps work and help traders?
As discussed above, most heatmaps, such as those offered by Bookmap, use color coding to represent liquidity levels. Areas with high liquidity are often shown in bright colors, while areas with low liquidity are displayed in darker shades. Also, they highlight liquidity zones that enable traders to pinpoint regions with significant buying or selling interest. This information helps in making informed trading decisions and managing risks.
Traders generally utilize heatmaps to identify optimal entry and exit points. For example, areas with high buy order concentrations indicate strong support and provide a potential entry point. Moreover, heatmaps help traders avoid low liquidity zones where price slippage and volatility are higher. This way, they ensure more stable trading conditions.
Conclusion
Liquidity plays an important role in effective trading. It influences market efficiency, transaction costs, and risk management. Hence, traders need to understand different liquidity measures, such as Average Daily Volume (ADV) and Volume-Weighted Average Price (VWAP). Traders also ought to analyze order book data to assess market depth and stability.
Liquidity heatmaps further enhance this understanding by visually highlighting high- and low-liquidity areas. This, again, makes it easier for traders to spot key trading opportunities and avoid volatile zones.
For those looking to gain deeper insights into market liquidity, Bookmap’s color-coded heatmaps are an invaluable tool. They provide real-time, visual clarity on liquidity distribution and allow traders to make more informed decisions. Explore Bookmap’s advanced features and take your trading strategy to the next level. Sign up for Bookmap now!
Sign Up Now