


See liquidity more clearly in real time.
Compare plans to access deeper market visibility for liquidity.
Education
September 18, 2026
Updated
Evaluating Stock Liquidity: What Every Trader Should Know

Say you have two houses, one in a modern city and the other in a remote town. In the city, you have several potential buyers. This makes it easy to sell quickly and at a fair price. In the village, finding a buyer is tough, and you might have to lower your price.
The above story reflects liquidity. In financial markets, it shows how easily an asset can be bought or sold without affecting its price. While high liquidity means many buyers and sellers, low liquidity indicates fewer participants.
Table of Contents
- What Is Stock Market Liquidity?
- How to Find High Liquidity Stocks
- Practical Ways Traders Identify Liquid Stocks
- The Impact of Liquidity on Trading Strategies
- What Is Liquidity Risk in Investing?
- Examples of Highly Liquid Investments Across Asset Classes
- Liquidity in Bonds Explained
- Liquidity in ETFs Explained
- Liquidity in Real Estate Investments
- Cash vs. Illiquid Assets Comparison
- Liquidity Risk During Market Volatility
- Does Liquidity Affect Investment Returns?
- Strategies for Different Liquidity Levels
- Tips for Evaluating and Trading Based on Liquidity
- Conclusion
- FAQ
How to Find High Liquidity Stocks
High liquidity stocks are typically characterized by consistently high trading volume, narrow bid-ask spreads, and deep order books. Traders often look for stocks that trade millions of shares per day, show tight spreads during most trading hours, and maintain stable price movement even during periods of heavy activity. These characteristics make it easier to enter and exit positions without significantly impacting price.
Evaluating stock liquidity is crucial as different liquidity levels call for different trading strategies. Through this article, we will understand how you can evaluate stock market liquidity by looking at trading volume, bid-ask spreads, and market depth. Also, we will discuss strategies like scalping and high-frequency trading that are effective in highly liquid markets. Lastly, we will learn how you can manage your trading risk with tighter stop-losses and handle volatility using careful order placement. Let’s get started.
What is Stock Market Liquidity?
Liquidity refers to the ease with which an asset can be bought or sold in the financial markets without causing any major impact on its price. Let’s see what the two most possible levels of liquidity mean for traders:
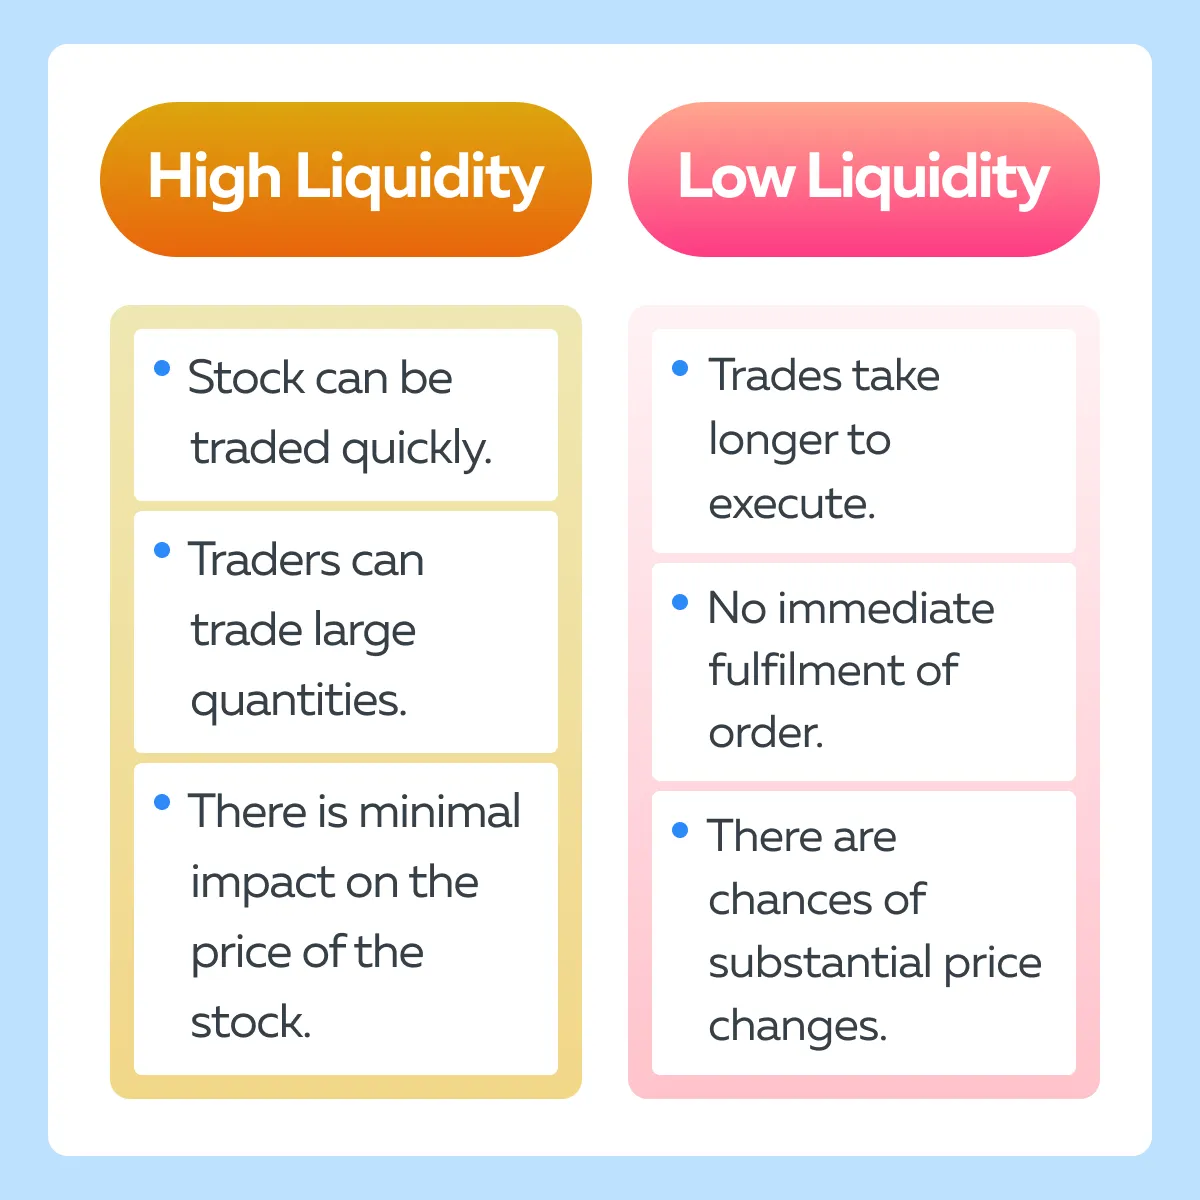
The liquidity of a stock usually gets impacted due to a variety of factors. Let’s understand their meaning:
- Trading Volume
-
- It represents the total number of shares of a particular stock that are traded during a given period.
- Usually, trading volume is measured daily.
Using Trading Volume to Identify Liquidity
Trading volume is one of the fastest ways to assess liquidity. Stocks with high average daily volume tend to have more active participation, which reduces execution risk and slippage. Many traders screen for liquidity by setting minimum volume thresholds, especially when day trading or scalping, where fast execution is critical.
- Bid-Ask Spread
-
- The bid-ask spread is defined as the difference between:
- The highest price a buyer is willing to pay for a stock (bid price)
- The bid-ask spread is defined as the difference between:
and
- The lowest price a seller is willing to accept (ask price).
How Bid-Ask Spread Reveals Stock Liquidity
The bid-ask spread reflects how easily buyers and sellers agree on price. A narrow spread usually indicates strong liquidity and competition between market participants, while a wide spread suggests limited participation and higher transaction costs. Traders often avoid stocks with consistently wide spreads, as entering and exiting positions becomes more expensive and unpredictable.
- Market Depth
- Market depth is the market’s capacity to absorb relatively large market orders without significantly impacting the stock’s price.
- It is measured by the volume of buy and sell orders at various price levels.
Using Market Depth to Evaluate Liquidity
Market depth shows how much buying and selling interest exists at different price levels. A stock with deep market depth can absorb large orders with minimal price movement, which is a hallmark of high liquidity. Shallow order books, on the other hand, signal that even modest trades may cause sharp price swings.
How to Measure Liquidity in the Stock Market
Several traders use trading volume to assess stock market liquidity. Let’s see how they interpret its varying levels:
| High trading volume | Low trading volume |
|
|
|
|
|
|
Additionally, bid-ask spreads also indicate the liquidity levels prevalent in the market. Let’s see how:
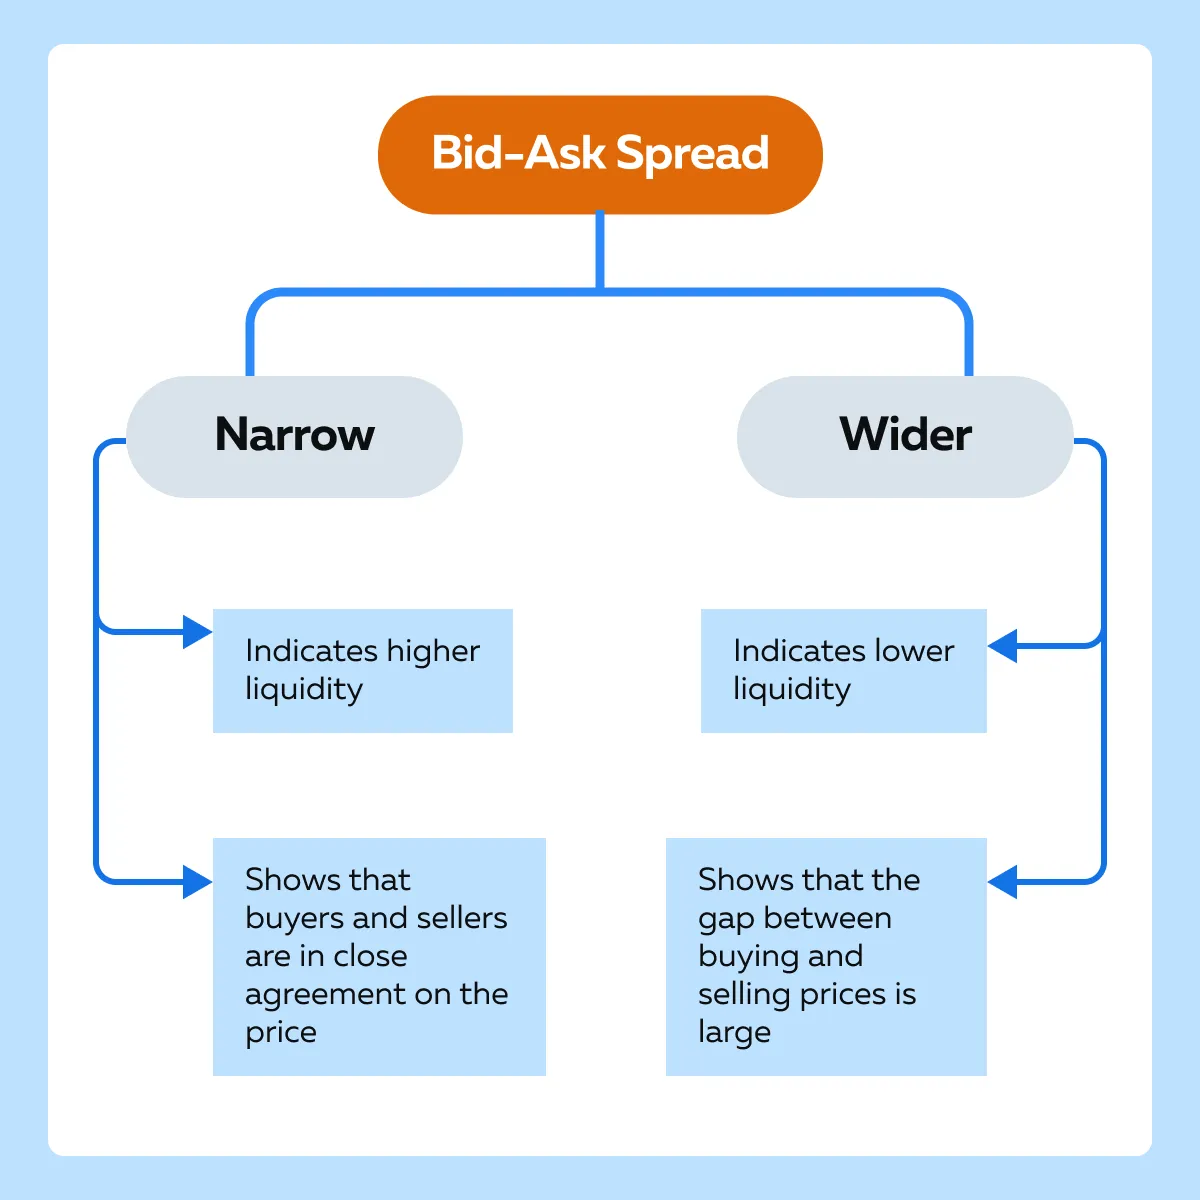
How does the bid-ask spread impact trading costs:
- Narrow spreads lead to lower trading costs.
- That’s because the difference between buying and selling prices is minimal.
- Wide spreads lead to higher trading costs.
- That’s because there is a large price gap that must be crossed.
Can market depth also indicate liquidity?
Yes, the depth of the market represents the volume of buy and sell orders at different price levels. An analysis of deep and shallow markets is commonly done by traders to assess market liquidity. Let’s see how:
- Deeper Markets
-
-
- Greater market depth means there are numerous orders spread across various price points.
- This situation shows a good presence of buyers and sellers willing to trade at these levels.
- This abundance leads to higher liquidity as large trades can be executed with minimal price impact.
-
- Shallow Markets
-
- A market depth is shallow when it has fewer orders at different price levels.
- This implies that large trades can lead to substantial price changes.
- Such a market indicates lower liquidity.
Practical Ways Traders Identify Liquid Stocks
Traders typically combine several signals when evaluating liquidity. Common approaches include screening for high average daily volume, monitoring bid-ask spreads throughout the trading session, and reviewing order book depth during active market hours. Using these methods together provides a more accurate picture than relying on a single indicator.
The Impact of Liquidity on Trading Strategies
It is pertinent to note that liquidity significantly influences trading strategies. It affects how easily assets can be bought or sold without impacting prices. Let’s understand this impact by discussing some major strategic differences in trading high-liquidity liquidity stocks (like major blue chips) versus low-liquidity stocks (such as small-caps or penny stocks).
| High Liquidity Stocks (e.g., Major Blue Chips) | Low Liquidity Stocks (e.g., Small-Caps or Penny Stocks) |
Ease of Entry and Exit
or
Lower Transaction Costs
Predictable Price Movements
|
Price Impact and Slippage
Higher Transaction Costs
Potential for Larger Gains
|
What Is Liquidity Risk in Investing?
Liquidity risk is the risk of being unable to sell an asset quickly at a fair price when you need or want to — distinct from the price risk of the asset itself simply losing value. An asset can have a perfectly sound underlying value and still expose an investor to real liquidity risk if there’s no ready buyer at the moment a sale is needed.
This distinction matters most under pressure: liquidity risk is usually invisible when everything is calm and becomes suddenly, expensively visible exactly when an investor most needs to sell — during a personal cash need, a margin call, or a broad market selloff (covered in more detail below).
Examples of Highly Liquid Investments Across Asset Classes
Beyond individual stocks, liquidity varies widely across investment types. Cash and money market funds sit at the most liquid end — convertible to spendable funds almost instantly. US Treasury bills and major currency pairs are also highly liquid, backed by enormous daily trading volume. Large-cap, widely held stocks and the most heavily traded ETFs follow closely behind. Moving toward the less liquid end: corporate bonds, small-cap and micro-cap stocks, real estate, private equity, and collectibles all require progressively more time, and typically a larger price concession, to convert into cash.
Liquidity in Bonds Explained
Bond liquidity varies dramatically by type and works differently from stock liquidity. US Treasuries are among the most liquid instruments in any market, trading in enormous daily volume with minimal spread. Corporate bonds are meaningfully less liquid — many trade infrequently after their initial issuance, and finding a counterparty for a specific bond can take longer and cost more (via a wider spread) than trading an equivalent-sized position in a liquid stock. Municipal bonds tend to be the least liquid of the major bond categories, often trading only occasionally even for relatively large issues.
This is part of why bond ETFs have grown popular as a way to access fixed income with equity-like liquidity — the ETF itself can trade actively even when many of the underlying bonds it holds trade rarely, which is also exactly why bond ETF liquidity needs its own explanation, covered next.
Liquidity in ETFs Explained
An ETF’s liquidity isn’t fully captured by its own trading volume, which is what makes it different from stock liquidity. ETFs have a creation/redemption mechanism: authorized participants can create new ETF shares by delivering the underlying basket of securities, or redeem ETF shares for that same basket, which keeps the ETF’s price closely tied to its net asset value regardless of how much the ETF itself trades on any given day.
This means a thinly traded ETF holding highly liquid underlying assets (a niche ETF built on large-cap stocks, for instance) can still offer good effective liquidity when it matters, since a large buyer or seller can work through an authorized participant rather than relying solely on the ETF’s own order book. The reverse is also true and worth watching for: an ETF that trades a healthy volume but holds illiquid underlying assets (certain high-yield bond or small-cap ETFs) can face real liquidity strain during stressed markets, when redemption becomes harder for the underlying holdings even if the ETF’s shares keep changing hands.
Liquidity in Real Estate Investments
Real estate sits near the illiquid end of the spectrum — this article opened with exactly that comparison (a city house selling quickly and fairly versus a remote-town house sitting on the market), and the underlying reasons hold up on closer inspection: a limited pool of buyers for any specific property, a sale process that typically takes weeks to months rather than seconds, and meaningful transaction costs (agent fees, closing costs) that further discourage quick flips. Real estate investment trusts (REITs) solve this the same way bond ETFs solve bond illiquidity — by wrapping illiquid underlying property in a publicly traded, liquid share structure — though the same underlying-vs-wrapper liquidity gap covered in the ETF section above applies here too.
Cash vs. Illiquid Assets Comparison
| Cash / Money Market | Illiquid Assets (Real Estate, Private Equity, Collectibles) | |
| Time to convert to spendable funds | Immediate | Weeks to years |
| Price certainty on sale | High | Low — depends on finding a willing buyer |
| Transaction costs | Minimal | Often substantial (fees, commissions, closing costs) |
| Typical return expectation | Lowest | Often higher, partly compensating for illiquidity |
| Suitable for | Near-term needs, emergency funds | Long-term capital not needed on short notice |
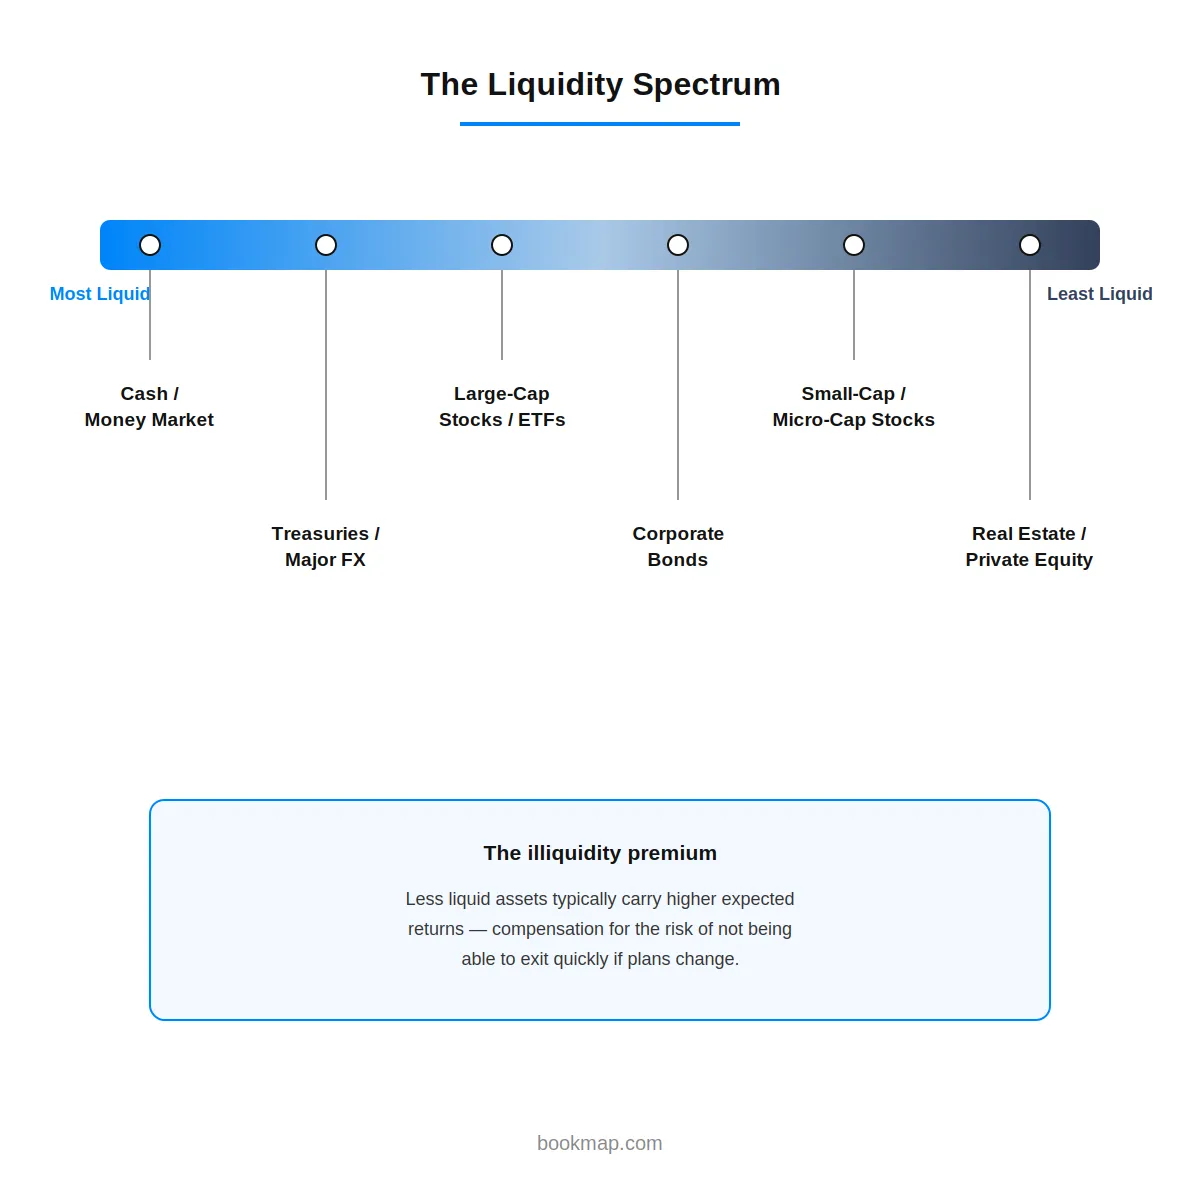
The return gap in the last two rows is often described as an “illiquidity premium” — the extra return investors generally demand for tying up capital in something that can’t be quickly converted back to cash if plans change.
What is the Relationship between Liquidity and Volatility?
Lower Liquidity, Higher Volatility
- Low-liquidity stocks are more prone to price volatility.
- With fewer buyers and sellers, any large trade can cause sharp price movements.
- This higher volatility increases the risk.
- However, it can also enhance potential returns for those who can capitalize on the price swings.
Higher Liquidity, Lower Volatility
- High-liquidity stocks exhibit lower volatility.
- That’s because the high volume of trades dampens the impact of any single transaction.
- This stability is attractive to:
- Risk-averse investors
and
- Those who maintain long-term investment horizons.
How does Liquidity Impact Risk and Returns?
| Risk | Returns |
|
|
Liquidity Risk During Market Volatility
Liquidity isn’t a fixed property of an asset — it changes with market conditions, and it tends to deteriorate fastest exactly when it’s needed most. During sharp selloffs or periods of acute uncertainty, market makers and liquidity providers often widen spreads and pull resting orders to protect themselves from adverse price moves, meaning even normally liquid stocks can temporarily behave like illiquid ones. This dynamic — sometimes described as a “liquidity black hole” in extreme cases — is part of what drove flash-crash style events, where prices moved sharply not because fundamental value changed but because resting liquidity briefly vanished from the order book.
This is a real, practical risk distinct from the everyday liquidity differences covered elsewhere in this guide: an asset that trades with a tight spread on a calm day can show a dramatically wider spread and thinner book during a volatile session, without any change in the underlying company or asset. Watching how a specific instrument’s bid-ask spread and order book depth actually behave during past volatile sessions — rather than assuming today’s calm liquidity conditions will hold under stress — is a more reliable read than relying on typical daily volume alone. For a deeper look at spread behavior specifically, see Bookmap’s guide to spreads in financial markets, and for how to watch this play out in the order book directly, Bookmap’s deep dive into order flow and liquidity analysis.
Does Liquidity Affect Investment Returns?
Yes, in two related but distinct ways. First, the illiquidity premium covered earlier means less liquid assets often carry higher expected returns to compensate investors for the risk of not being able to exit quickly. Second, and more direct for active traders: poor liquidity directly erodes realized returns through wider spreads and slippage — the difference between a strategy’s return on paper and its actual return after the real cost of entering and exiting a less liquid position. A strategy that looks profitable ignoring transaction costs can turn unprofitable once realistic slippage on a genuinely illiquid asset is factored in.
Strategies for Different Liquidity Levels
Trading strategies vary based on liquidity levels. Traders employ different strategies for effectively dealing with high and low-liquidity stocks, such as:
- Scalping,
- High-frequency Trade (HFT),
- Swing Trading, and
- Position Trading.
Let’s understand these strategies in detail:
What is scalping as a trading strategy?
- In trading, scalping refers to making numerous trades within a single day to profit from small price movements.
- Scalpers aim to capitalize on minute changes in stock prices.
- To do so, they often hold positions for only a few seconds to minutes.
How do traders capitalize on liquidity?
| Tighter Spreads | Faster Execution |
and
|
|
Let’s understand the scalping strategy better through a hypothetical scenario:
Scenario
- Say there exists a highly liquid tech stock.
- This stock is known for its:
- Large trading volume
and
- Tight bid-ask spreads.
Market Conditions
- On a particular trading day, the stock witnessed a high-volume trading session.
- On the opening hour of the market, the stock experiences significant trading activity.
Execution
- A scalper monitors the stock’s price action.
- They do so by using real-time data and advanced charting tools.
- They identify small price fluctuations within the tight spread.
Trade Example
- Assume that
- The bid price is $150.00.
- The ask price is $150.02.
- The scalper places a buy order at $150.00.
- Within seconds, they place a sell order at $150.02.
- This rapid trade captures a $0.02 profit per share.
Repetition
- The scalper repeats this process multiple times throughout the high-volume session.
- This way, they accumulate numerous small profits.
- Assume that the scalper executed 100 such trades with 100 shares each.
- These trades would result in a total profit of $200 (before transaction costs).
What is High-Frequency Trading (HFT) as a Trading Strategy?
-
- HFT involves using sophisticated algorithms
- Using them, HFT executes a large number of orders at extremely high speeds.
- It must be noted that these algorithms are designed to capitalize on minute price inefficiencies that exist for very brief periods, often fractions of a second.
- HFT relies on advanced technology, which often includes:
- High-speed data feeds,
- Low-latency trading systems, and
- Co-located servers.
How Does HFT Help Traders Capitalize on Liquidity?
| High Liquidity | Minute Inefficiencies |
and
|
|
Let’s understand the HFT strategy better using a hypothetical example
Scenario
- Say there is a highly liquid stock
- Usually, this stock has substantial trading volume and tight bid-ask spreads.
Earnings Announcement
- During an earnings announcement, trading activity in the stock surges.
- The market participants react to the new information and this creates a temporary spike in:
- Liquidity
and
- Volatility.
Real-Time Data Analysis
- HFT algorithms analyze real-time data feeds.
- They spot this increase in trading activity.
Order Placement
- The algorithms detect slight inefficiencies and imbalances in the price of the stock.
- They identify that the bid price is momentarily higher than the asking price due to a lag in order updates.
- It places a buy order at the lower ask price and immediately sells at the higher bid price.
- This way, the algorithm captures the spread.
Rapid Trading
- During the earnings announcement, these algorithms execute thousands of trades per second.
- They exploit the brief inefficiencies before they are corrected by the market.
Profit from Spreads
- Therefore, this HFT strategy profits from the small price differences captured during the brief moments of inefficiency.
- Even if each trade results in a tiny profit, the high volume of trades leads to significant cumulative gains.
What do you mean by Swing Trading?
Swing trading refers to a trading style in which traders hold positions for several days to weeks. They do so to capitalize on expected price movements within this time frame. The primary goal of swing traders is to capture gains from price swings in less liquid stocks, where larger price jumps are more common.
Further, it must be noted that swing trading is well-suited to less liquid stocks. That’s because these stocks experience more significant price swings due to:
- Lower trading volumes
and
- Wider spreads.
Using this strategy, traders take advantage of the volatility inherent in these stocks.
Let’s understand swing trading better using a hypothetical example:
Scenario
- Consider a small-cap biotech company.
- Its stock is less liquid due to its niche market and low trading volume.
Event Catalyst
- The company is awaiting an FDA approval announcement for a new drug.
- Usually, such events generate significant interest and lead to substantial price movements.
- The swing trader uses technical analysis tools, such as:
- Chart patterns,
- Moving averages, and
- Momentum indicators.
- Using them, they are able to predict the stock’s price movement
- They identify a pattern suggesting an upward trend in anticipation of the FDA announcement
Trade Execution
- The trader buys shares at $10 per share when technical indicators suggest a breakout.
- Over the next two weeks, as the FDA approval date approaches, the stock’s price begins to climb.
- That’s because of increased speculation and buying interest.
- The trader sells the shares at $15 per share after the approval is announced.
- By doing so, the trader captured a 50% gain.
What do you mean by Position Trading?
Different from what we read above; position trading involves holding positions for several months to years. Most position holders aim to benefit from:
- Long-term trends
and
- Significant price movements
This strategy is ideal for stocks with low trading volumes and substantial volatility. That’s because it focuses on the overall trend rather than short-term price changes. Furthermore, traders using this strategy are less concerned with:
- Short-term price jumps
and
- Wide spreads
Let’s understand this strategy better using a hypothetical example:
Scenario
- Consider a niche manufacturing company.
- The company has developed a new and innovative product line.
- They are expecting substantial growth.
Fundamental Analysis
- A position trader is interested in the company.
- They conduct a thorough fundamental analysis by assessing:
- The company’s financial health,
- Product potential, and
- Market positioning.
- They determine that the new product line will significantly boost revenues and profits over the next few years.
Trade Execution
- Based on the fundamental analysis, the trader buys shares at $20 per share.
- Over the next 18 months, the company’s new product line gains traction.
- This leads to increased sales and market share.
- The stock gradually appreciates as the market recognizes the company’s growth potential.
- The trader sells the shares at $40 per share after achieving their target price.
- This way, the trader almost doubles their investment.
How Manage Risks When Trading Stocks with Different Liquidity Levels?
By following effective risk management strategies, traders can accommodate greater volatility and minimize their chances of incurring losses. Let’s see how you can manage risks for both high-liquidity and low-liquidity stocks:
| Managing risk for high liquidity stocks | Managing risk for low liquidity stocks |
Place Tighter Stop-Losses
Take-Profit Orders
|
Using Wider Stop-Losses
Careful Order Placement
|
Also, note that trades in low-liquidity stocks influence the market price more significantly. They have a greater potential to create adverse moves against the trader’s position. Let’s see how you can minimize their impact:
- Use limit orders instead of market orders.
- This usage will help you in:
- Controlling the execution price
and
- Preventing unintended price moves.
- Keep monitoring the:
- The price action of the stock
and
- Order book depth.
- This kind of analysis will help you gain insights into the best times and prices for order placement.
Tips for Evaluating and Trading Based on Liquidity
It must be noted that evaluating liquidity is crucial for successful trading.
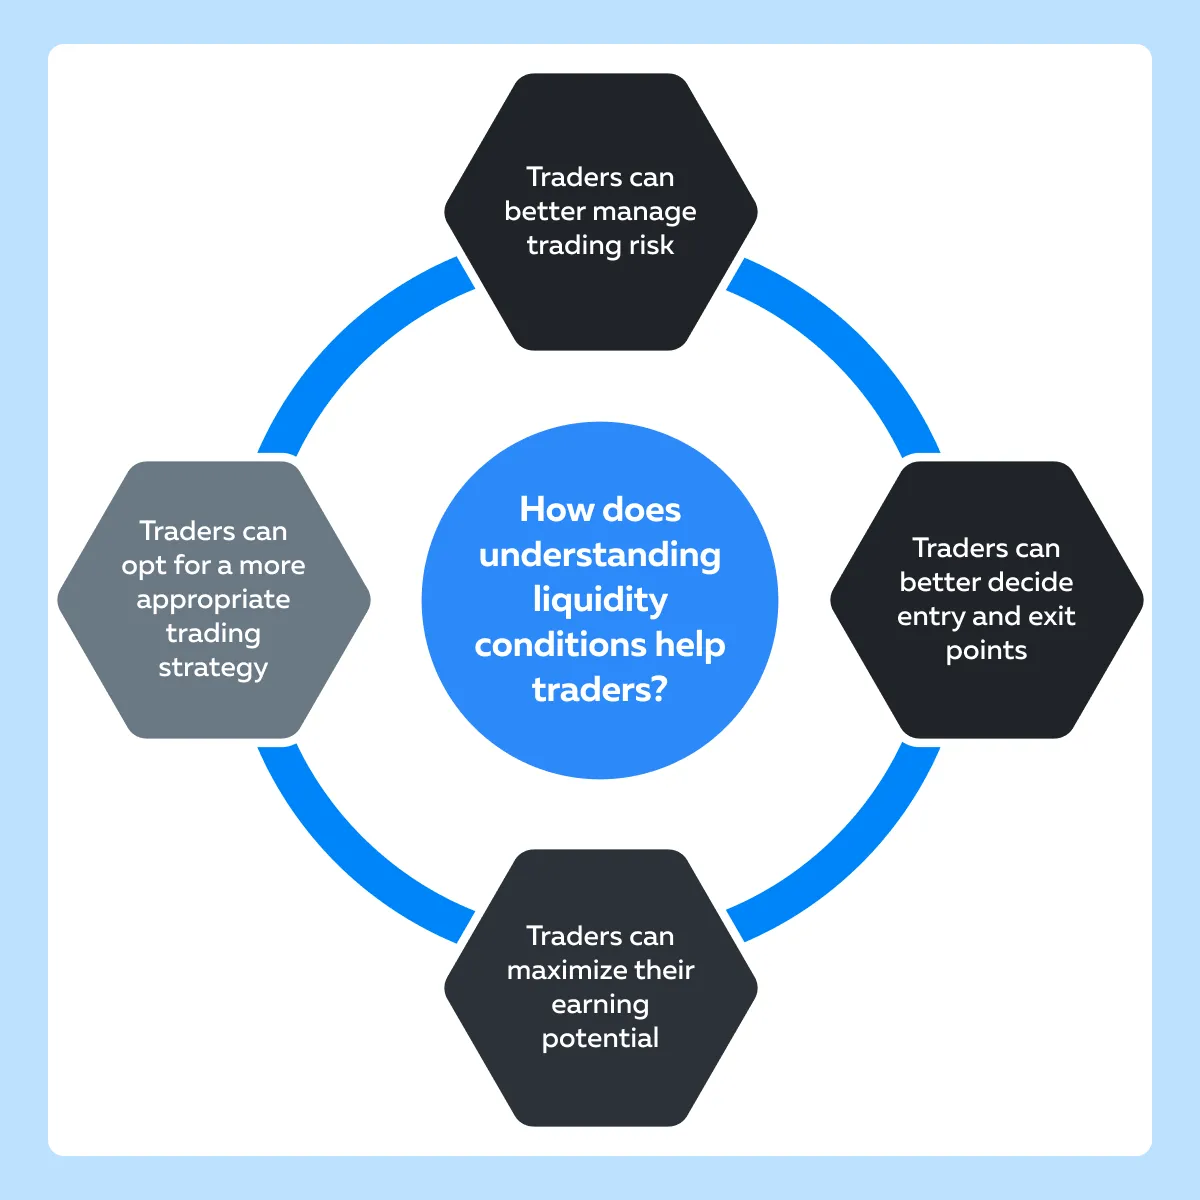
Liquidity assessment can be done by using several tools like:
- Volume bars,
- Depth of market indicators, and
- Historical spread data.
Read the table below to understand their usage:
| Tools | Usage | Interpretation | Example |
| Volume Bars | Volume bars show the number of shares traded during a specific period. They are mostly displayed on price charts. |
|
|
| Depth of Market (DOM) Indicators | DOM indicators (also known as Level 2 quotes) show the real-time order book with the current bids and asks at various price levels. |
|
|
| Historical Spread Data | Historical spread data tracks the difference between the bid and ask prices over time. |
|
|
Now, let’s understand through multiple scenarios how changes in the liquidity information influence trading decisions.
Scenario I: Choosing a Trading Strategy during a Market Event
- Assume that a major tech company is about to release its quarterly earnings report.
- A trader uses volume bars and DOM indicators to observe liquidity.
- They notice increased pre-announcement trading activity and narrow spreads.
- Based on the high liquidity, the trader opts for a high-frequency trading strategy.
- They decide to capitalize on small price movements during the earnings release.
Scenario II: Deciding When to Enter or Exit a Trade
- A trader is considering a swing trade in a small-cap energy stock with known volatility.
- Reviewing historical spread data and volume bars, the trader notices that
- Liquidity tends to spike during midday trading sessions
but
- Drops significantly during market open and close.
- To minimize market impact and avoid wide spreads, the trader plans to enter the position during the midday session.
- That’s because, during the midday session, liquidity is high.
- Also, the trader decided to exit during a similar high-liquidity period.
Scenario III: Adjusting to Market Depth Insights
- A position trader is interested in a niche manufacturing stock expecting growth from a new product launch.
- The trader checks the DOM.
- They find the market depth to be shallow.
- Aware of the low liquidity, the trader decides to enter the position with limited orders spread over several days.
- The trader sets wider stop-loss levels to accommodate potential volatility due to the low liquidity.
Conclusion
A deep understanding of stock market liquidity is essential for making informed trading decisions. Liquidity affects how easily you can buy or sell stocks without causing significant price changes. By analyzing liquidity, you can choose the right trading strategies, manage risks effectively, and improve your chances of achieving better trading outcomes.
Most traders perform liquidity analysis using tools like volume bars, depth of market indicators, and historical spread data. These tools help traders understand how liquid a stock is. For example, high-liquidity stocks support strategies like high-frequency trading, where tighter stop-losses and quick trades are beneficial. On the other hand, low-liquidity stocks require strategies like swing trading or position trading, where you need wider stop-losses and a more patient approach.
By understanding liquidity, you can also avoid high trading costs and eliminate the risk of significant price movements against your position. Furthermore, by using advanced market analysis tools like Bookmap, you can identify true liquidity with ease and gain a competitive position. Learn how you can do so.
FAQ
How do traders find high liquidity stocks?
Traders identify high liquidity stocks by looking for consistently high trading volume, tight bid-ask spreads, and deep order books. These factors indicate strong participation and efficient price discovery.
What is the best indicator for stock liquidity?
There is no single best indicator, but trading volume, bid-ask spread, and market depth together provide a reliable view of liquidity conditions.
Is high liquidity better for short-term trading?
Yes. High liquidity allows for faster execution, lower trading costs, and reduced slippage, which is especially important for day traders and scalpers.
Does low liquidity increase trading risk?
Low liquidity increases the risk of slippage, wider spreads, and sharp price moves caused by relatively small trades. This makes risk management more challenging.
Is real estate a liquid or illiquid investment?
Real estate is generally illiquid — selling a property typically takes weeks to months, involves a limited pool of potential buyers, and carries meaningful transaction costs. REITs offer a more liquid way to gain real estate exposure by trading as publicly listed shares, though the underlying properties they hold remain illiquid.
Does liquidity change during volatile markets?
Yes. Liquidity providers often widen spreads and pull resting orders during sharp selloffs or periods of high uncertainty, which means even normally liquid assets can temporarily trade with much wider spreads and thinner order books than usual. This is part of what has driven historical flash-crash events, where liquidity briefly disappeared rather than fundamental value actually changing.
Sign Up Now
Latest Articles