See supply demand more clearly in real time.
Compare plans to access deeper market visibility for supply demand.
Education
April 30, 2025
SHARE
Why Supply and Demand Still Moves Markets (And How Traders Can See It in Real Time)
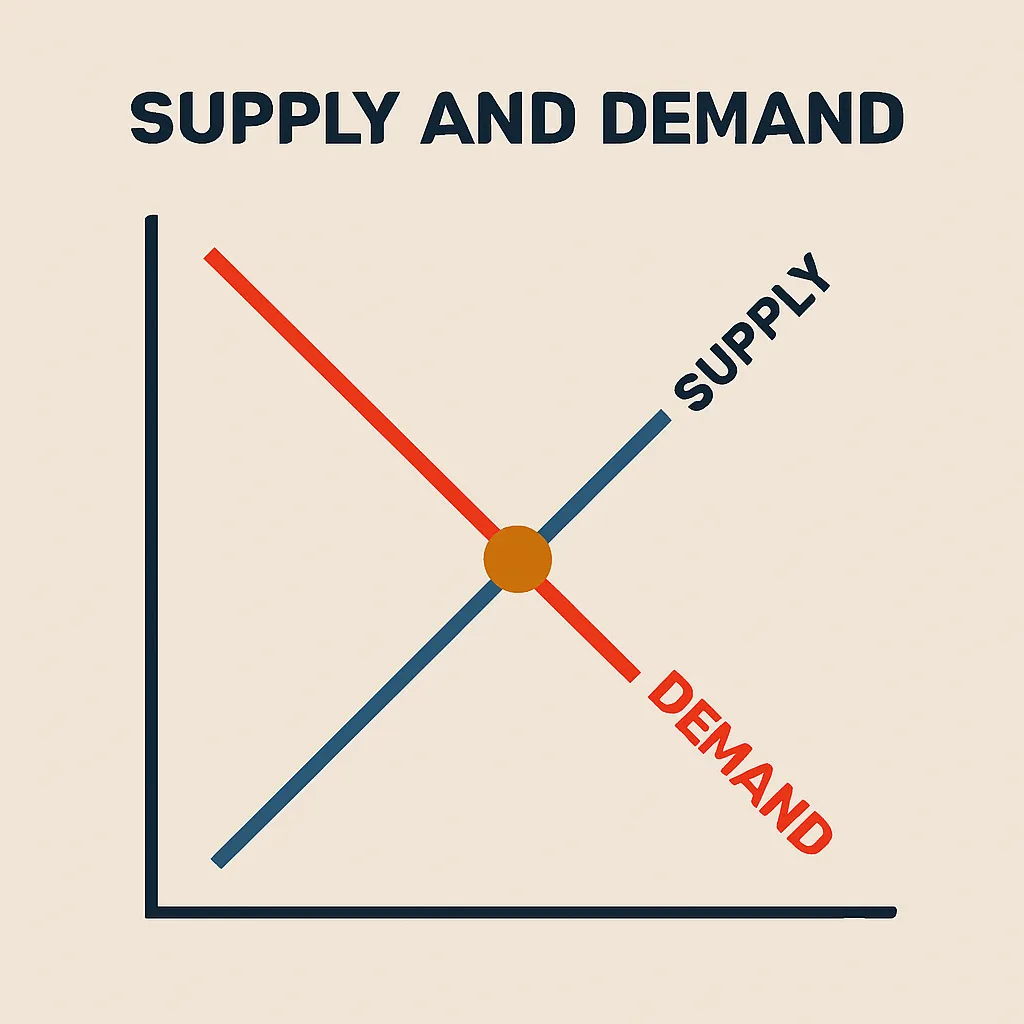
If you’re serious about trading, you’ve probably heard that “price moves because of supply and demand.” But hearing it isn’t enough. Today’s markets—whether it’s futures, stocks, or crypto—require a much sharper understanding of what that really looks like, especially when liquidity shifts faster than ever.
Supply and demand trading isn’t just some old-school concept from trading textbooks. It’s the foundation for how markets move every day. And if you’re not watching liquidity zones unfold in real time, you’re trading blind.
Why Supply and Demand Matters More Than Ever
https://bookmap.com/en/learning-center/supply-demand-setups
Markets Have Changed, But the Core Drivers Haven’t
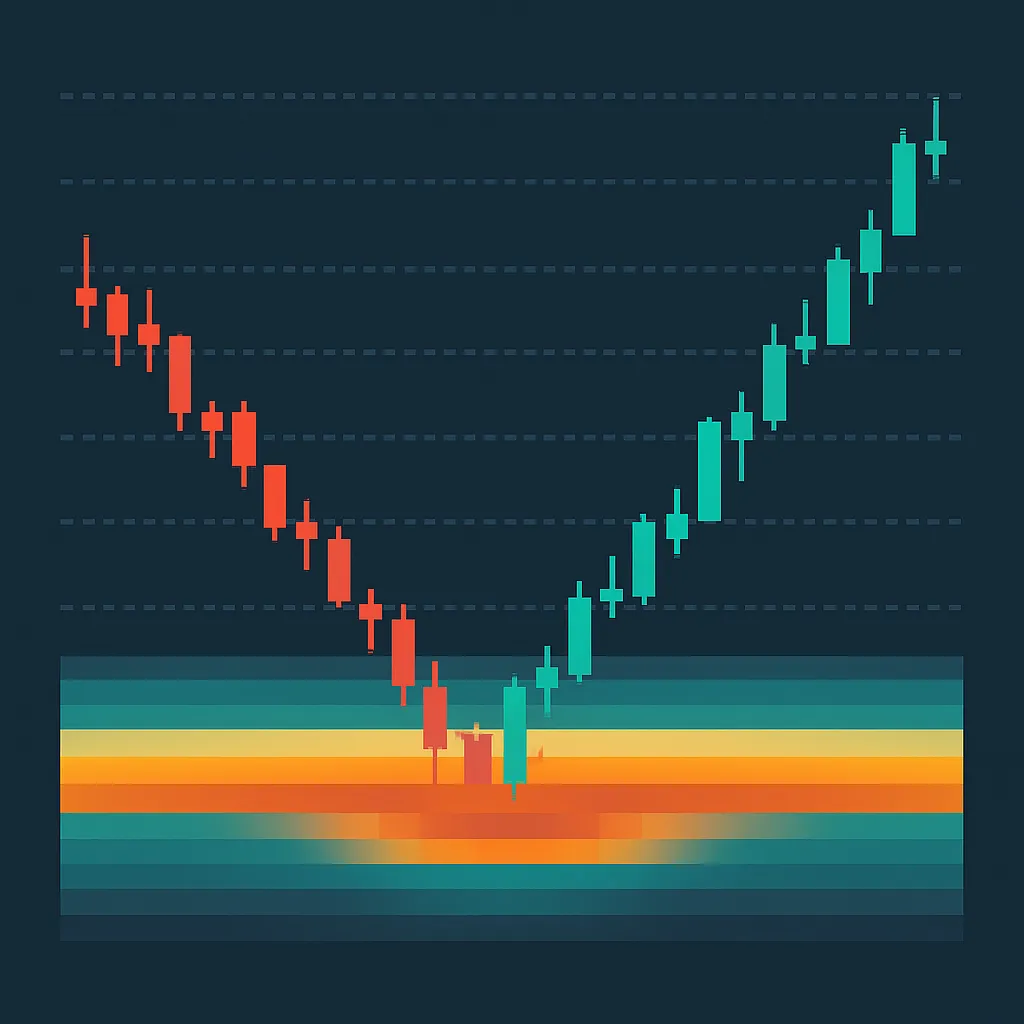
Speed, algorithms, dark pools—sure, the mechanics have changed. But underneath all the tech, markets still move for one reason: an imbalance between buyers and sellers.
What’s changed is how quickly those imbalances form and disappear. Without the ability to track supply and demand live, you’re left reacting instead of anticipating.
That’s exactly where understanding Bookmap supply demand setups comes in.
It’s Not About Guessing Support and Resistance
In the past, traders guessed support and resistance from past price levels. But today, liquidity is dynamic. Bids and offers appear, pull, and shift constantly.
Liquidity zones are the modern trader’s real support and resistance—because they show where actual orders exist right now, not just where price bounced last week.
Real-World Example: Trading Around Live Liquidity Zones
Let’s say you’re watching NQ Futures.
- Price is driving lower fast.
- On your Bookmap chart, you notice a massive bid wall appear at 18,000.
- The sell-off continues… but stalls right at the liquidity wall.
- You also spot aggressive sellers failing to push through, while buyers quietly absorb.
Without seeing supply and demand unfold, you might think the downtrend will continue.
With it, you recognize absorption—and the potential for a sharp bounce or even a reversal.
This is the key:
- Supply hitting demand that refuses to budge often precedes major moves.
- Weak liquidity (thin books) can create fake breakouts.
Liquidity tells you the real story behind every price move.
How Bookmap Makes Supply and Demand Visible
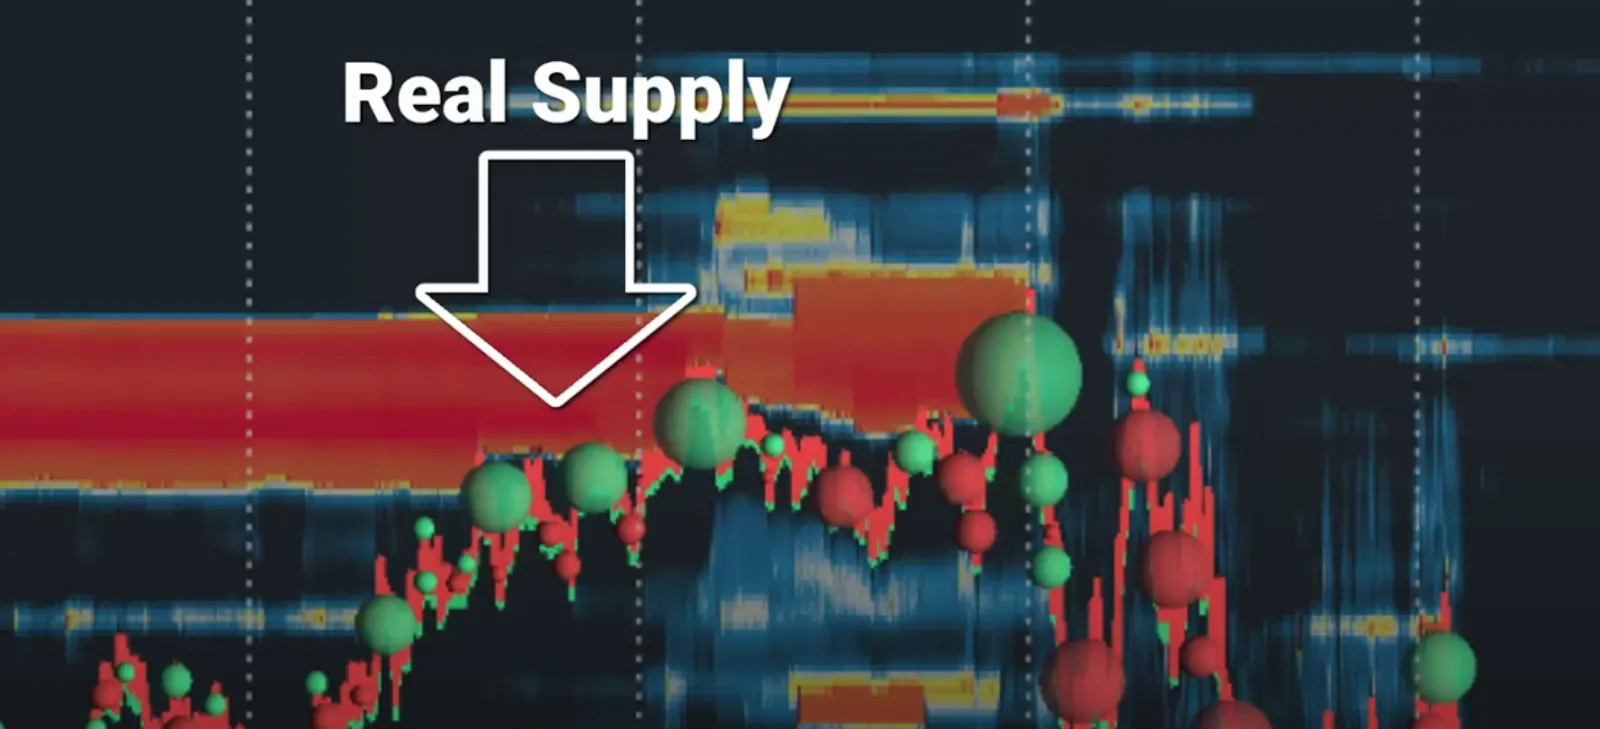
Unlike traditional charts, Bookmap shows you the live order book—visualized in an intuitive heatmap.
Here’s how you spot real supply and demand with Bookmap:
1. Heatmap Liquidity Walls
- Bright bands show large limit orders waiting.
- Thick bands = strong interest (potential support/resistance).
2. Real-Time Order Flow
- See whether buyers or sellers are aggressive at key zones.
- Track when liquidity gets absorbed versus rejected.
3. Volume Bubbles
- Volume dots help you spot hidden absorption or sudden shifts in buying/selling pressure.
- Context matters: big volume + no movement = signs of major players.
You’re not guessing based on candles—you’re watching supply and demand happen.
Why a Real Grasp of Supply and Demand Changes Your Trading
Getting a clear read on supply and demand isn’t just a nice-to-have—it changes the way you trade.
When you understand how liquidity shapes the market, you can:
- Spot reversals early, instead of chasing after the move
- Steer clear of fake breakouts caused by thin books
- See why price is reacting in real time, not just guess afterward
- Position alongside bigger players instead of fighting them
In fast-moving markets, having this edge isn’t optional. It’s what separates reactive traders from those who stay a step ahead.
That’s why we built the new course inside the Learning Center—packed with practical setups, real trade breakdowns, and a deeper look at how supply and demand really drive the market.
👉 Check out the Supply & Demand Setups Course here
FAQ
What does supply and demand mean in trading?
Supply and demand in trading refers to the relationship between the quantity of an asset available for sale (supply) and the desire of buyers to purchase it (demand). Price moves when there’s an imbalance between the two.
What are liquidity zones in supply and demand trading?
Liquidity zones are areas where large resting buy or sell orders exist, acting like magnets or barriers to price movement. These zones often predict reversals or consolidations.
How does Bookmap help with supply and demand trading?
Bookmap provides a live visual representation of liquidity and order flow, allowing traders to see supply and demand imbalances as they happen, not after the fact.
Why is it important to track live liquidity when trading?
Tracking live liquidity gives traders insight into where real interest lies, helping to avoid false breakouts and spot potential reversals with more precision.
Sign Up Now