See market more clearly in real time.
Compare plans to access deeper market visibility for market.
Education
January 27, 2025
SHARE
Detecting Algorithmic Footprints in Volatile 2025 Markets
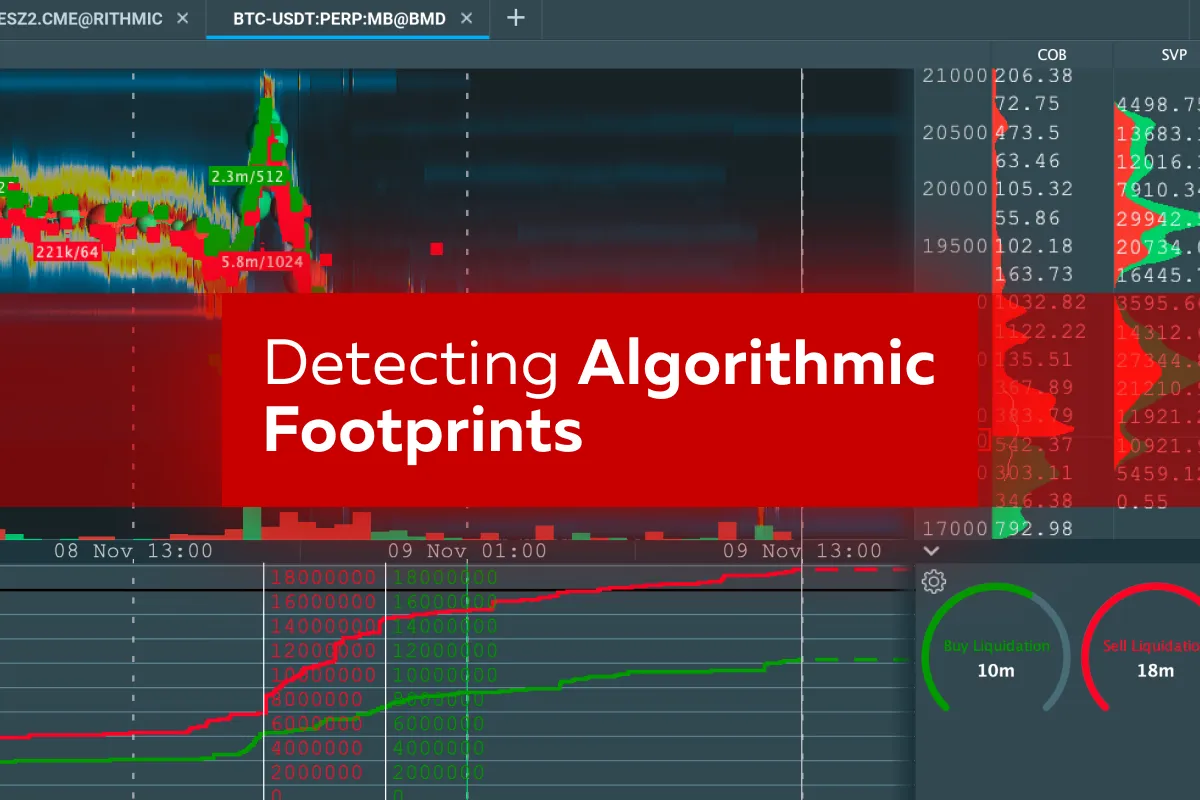
Today’s financial markets are dominated by speed and precision—all thanks to algorithmic trading. But do you know these algorithms leave footprints? Yes! And, recognizing them is like spotting a predator’s trail, which is the key to success and survival.
Learn About Algo Footprint
Want to learn how? In this article, you will learn what algo footprints are and how to detect them using our advanced tools like Bookmap. We will explore its features like the heatmap, CVD, and Liquidity Tracker Pro. We will see how you can use them to uncover hidden liquidity zones, identify market depth distortions, and track order flow imbalances.
You’ll also study real-world examples of spoofing, layering, and other manipulation tactics. By using them, you can protect yourself during market shocks. Additionally, we will discuss how simulations and staying updated on algorithmic techniques can prepare you for future challenges. Let’s get started.
What Are Algorithmic Footprints?
Algorithmic footprints are distinctive patterns or behaviors. They are left behind by algorithmic trading systems in the market. These patterns often manifest in the following:
- Order book,
- Price action, and
- Trading volume.
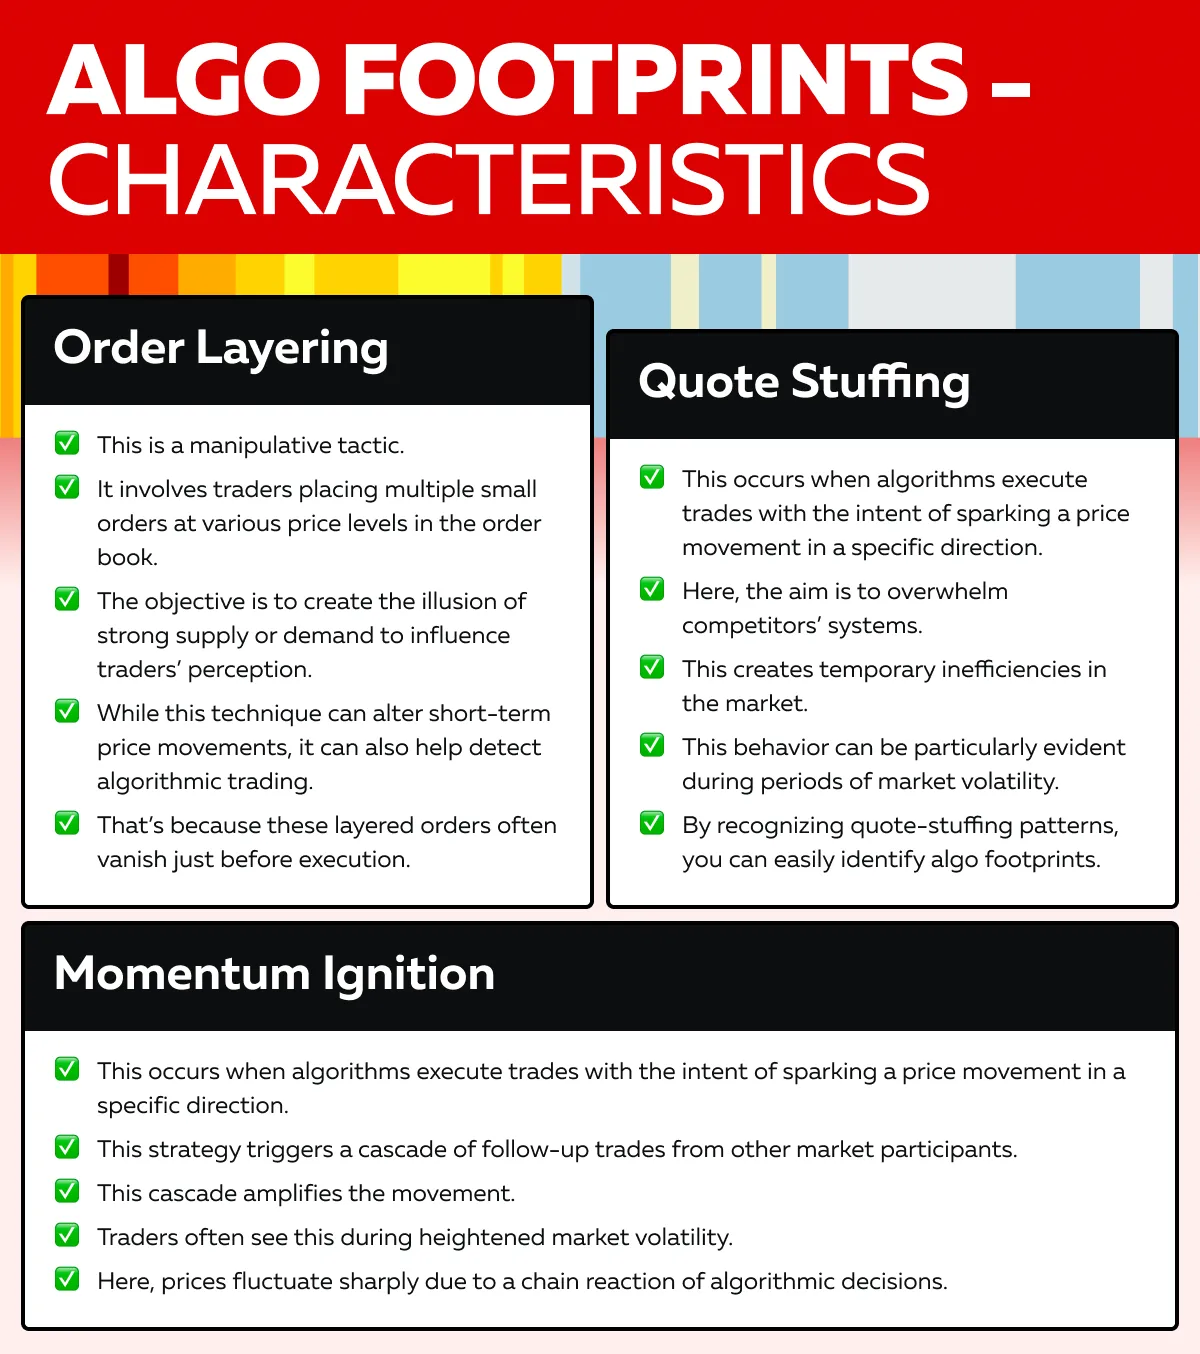
By analyzing them, you can identify algorithmic trading patterns. Let’s have a look at some common characteristics of algo footprints:
How Market Volatility Amplifies Algorithmic Activity?
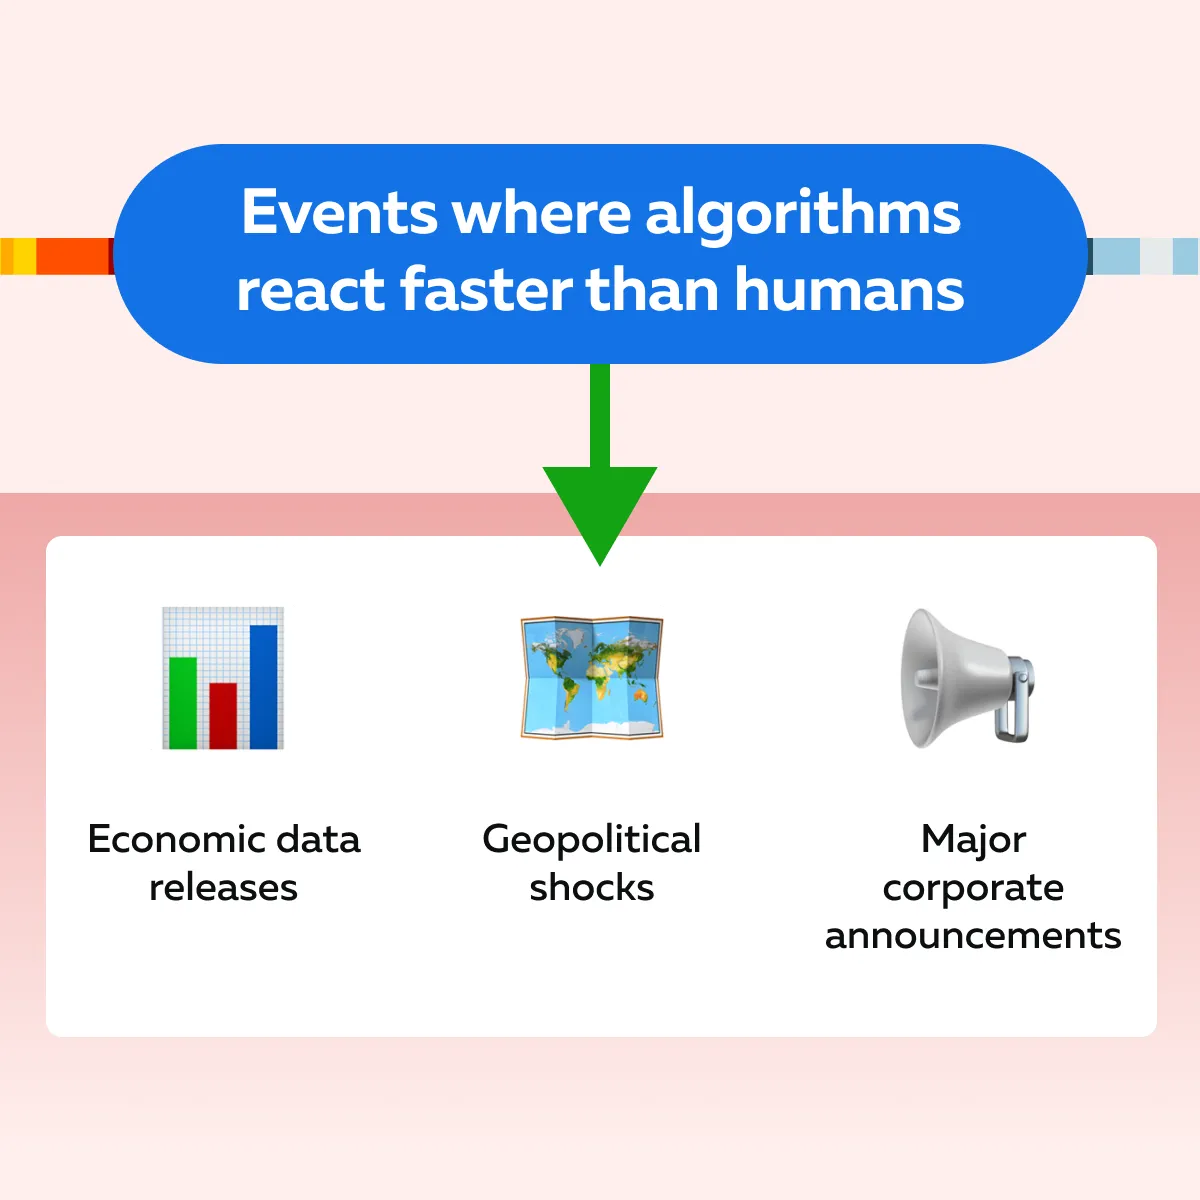
Market volatility leads to rapid price fluctuations. This creates opportunities for high-frequency algorithms. They can execute trades based on pre-programmed strategies. See the graphic below to see specific events where algorithms react far faster than human traders:
Volatility and Algo Triggers
Extreme volatility acts as a catalyst for activating algorithmic trading systems. Please note that these systems are designed to detect anomalies or sudden changes in price action. Consequently, they respond within milliseconds.
Example:
- During the release of a critical CPI (Consumer Price Index) report, prices might spike unpredictably.
- Algorithms (programmed to react to such data) quickly execute buy or sell orders.
- Based on this new information, algos trade before humans can process the implications.
- This leads to a flurry of activity.
- This situation helps competing systems gain an edge by exploiting microseconds of latency.
Order Flow in Volatile Markets
In highly volatile conditions, algorithms often manipulate order flow. They leave behind telltale signs like order flow imbalances or liquidity voids.
Example:
- Suppose, there is a sudden spike in price.
- This spike is followed by the immediate cancellation of large spoofed orders.
- This situation creates a liquidity vacuum in the order book.
- These liquidity voids disrupt normal trading.
- They make it challenging for participants to execute orders without facing unfavorable price slippage.
Be aware such imbalances are a hallmark of algo footprints. They reveal the presence of strategies like spoofing or momentum ignition.
The Best Trader Tools and Methods to Detect Algorithmic Footprints
To detect algorithmic trading patterns, you need certain tools. One of these is our advanced market analysis tool, Bookmap, which identifies even subtle signs of algo activity. It is loaded with several advanced features. See the graphic below to see how it can help you:
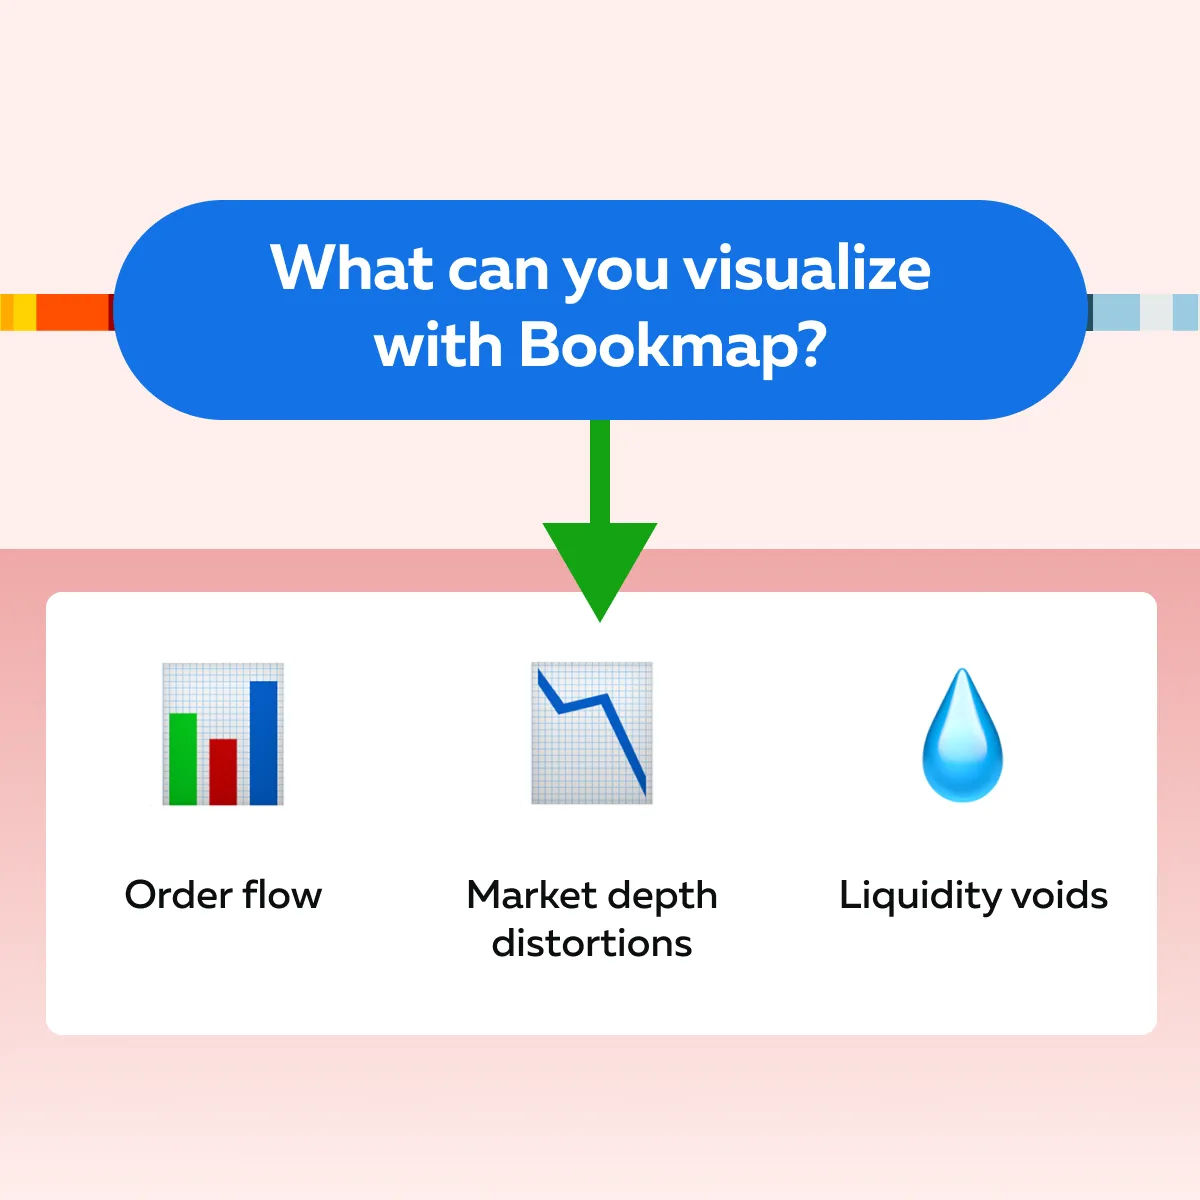
These benefits allow traders to spot algo footprints in real time. Also, you can uncover hidden market manipulation tactics such as these:
- Layering,
- Quote stuffing, and
- Momentum ignition.
This gives traders the insights needed to stay competitive in algo-driven markets. For more clarity, let’s have a look at some advanced and popular features of Bookmap:
A) Heatmap Visualization
Using Bookmap’s heatmap tool, you can visualize real-time liquidity changes in the market. The heatmap graphically represents the order book activity. Through its analysis, you can identify patterns and strategies commonly associated with algorithmic trading.
The heatmap displays price levels as gradients of color. Brighter areas of the heatmap indicate higher concentrations of orders. Let’s understand better through a practical example:
- Let’s say, you are monitoring Bitcoin’s order book during a highly volatile trading session.
- Using Bookmap’s heatmap, you notice the following:
- At the $28,500 price level, large buy orders suddenly appear.
- This creates a bright concentration on the heatmap.
- Simultaneously, similar large orders show up at $28,400 and $28,300.
- Now, you must note that these stacked levels suggest potential order layering.
- As the price begins to approach $28,500, the heatmap reveals that these large buy orders are suddenly canceled before they can be executed.
- This behavior aligns with layered spoofing activity.
- It is a classic example of algo footprints.
B) DOM Pro (Depth of Market)
The DOM Pro add-on for Bookmap provides traders with a highly granular view of:
and
- Volume shifts in real-time.
See the graphic below to learn what you can monitor with it:
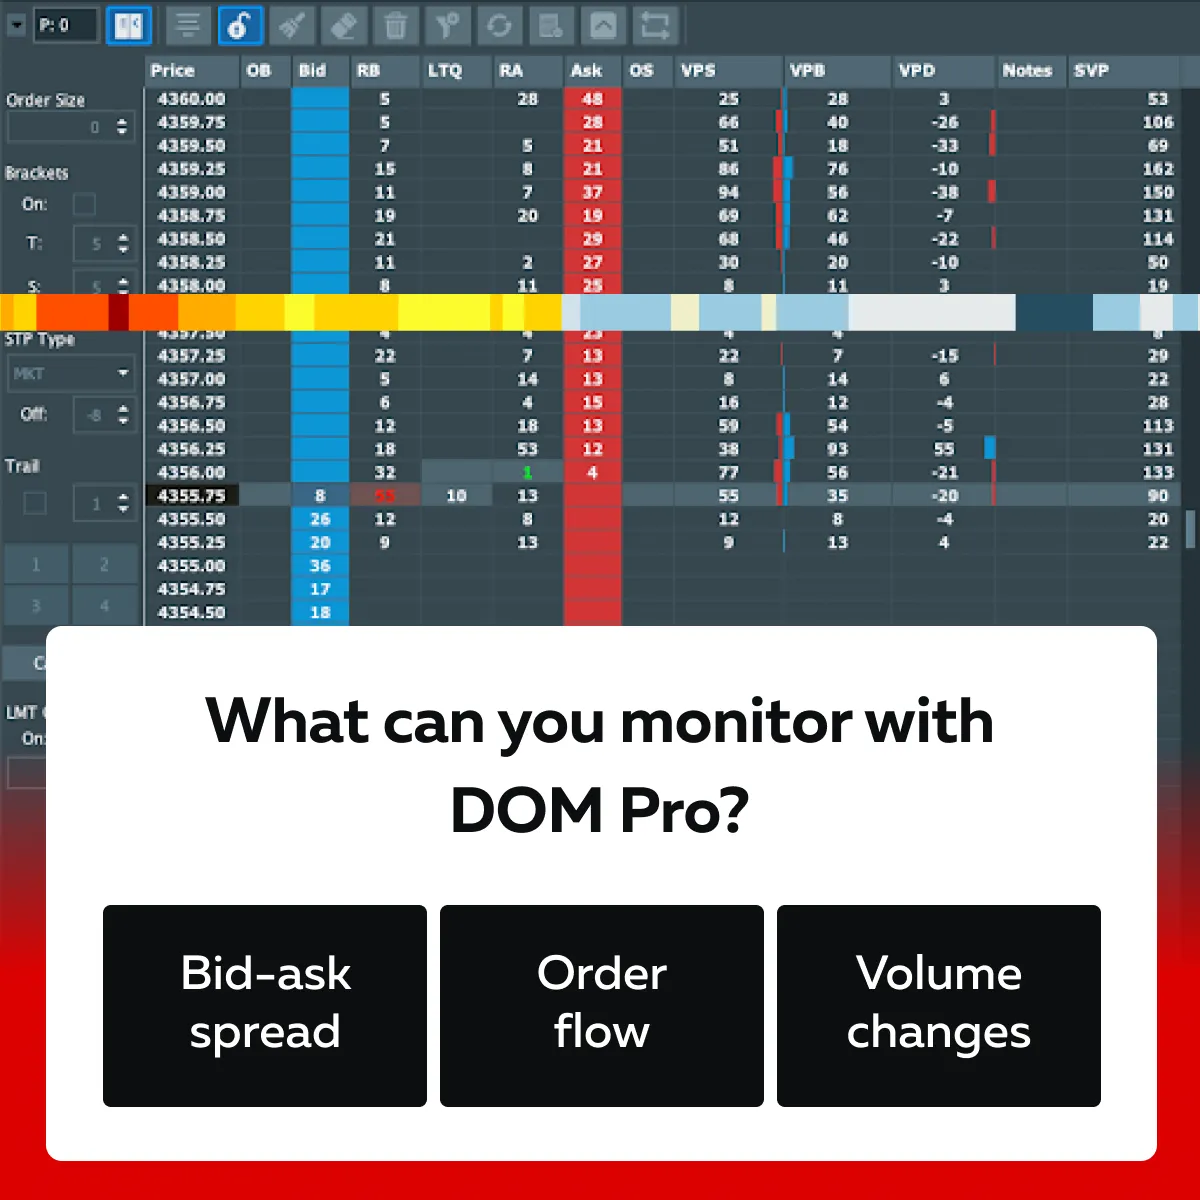
It is worth mentioning that DOM Pro visualizes the number of bids (buy orders) and asks (sell orders) at each price level. This helps you understand the following:
- Where is liquidity concentrated?
- How are orders added or removed?
- What are the different behaviors that suggest the presence of algorithmic strategies like momentum ignition or spoofing?
Let’s understand better through an example:
- Suppose, you’re using DOM Pro to monitor Ethereum (ETH) trading.
- The current price of ETH is $1,750.
Here’s what you observe:
-
- Initial Behavior:
- At $1,755, a large cluster of sell orders (asks) totaling 1,200 ETH suddenly appears in the DOM.
- This indicates a strong resistance level.
- Similarly, smaller clusters of buy orders (bids) appear at $1,745 and $1,740.
- Initial Behavior:
- Rapid Shifts:
-
-
- As the ETH price edges up to $1,755, you notice a rapid disappearance of these large sell orders on the ask side.
- At the same time, aggressive bids (buy orders) totaling 800 ETH appear at $1,753, $1,754, and $1,755.
-
- Price Reaction
-
- This sudden bid-side strength triggers a breakout above $1,755.
- It causes the price to spike to $1,770 within seconds.
- However, once the price moves higher, the aggressive bids at $1,753 and $1,754 vanish just as quickly as they appeared.
Interpreting the Behavior:
This pattern strongly aligns with momentum ignition tactics. This type of activity leaves behind classic algo footprints, such as:
- Sudden changes in bid/ask volumes
and
- Temporary liquidity voids.
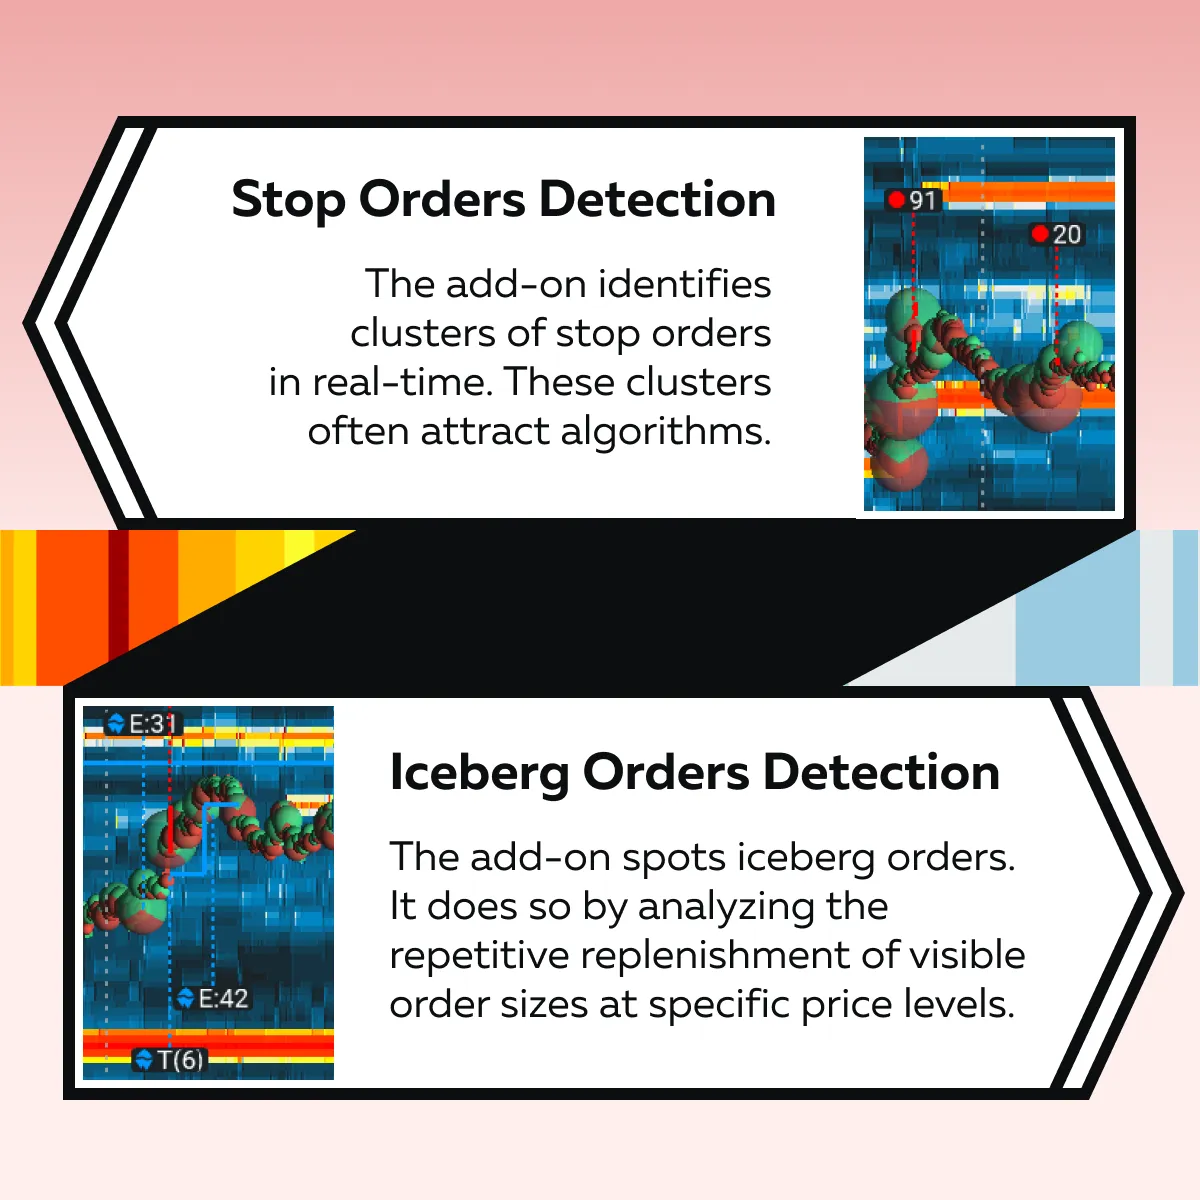
C) Stops & Icebergs Add-Ons:
Using the Stops & Icebergs add-ons, you can track hidden liquidity. This helps you better understand the behavior of large players in the market. These tools help you with the following tasks:
- Identify stop orders and iceberg orders.
- Reveal activity that is not immediately visible in the standard order book.
- Detect algorithmic trading patterns.
- Adjust your strategies during periods of market volatility.
For more clarity, see the graphic below to check how the add-ons work:
Now, let’s study a practical example:
Imagine you are trading Bitcoin (BTC) at $32,500 during a volatile session. Using the Stops & Icebergs add-ons, you observe the following:
- At $32,450, you notice a visible bid of 5 BTC.
- However, as this order gets filled, it is immediately replenished multiple times.
- In total, you calculate that over 200 BTC has been executed at this level, even though only 5 BTC was visible at any given time.
- This behavior strongly indicates the presence of iceberg orders.
- Now, at the $32,400 level, the add-on reveals a cluster of stop orders totaling 150 BTC.
- Shortly after, the price dips rapidly to $32,400, triggering these stops.
- This cascade accelerates the sell-off.
- As a result, BTC temporarily drops to $32,350 before recovering.
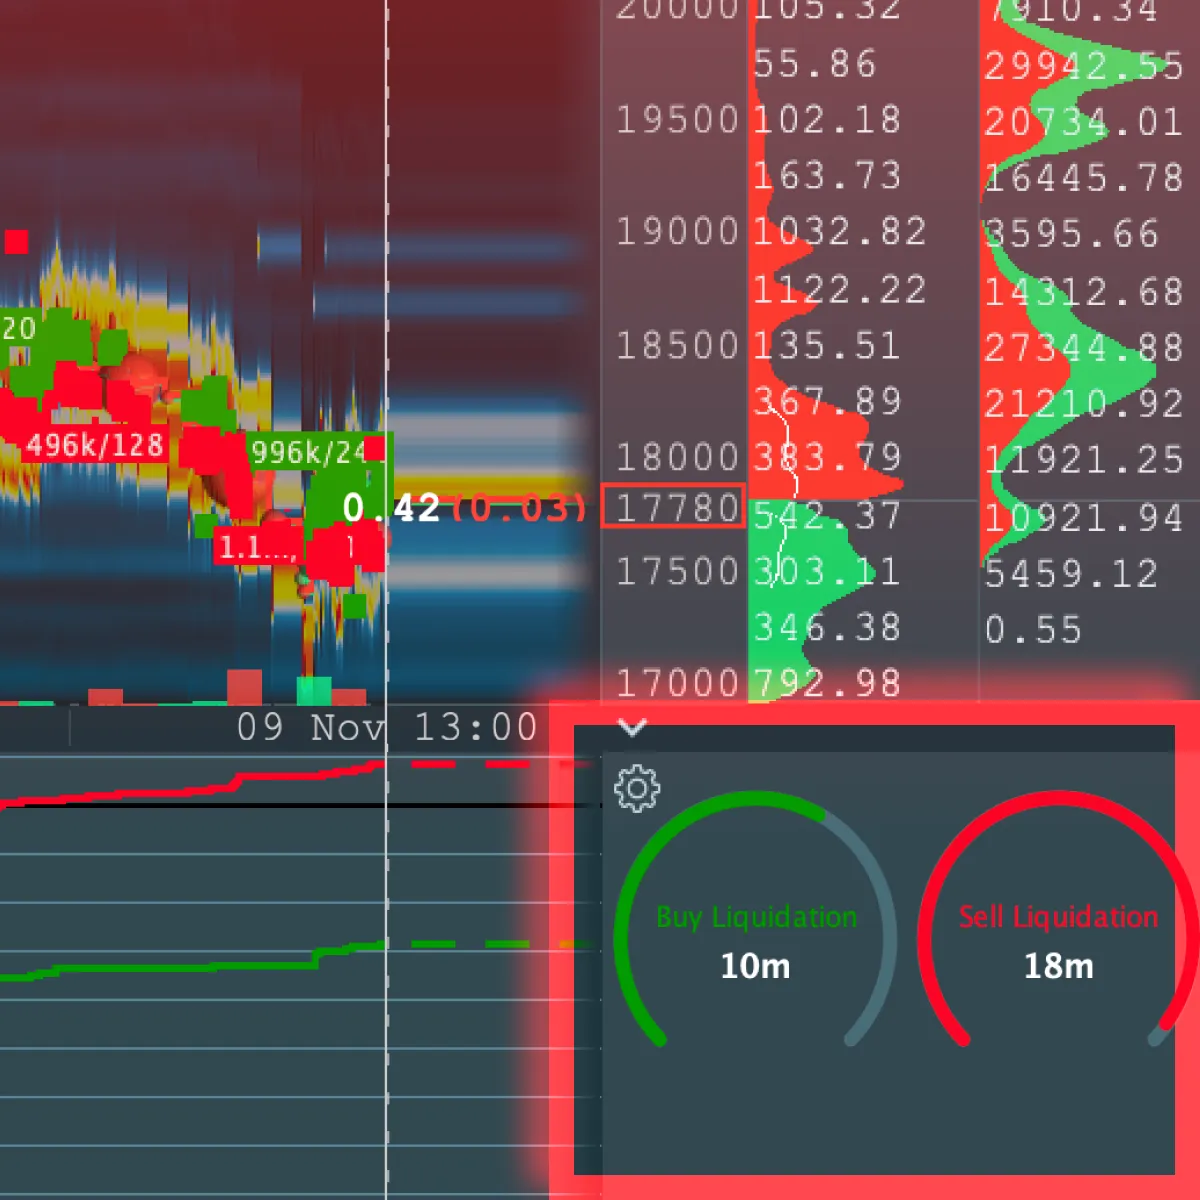
D) Liquidity Tracker Pro
The Liquidity Tracker Pro add-on allows you to monitor real-time and historical bid/ask liquidity changes across the entire market depth. Using it, you can easily visualize how liquidity shifts over time. It allows you to identify zones of strength or weakness in the order book. This is especially useful for spotting algo footprints and detecting algorithmic trading patterns.
Now, let’s see how Liquidity Tracker Pro works:
- This add-on tracks the distribution of liquidity.
- This tracking is done at both bids and asks and at various price levels in real time.
- By doing so, it highlights liquidity changes.
- This helps you pinpoint where the market is vulnerable to algorithmic trading strategies or where inefficiencies exist.
For more clarity, let’s see a practical example:
- Say you are trading Bitcoin (BTC).
- It is currently priced at $30,000.
Using Liquidity Tracker Pro, you observe the following:
- High-Liquidity Zones:
- On the bid side (buy orders), there’s strong liquidity at $29,900.
- Also, 500 BTC is stacked across multiple levels.
- On the ask side (sell orders), $30,100 has a concentration of 400 BTC.
- These zones indicate significant support and resistance levels.
- Thin Liquidity Zone:
- Between $30,000 and $30,050, Liquidity Tracker Pro reveals an area of thin liquidity.
- It shows only 50 BTC in total bids and asks.
- This zone is vulnerable to rapid price fluctuations.
- That’s because it lacks enough orders to absorb large trades.
- Algorithmic Activity:
- Suddenly, an algorithm places and cancels 200 BTC worth of sell orders at $30,020.
- This creates the illusion of selling pressure.
- This action temporarily pushes the price downward to $30,000.
- Here, another algorithm accumulates BTC at the higher-liquidity zone.
- This type of behavior, known as momentum ignition, is a clear example of algo footprints in action.
E) CVD (Cumulative Volume Delta)
Bookmap’s Cumulative Volume Delta (CVD) tracks the net difference between aggressive buy and sell orders in the market. It allows you to understand:
- Whether buying or selling pressure dominates market sentiment,
- Algorithmic trading patterns, and
- If algos are driving bullish or bearish momentum.
Now, let’s see how the CVD feature works:
The CVD calculates the difference between these two (A – B):
|
|
| Market orders that consume liquidity from the ask side. | Market orders that consume liquidity from the bid side. |
The result (A – B) is plotted as a cumulative line. Here, upward movement indicates bullish pressure (more aggressive buys) and downward movement signals bearish pressure (more aggressive sells).
Let’s understand better through an example:
Say you’re trading Bitcoin (BTC). It is currently priced at $27,000. Here’s what you observe using Bookmap’s CVD:
- CVD Divergence:
- Over a 15-minute period, the price of BTC steadily rises from $27,000 to $27,200.
- However, the CVD line is trending downward.
- It shows that aggressive sell orders dominate.
- This indicates a divergence and is a sign of algo footprints.
- In this case, an algorithm might be using spoofing or absorption tactics.
- These tactics are used to sell into the upward price momentum while concealing its true bearish intent.
- Bullish Momentum Ignition:
- Suddenly, the CVD spikes upward.
- This happens as a burst of aggressive buy orders totaling 500 BTC floods the market at $27,250.
- This buying pressure pushes the price up to $27,400 in minutes.
- The abrupt nature of this activity suggests momentum ignition.
- Here, algorithms deliberately create upward momentum to lure other buyers into the market.
- Detecting hidden algorithmic trading patterns using CVD:
| Absorption | Momentum Reversals |
|
|
Detect algorithmic trading activity and adapt to market shocks with Bookmap’s advanced indicators.
F) Pattern Recognition in Price Action
The most important thing in modern trading is recognizing patterns. When you start recognizing patterns in “price action”, you can spot the presence of algorithms. Common patterns, such as sudden, exaggerated price movements followed by sharp reversals, are often linked to momentum ignition.
Using tools like Time-and-Sales Analysis, traders can identify these algorithmic trading patterns by monitoring:
- Trade clusters,
- Order size repetition, and
- Rapid execution speeds.
How to Recognize Momentum Ignition Patterns?
Momentum ignition is a common tactic. Check the graphic below to learn how it operates:
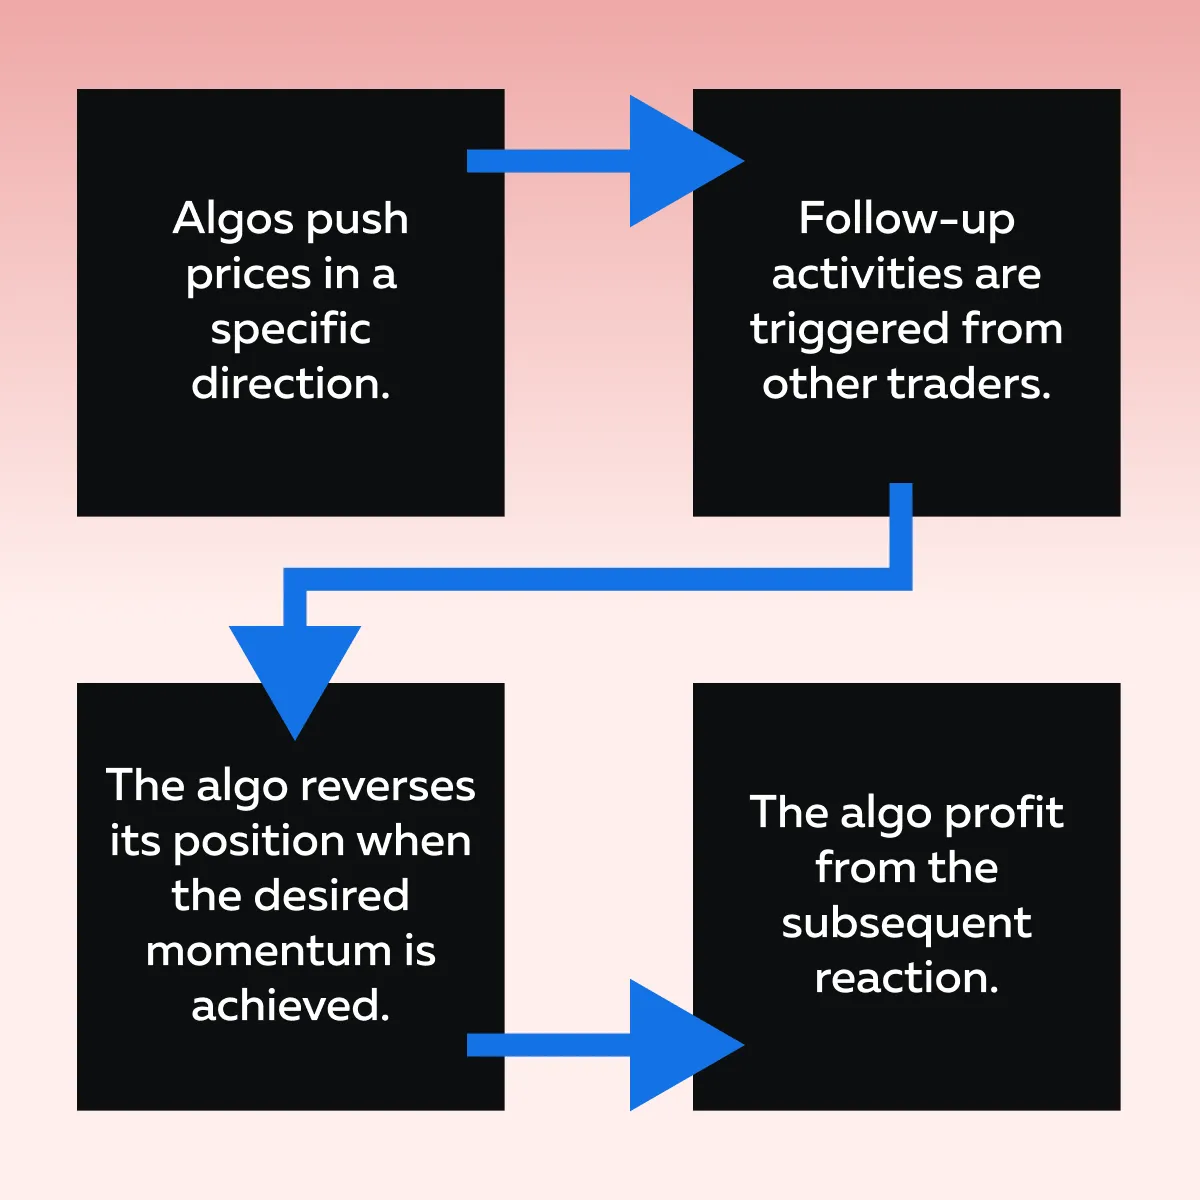
Let’s understand better through an example:
- Say BTC is trading at $28,000 during a quiet market session.
- In the span of 30 seconds, aggressive buying activity pushes the price up to $28,200.
- This creates a sudden spike.
- Just as quickly, the price reverses to $27,900.
- This leaves traders caught off guard.
Upon closer inspection using Bookmap’s Time-and-Sales Analysis, you notice the following clues:
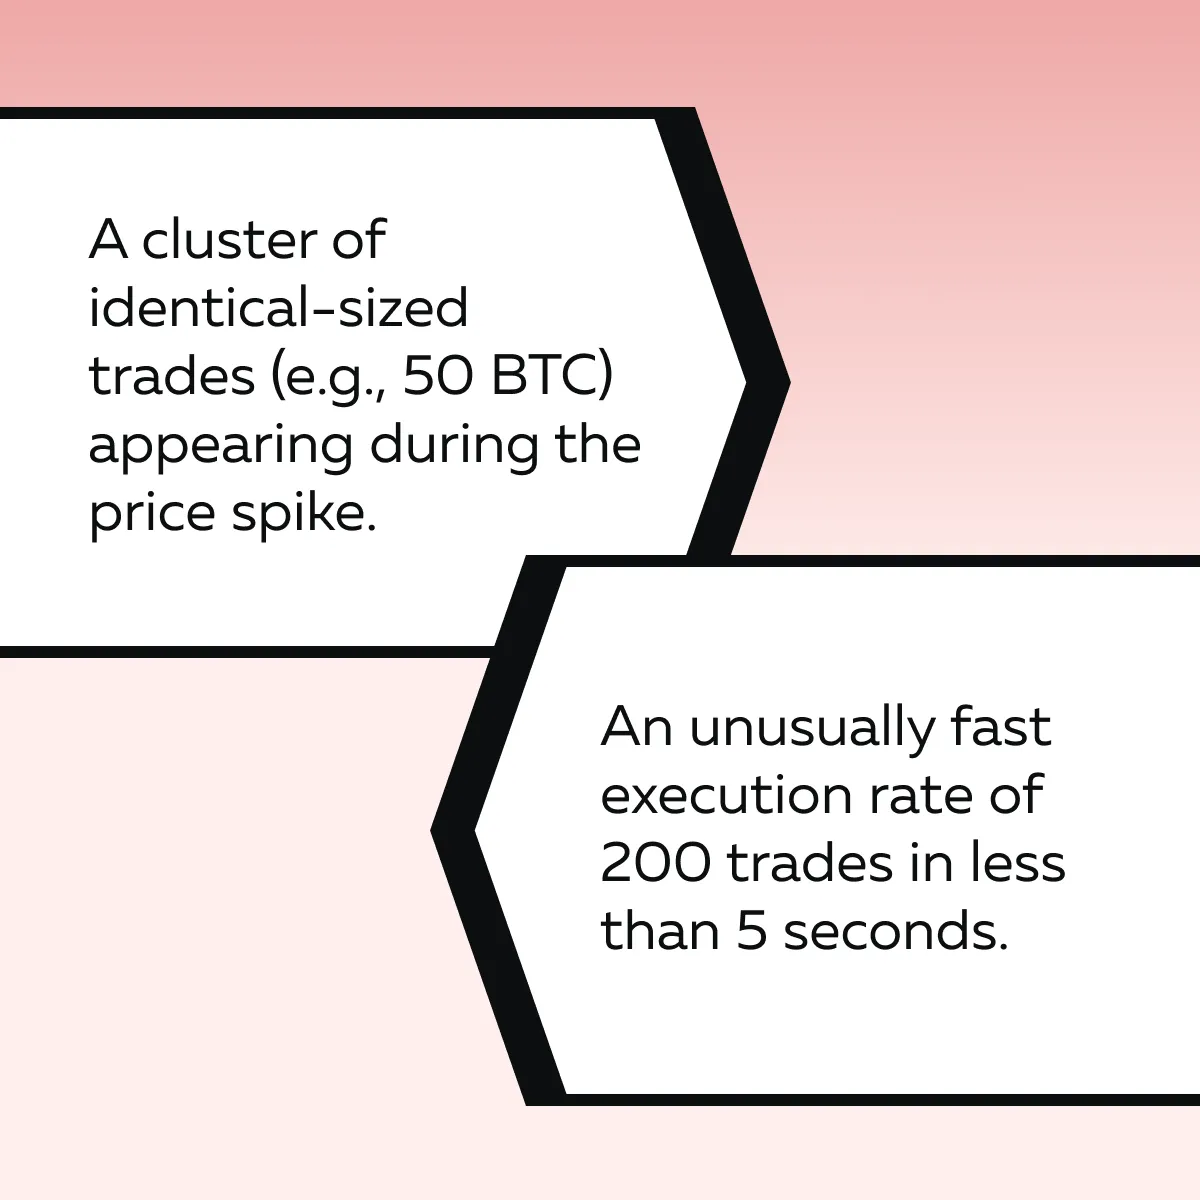
These behaviors strongly suggest algo footprints. Here, algorithms execute buy orders to ignite upward momentum, only to dump its position at higher prices during the reversal.
How Time-and-Sales Analysis Detects Algo Activity?
Time-and-Sales Analysis (commonly referred to as “reading the tape”) is used to detect algorithmic trading. It displays each individual trade in real time and shows the size, price, and timing of executions. Here’s how it helps:
| Clusters of Identical Trade Sizes | Unusually Fast Order Execution |
|
|
G) Volume Profile Analysis
Volume Profile Analysis helps you visualize trading activity. It lets you understand the following:
| High-volume nodes (HVNs) | Gaps (low-volume areas) |
|
|
Here, traders pinpoint areas where algorithms drive:
- Accumulation,
- Distribution, and
- Market inefficiencies.
These volume patterns help traders detect algorithmic trading patterns. Let’s understand better through a practical example:
- Say you’re trading Bitcoin (BTC).
- It is currently priced at $25,000.
You are analyzing the volume profile over the past trading day and the following:
| Identifying a High-Volume Node | Low-Volume Gap at $25,100 –
$25,200 |
|
| Meaning |
|
|
| Interpretation |
|
|
H) Behavioral Indicators

It is one of the key methods for detecting algorithmic trading activity. Here, you detect manipulation by analyzing behavioral indicators like the quote-to-trade ratio. This ratio compares the following:
- Number of quotes (limit orders) placed
to
- Number of actual trades executed.
A high quote-to-trade ratio indicates that algorithms are manipulating the market. It posts numerous orders without intending to execute them. This tactic is commonly associated with strategies like spoofing or quote stuffing.
Let’s understand better through an example:
- Say you are observing Bitcoin (BTC) price action.
- It is currently at $28,500.
By using Bookmap’s behavioral indicators, you can observe the following:
| Quote activity | Interpreting High Quote Activity | Impact of Quote Stuffing |
|
|
|
Adapting to Algorithmic-Driven Volatility
Due to algorithmic trading, market volatility in 2025 is expected to be influenced by high-speed and data-driven strategies. Learn the capabilities of algorithms through the graphic below:
Now, let’s understand in detail how algorithms shape market dynamics and how you can stay competitive in such algo-driven markets:
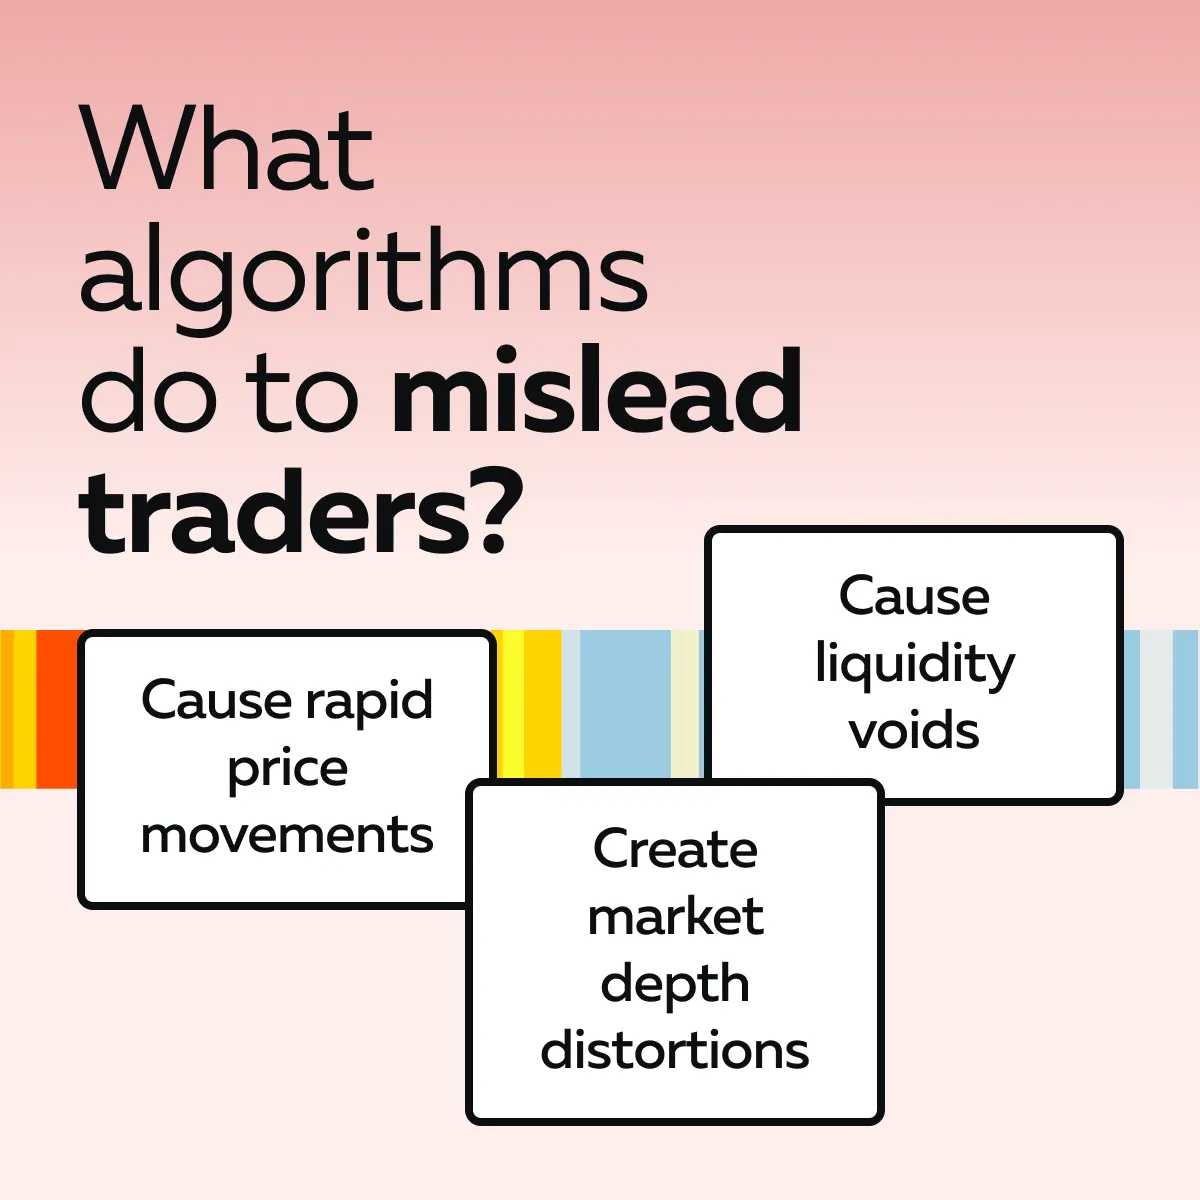
How do Algorithms Shape Market Dynamics?
Algorithms are programmed to respond to market conditions with speed and precision. Humans can’t match them. This mismatch creates patterns and behaviors that are misleading or even manipulative. To spot algos, you need to recognize patterns like these:
- Market depth distortions,
- Liquidity voids, and
- Specific order book patterns.
Such pattern recognition helps you protect yourself from likely manipulation. For more clarity, let’s learn more about them:
1. Market Depth Distortions
Algorithms temporarily distort market depth. They do so by placing large orders at specific price levels in the order book. This creates an illusion of strong support or resistance. These large orders are often part of an algorithmic strategy to manipulate price perception. This makes other traders think there is significant demand or supply at those levels.
Example:
- Suppose, Bitcoin (BTC) is trading at $28,500.
- An algorithm places an order to buy 500 BTC at $28,450.
- This makes it appear as if there is strong support just below the market price.
- However, the order is canceled quickly and no actual trades are executed.
- Other traders see this large buy order and think the price won’t fall below $28,450.
- This causes them to buy in anticipation of the support holding.
The quote-to-trade ratio during this period shows that a large number of orders are placed but not executed (hinting at algo manipulation). The price then drops rapidly when the algorithm cancels its orders. This leaves traders who acted on the false support trapped. Such a market depth distortion is a clear example of algo footprints.
2. Liquidity Voids
A liquidity void is created when algorithms quickly cancel large orders. By doing so, they leave behind thin liquidity zones in the market. These voids also cause significant price slippage, where prices move rapidly due to the lack of orders to absorb trades. In times of market volatility in 2025, this behavior is expected. During these times, algorithms exploit market inefficiencies to trigger price movements and profit from momentum ignition strategies.
Example:
- Let’s say Ethereum (ETH) is trading at around $1,850.
- A large sell order for 5,000 ETH is placed at $1,840.
- As the price nears this order, the algo quickly cancels it.
- The market (now without that large order) experiences a liquidity void at $1,840.
- The price of ETH falls sharply to $1,830.
- Other traders scramble to fill the gap.
- Some traders expect the liquidity at $1,840 to hold. They are caught off guard.
- They experience slippage as the price quickly moves through the empty zone.
3. Order Book Patterns
Certain recurring order book patterns are hallmarks of algorithmic trading. See the graphic below:
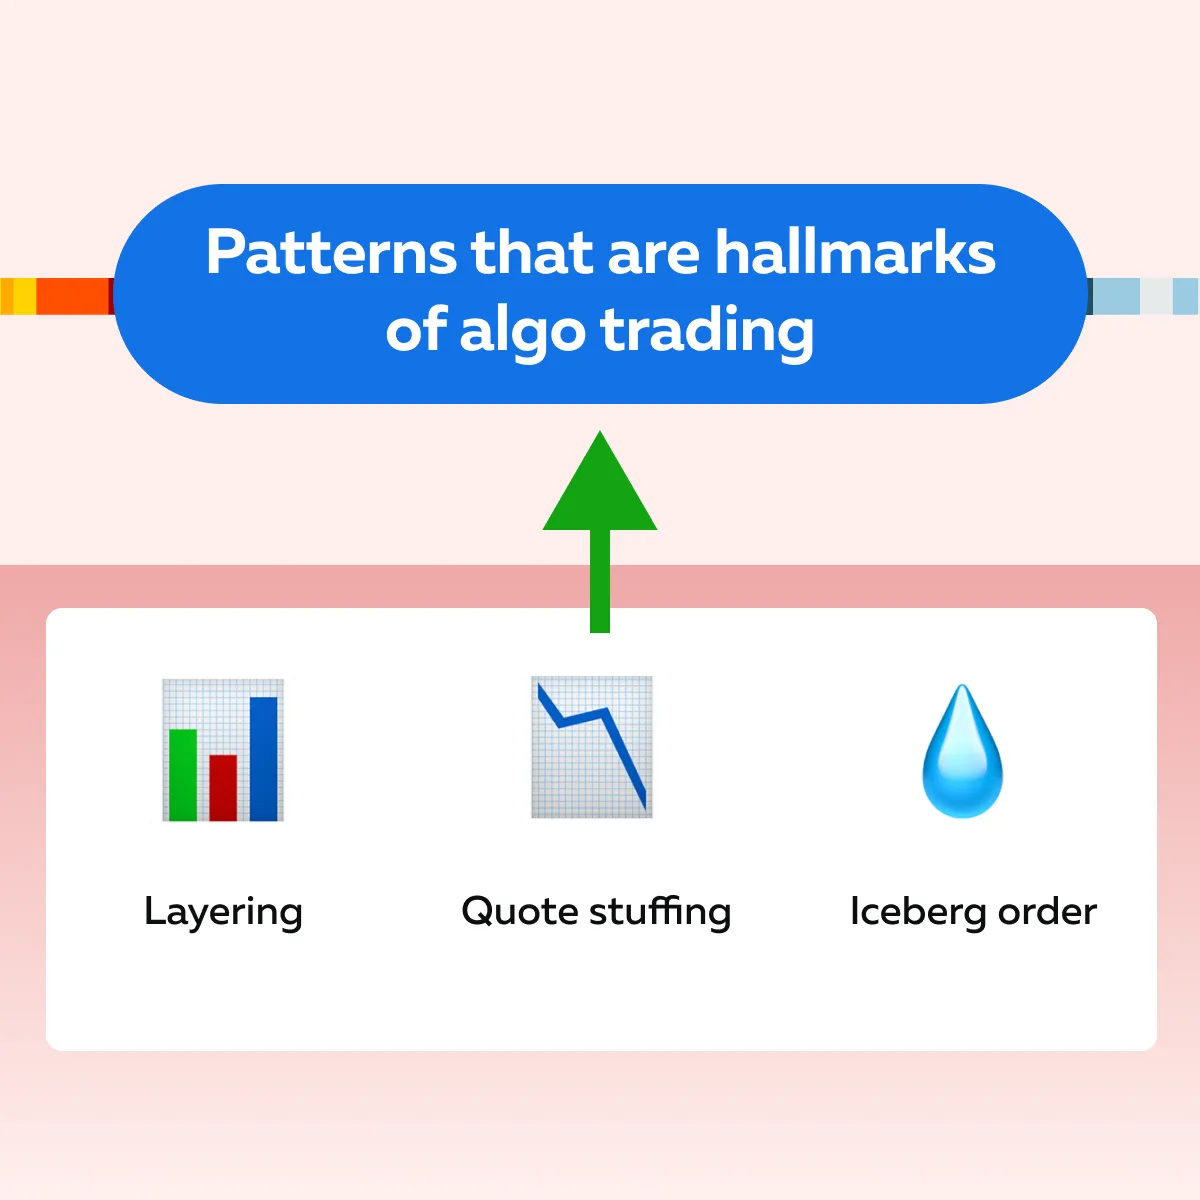
These patterns alter the natural flow of market activity. They significantly affect how the market perceives price levels. Let’s understand them in detail:
| Patterns | Meaning | Example |
| Layering |
|
|
| Quote Stuffing |
|
|
| Iceberg Orders |
|
|
Uncover hidden trading patterns with Bookmap’s real-time order flow and heatmap tools.
Staying Competitive in Algo-Driven Markets
Market volatility in 2025 is expected to increase. Algos will continue to influence market behavior. However, human traders like you can level the playing field by using our advanced market analysis tool, Bookmap. Using it, you can run simulations and even stay updated on the latest algorithmic techniques and regulations. Let’s see how:
1. You Can Use Bookmap and Get Actionable Insights
Bookmap is a powerful tool. Using it, you can detect algo footprints in real-time. It offers a visual representation of the order book and heatmap. Also, Bookmap has several advanced features that allow you to spot:
- Market depth distortions,
- Liquidity voids, and
- Algorithmic behaviors that might otherwise go unnoticed.
Let’s understand better through an example:
Say you are trading Bitcoin (BTC) in a volatile market. Here, algos are driving price movement. Using Bookmap’s heatmap, you:
- Observe sudden changes in liquidity
and
- Spot layered orders placed by algorithms.
By identifying these algo footprints, you positioned yourself to avoid getting trapped in spoofing attempts or false breakouts driven by momentum ignition strategies.
2. You can Run Simulations and Prepare for Algorithmic Behaviors
Using Bookmap, you can run simulations based on past market events. This allows you to familiarize yourself with two important things:
- How do algos behave during periods of market volatility?
and
- How do these systems influence order flow and price action?
Example:
Say you are simulating a market shock, such as a sudden CPI report release. This shock leads to a spike in BTC prices. Through it, you observe how algorithms react to extreme volatility.
- You notice how algos quickly layer orders.
- You saw:
- How does layering create false resistance levels?
or
- How do liquidity voids appear as algos cancel orders during high volatility?
By analyzing these simulated events, you can detect signs of momentum ignition or quote stuffing. This gives you a chance to act faster than the algorithms.
3. You Can Stay Updated on Algorithmic Techniques and Regulations
Ideally, you should stay informed about the latest algorithmic techniques. This helps you avoid falling victim to:
- Advanced spoofing
or
- Other manipulation tactics.
Also, please note that algorithms are becoming increasingly sophisticated. Knowing how they work can help you identify likely manipulative behaviors before they impact the market.
Example:
In recent years, algorithms have been using momentum ignition strategies. Using these strategies, they trigger price moves in specific directions. To spot the early signs of such tactics, you must:
- Study market behavior during times of high volatility and
- Understand how algos attempt to manipulate price movements.
Additionally, be aware that regulations surrounding algorithmic trading are constantly evolving. By staying updated on regulatory changes (such as new rules for market manipulation), you can understand what tactics are considered illegal and how to avoid them.
Conclusion
In today’s markets, you must understand as well as adapt to algorithmic trading patterns. Nowadays, algos drive a significant portion of market activity. This causes traders to face several unique challenges like market volatility, liquidity voids, and deceptive tactics such as spoofing, layering, and momentum ignition.
All these strategies leave behind distinct algo footprints. Traders can easily detect and analyze these footprints using our advanced market analysis tools like Bookmap. It has several features, such as the heatmap, DOM Pro, Stops & Icebergs Add-Ons, and CVD.
By using them, you get real-time insights into order flow and hidden liquidity changes. These tools also reveal algorithmic behaviors and help you avoid falling victim to market manipulation. Moreover, you can run simulations and study historical data on Bookmap. Bookmap gives you the insights needed to navigate volatile markets like a pro.
Sign Up Now