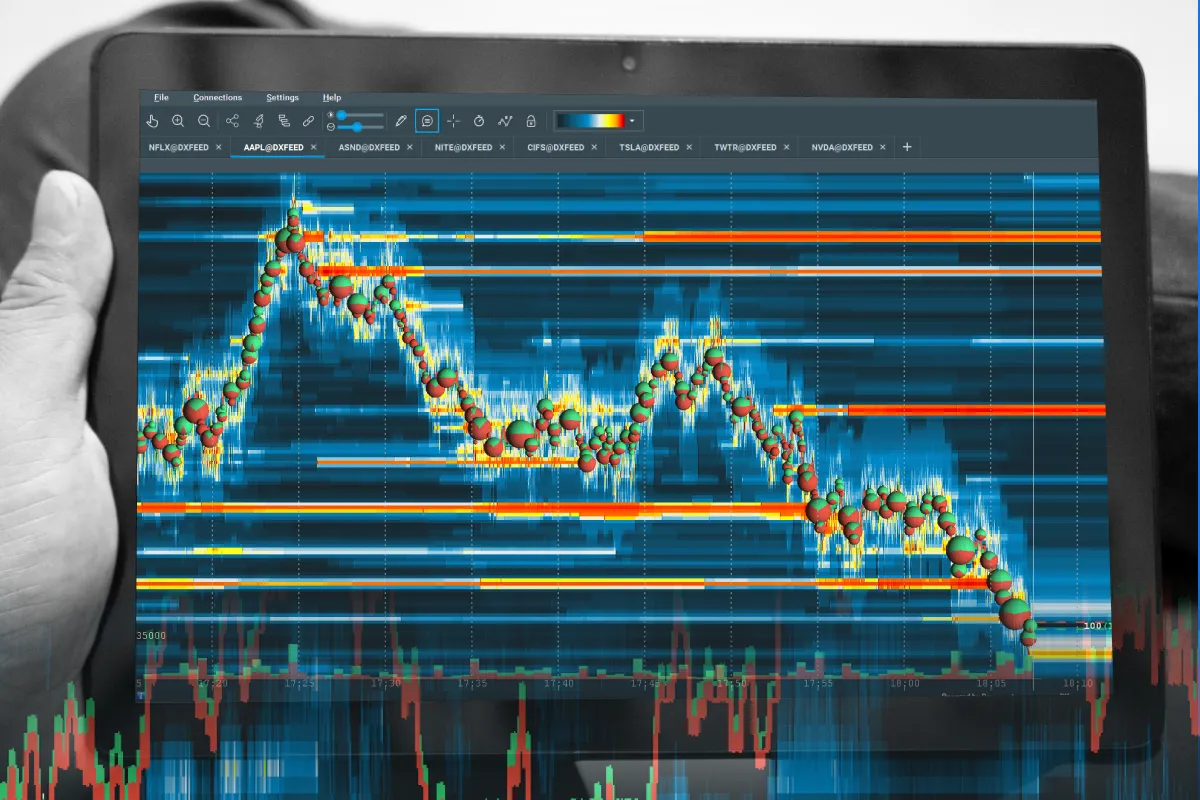
See order book more clearly in real time.
Compare plans to access deeper market visibility for order book.
Education
August 9, 2024
SHARE
The Importance of Order Book Depth in Day Trading
Don’t you always crave enhanced precision and valuable insights to elevate your trading? Certainly, the order book can help you! Being an accurate measure of market liquidity and prevailing sentiment, it can make you a better and more informed trader.
This article focuses on the essential aspects of order book depth and its importance in day trading. You will understand how to interpret order book data, including key elements such as bid and ask prices, order sizes, and order flow.
We will also explore practical strategies for effectively leveraging order book depth. We will shed light on scalping, momentum trading, and reversal strategies, illustrating each one with real-world examples. Moreover, we will examine sophisticated techniques for smartly analyzing order book data utilizing tools such as heatmaps and advanced order flow analytics.
Lastly, we will introduce you to some risk management practices and demonstrate how traders can set more accurate stop-loss and take-profit levels based on areas of high liquidity. Let’s begin.
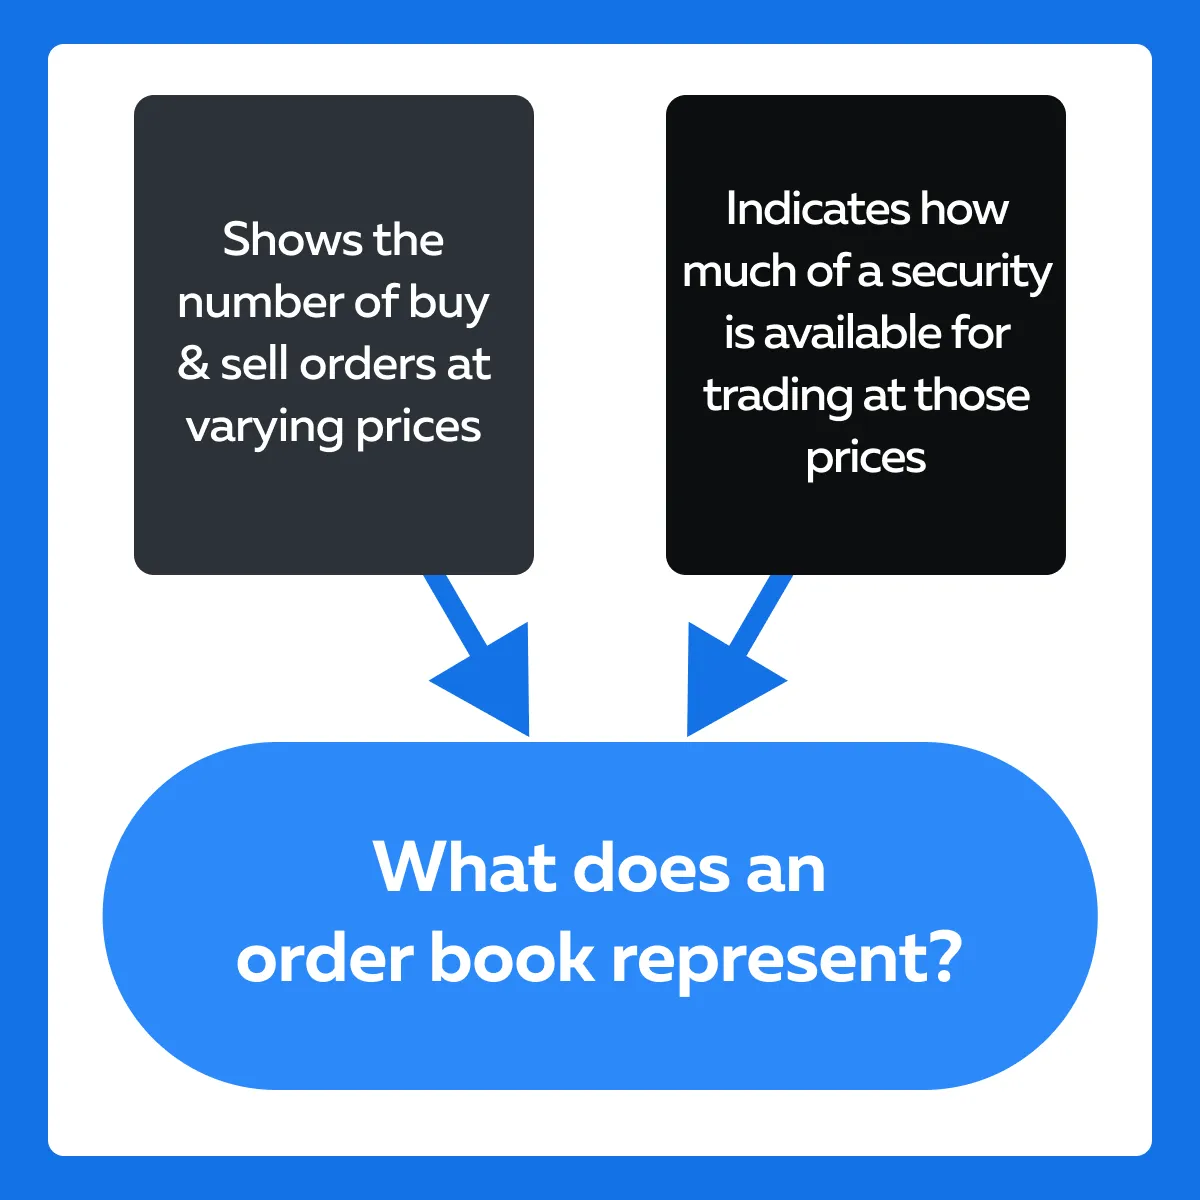
What is Order Book Depth & Why Does it Matter?
Order book depth refers to the measure of liquidity available at different price levels in the order book of a financial market.
Several traders and investors analyze the order book to gauge market sentiment and predict potential price movements. Let’s see how:
- Market Sentiment
- A deep order book with many orders at various price levels suggests:
- Strong market interest,
- Heightened market participation, and
- Elevated investor confidence.
- Conversely, a shallow order book indicates uncertainty or lack of interest in the market.
- A deep order book with many orders at various price levels suggests:
- Potential Price Movements
- Usually, order book depth signals potential price movements.
- For example,
- A large concentration of buy orders at a particular price level acts as a support.
- This support prevents the price from falling below that level.
- In contrast, an accumulation of sell orders at a certain price level creates resistance.
- This resistance makes it difficult for the price to rise above that level.
- Liquidity
- High liquidity is often indicated by a deep order book.
- It ensures that large orders can be executed without significantly impacting the price.
- This reduces slippage and contributes to better price stability.
For better clarity, let’s study an example showing an order book depth in action:
Assume the order book for a stock, XYZ looks like this:
| Price (USD) | Buy orders | Sell orders |
| 101 | 500 | 200 |
| 100 | 1000 | 300 |
| 99 | 2000 | 400 |
| 98 | 1500 | 600 |
| 97 | 800 | 1000 |
In this example, we can observe that the order book for XYZ stock is “deep,” especially around the $99 and $100 price levels, which show a significant number of buy orders. The large number of buy orders at $99 and $100 indicates strong interest and potential support at these levels. If the price of XYZ stock falls to $100,
- It is likely to find support,
and
- It may not decline significantly due to the substantial demand.
Now, on observing the sell side, we notice prominent sell orders at $97 and $98, creating resistance at these levels.
Furthermore, the strong buy-side interest at higher price levels ($99 and $100) suggests positive market sentiment. That’s because many investors are willing to buy XYZ stock close to the current market price. If a trader wants to sell a large quantity of XYZ stock, they can do so without significantly affecting the price, thanks to the deep buy-side liquidity.
How to Interpret Order Book Data?
The process of interpreting order book data involves analyzing:
- Bid and ask prices,
- Order sizes, and
- Order flow.
Such an analysis helps to gauge market sentiment and potential price movements. Also, upon recognizing imbalances in the order book, traders can get valuable insights for making informed trading decisions. Let’s understand some key elements of the order book that can help you while making an analysis:
- Bid and Ask Prices:
- Bid Price: It’s the highest price a buyer is willing to pay for a security. The bid price reflects the demand side of the market.
- Ask Price: Conversely, it’s the minimum price a seller is willing to accept for a security. The ask price represents the supply side of the market.
- The difference between the bid and ask prices is called the spread.
- Order Sizes:
- This indicates the number of shares or contracts available at each bid and ask price.
- Larger order sizes at certain price levels indicate significant interest or resistance.
- Order Flow
- This is the flow of buy and sell orders populating the order book.
- Order flow monitoring can provide insights into market momentum and potential price movements.
Now, let’s understand the practical application of an order book with a scenario that demonstrates how a trader might gauge buying interest using the order book:
Say a trader is analyzing the order book for a stock, ABC, with the following data:
| Price (USD) | Buy orders | Sell orders |
| 51 | 1000 | 500 |
| 50 | 1500 | 200 |
| 49 | 2000 | 100 |
| 48 | 500 | 50 |
| 47 | 300 | 25 |
In this scenario, the trader observes significant buy orders at the $49 and $50 levels. This large concentration of buy orders indicates strong buying interest at these price levels. The trader may infer that there is substantial support at these prices, making it less likely for the stock price to fall below these levels in the near term.
How to Identify Order Book Imbalances?
Order book imbalances occur when there is a higher concentration of buy orders compared to sell orders, or vice versa. Mostly, these imbalances indicate potential price movements. For more details, refer to this Bookmap guide on Imbalance Indicators.
Now, let’s consider a scenario to illustrate how a trader might spot an order book imbalance:
Assume that a trader notices the following order book data for stock XYZ:
| Price (USD) | Buy orders | Sell orders |
| 101 | 1000 | 200 |
| 100 | 1500 | 300 |
| 99 | 2500 | 400 |
| 98 | 1000 | 600 |
| 97 | 500 | 1000 |
From the above order book:
- The trader observes a significant imbalance with a higher concentration of buy orders at the $99 and $100 levels compared to sell orders.
- This imbalance suggests strong buying pressure and potential upward price movement.
Furthermore,
- The trader considers the substantial buy orders at $99 and $100 as strong support levels.
- The trader interprets the imbalance as a sign of potential upward price pressure.
- They anticipate that the significant buy-side interest might push the stock price higher as sellers are likely to raise their ask prices in response to the high demand.
Based on the observed imbalance, the trader decides to place a buy order slightly above the $100 level. They anticipate that the stock price will rise due to the strong buy-side interest.
3 Examples of Strategies Using Order Book Depth in Day Trading
Traders use several strategies to use order book depth effectively. Listed below are some popular strategies:
- Scalping,
- Momentum trading, and
- Spotting potential reversals.
Using these strategies, traders can better understand the market’s liquidity and order flow dynamics. Let’s study them in detail:
Strategy I: Scalping with Order Book Insights
Scalpers aim to make quick trades based on short-term price movements and liquidity. They often use order book depth to:
- Identify temporary liquidity gaps
and
- Execute swift trades to profit from small price changes.
For more clarity on this strategy, let’s read a hypothetical example:
Below is the order book for a particular stock:
| Price (USD) | Buy orders | Sell orders |
| 100.05 | 500 | 200 |
| 100.04 | 1000 | 100 |
| 100.03 | 1500 | 50 |
| 100.02 | 2000 | 25 |
| 100.01 | 2500 | 10 |
Upon observing the order book, the trader notices a temporary liquidity gap at the $100.03 level. At this level, the sell orders are significantly lower (only 50 shares) compared to the surrounding levels. Acting upon this, the trader places a buy order at $100.03 to quickly purchase the 50 shares available.
Immediately after this, the trader places a sell order at $100.05, where there is a larger number of buy orders (500 shares). The traders want to ensure that the purchased shares can be sold quickly at a slightly higher price. As a result, the trader profits from the small price difference (2 cents per share) by capitalizing on the temporary liquidity gap.
Strategy II: Momentum Trading
Day traders leverage order book depth to identify and capitalize on market momentum. By analyzing order flow data, they usually:
- Anticipate price movements,
and
- Enter trades to ride the momentum.
For a greater comprehension, let’s study a hypothetical example:
Below is the order book for a particular stock:
| Price (USD) | Buy orders | Sell orders |
| 50.05 | 5000 | 1000 |
| 50.04 | 4000 | 800 |
| 50.03 | 3000 | 600 |
| 50.02 | 2000 | 400 |
| 50.01 | 1000 | 200 |
Upon observing the above order book, a trader notices a surge in buy orders at the $50.02 to $50.05 levels. This surge is indicative of a strong upward momentum. Now, the trader:
- Predicts a breakout,
and
- Places a long position at $50.06, slightly above the highest concentration of buy orders.
As the buy orders continue to flood in, the price breaks out above $50.05. The trader rides this momentum and exits the position at a profit.
Strategy III: Reversal Strategies
Traders use order book depth to spot potential reversal points. Mostly, they do so by focusing on key support and resistance levels indicated by large orders. These levels often act as psychological barriers, where price movements are likely to reverse. For a greater comprehension, let’s study a hypothetical example:
Below is the order book for a particular stock:
| Price (USD) | Buy orders | Sell orders |
| 45 | 5000 | 500 |
| 44.95 | 4000 | 400 |
| 44.90 | 3000 | 300 |
| 44.85 | 2000 | 200 |
| 44.80 | 1000 | 100 |
Upon observing the above order book, a trader notices a strong support level at $45.00, where there are 5000 buy orders, significantly higher than the surrounding levels. During a market pullback, the price approaches $45.00. Now, considering this market situation, the trader places a long position at $45.01. They are anticipating that the price will bounce back due to the strong buy-side support.
Now,
- The price hits $45.00
- It finds support, and
- It begins to rise.
The trader exits the long position at a higher price by capitalizing on the reversal.
Techniques for Order Book Analysis
For effective analysis of the order book, most traders utilize:
- Heatmap visualizations,
and
- Advanced order flow analytics.
These techniques help traders better understand the behavior of significant market participants and key liquidity areas. Let’s study them in detail:
How to Analyze Heatmap Visualizations
Heatmap visualizations offer a graphical representation of order book depth. They show different colors, which indicate varying levels of liquidity. It is worth mentioning that in a heatmap,
- Darker colors represent higher concentrations of orders
whereas,
- Lighter colors indicate lower concentrations.
By analyzing heatmaps, traders can quickly identify significant areas of buy and sell orders. This identification makes it easier to spot potential support and resistance levels.
Let’s understand better through an example:
- A trader sees a heatmap for stock XYZ.
- They witness a large, dark red band at the $55 level on the sell side.
- This red band is indicative of a high concentration of sell orders.
- Now, the trader identifies the $55 level as a strong resistance point due to the large accumulation of sell orders.
- Subsequently, the trader decides to place a sell order just below this resistance level, at $54.95.
- They do so after anticipating that the price is likely to face selling pressure and reverse downward when it approaches $55.
- As the stock price moves toward $55, it
- Encounters resistance
and
- Begins to decline.
- The trader’s sell order gets executed, and they profit from the subsequent price drop.
How to Use Advanced Order Flow Analytics
For the unaware, order flow analytics involve tracking and analyzing the flow of buy and sell orders in real time. These tools help traders understand the behavior of major market participants, such as institutional investors. Most of these analytical tools highlight large orders and patterns in trading activity. Now, let’s see an example to understand their application better:
- Say a trader uses an advanced order flow analytics platform to monitor the order book for stock ABC.
- They observe a series of large buy orders consistently placed at higher price levels.
- After analysis, the trader spots strong buying interest from institutional investors.
- The trader notices that these large buy orders are:
- Elevating the stock price
and
- Creating a bullish trend.
- To align their trades with this trend, the trader decides to enter a long position.
- They place a buy order at $120.50, slightly above the current market price for assured execution.
- As institutional buying activity continues, the stock price rises.
- The trader benefits from the upward momentum.
- They ride the trend initiated by the large orders from institutional investors.
Risk Management with Order Book Depth

By analyzing order book depth, traders can set more accurate stop-loss and take-profit levels. This accuracy improves their risk management strategies and increases the likelihood of successful trades.
Let’s see how it happens through a hypothetical example of a situation involving misleading buyer control and liquidity on the sell side.
The market situation
- In the market, it appears that buyers are in control.
- There are numerous buy orders slightly above the current market price.
- Despite the apparent buyer control, a significant amount of liquidity is actually on the sell side.
- This situation indicates potential market resistance.
Now, let’s understand this better through the following order book that reflects this market situation:
| Price (USD) | Buy orders | Sell orders |
| 51.00 | 1000 | 5000 |
| 50.95 | 1500 | 4000 |
| 50.90 | 2000 | 3000 |
| 50.85 | 2500 | 2000 |
| 50.80 | 3000 | 1000 |
Misleading Perception:
- The order book shows numerous buy orders clustered just below the current market price.
- This concentration makes it appear that buyers are in control.
- However, the sell-side has significantly higher liquidity at slightly higher price levels.
- This situation indicates potential resistance.
Risk Management Information:
- A trader initially considers entering a buy trade, thinking the buyers are dominant.
- By examining the order book depth, the trader realizes that the high sell-side liquidity could lead to sellers taking control if the price approaches these resistance levels.
- As a risk management practice, the trader decides to wait and see if the buy-side orders are sufficient to overcome the sell-side liquidity before entering the trade.
How to Use Order Book Depth for Accurate Stop-Loss and Take-Profit Levels?
Traders can use areas of high liquidity in the order book to set more accurate:
- Stop-loss
and
- Take-profit levels
It must be noted that high liquidity areas often act as support or resistance levels. They provide logical points for setting these risk management parameters. Let’s check out an example showing how to set a stop-loss level:
Observe the order book below:
| Price (USD) | Buy orders | Sell orders |
| 49.50 | 5000 | 1000 |
| 49.45 | 4000 | 1500 |
| 49.40 | 3000 | 2000 |
| 49.35 | 2000 | 2500 |
| 49.30 | 1000 | 3000 |
Scenario
- The trader identifies a significant support area at $49.50.
- At this level, there is a large concentration of buy orders (5000).
- The trader enters a long position at $49.55.
- They anticipate the price will be supported by the high buy-side liquidity at $49.50.
Stop-Loss Setting
- To protect against sudden price drops, the trader sets a stop-loss level just below the significant support area at $49.45.
- This stop-loss level provides a buffer.
- The level of $49.45 allows for minor price fluctuations while protecting against a larger downward move if the support at $49.50 fails.
Outcome
- The price fluctuates slightly but remains above the $49.50 support level.
- The stop-loss at $49.45 provides a safety net.
- It ensures the trader exits the position with minimal loss if the support breaks.
How to Use Order Book Depth for Take-Profit Levels?
Just like above, the trader can identify significant sell-side liquidity to set take-profit levels. In continuation of the above example,
- If a large concentration of sell orders is observed at $50.00, the trader can set a take-profit order just below this resistance level, at $49.95.
- This placement will ensure the trade is closed before encountering significant selling pressure.
Conclusion
Order book depth provides a clear view of market liquidity. It helps traders identify key support and resistance levels. By analyzing the concentration of buy and sell orders, traders can anticipate price movements and set precise stop-loss and take-profit levels.
Some popular techniques, such as heatmap visualizations and advanced order flow analytics, further enhance a trader’s ability to spot market trends and potential reversals. Ultimately, by leveraging order book depth, you can better manage risk and increase your chances of success.
For more insights on order book depth, visit: Depth of Market (DOM) from Basics to Evolution.
Sign Up Now