Bookmap Knowledge Base

Bookmap Knowledge Base

  • User Guide
  • Add-ons
  • Java API

โ€บ5. Indicators

1. Introduction to Bookmap

  • Bookmap Knowledge Base
  • Bookmapยฎ Connectivity
  • Software Versions
  • Bookmap System Requirements

2. Getting Started

  • Register And Download Bookmap
  • Visit Bookmap Portal
  • Enter Your License Key
  • Select A Run Mode
  • Connect To A Broker Or A Data Provider
  • Install An Adapter
  • Connect To Own Data Source
  • Subscribe To An Instrument
  • Open The Main Window
  • Activate Bookmap Offline
  • Add-ons Manager

3. Setting Up & Operating Bookmap

  • Tabs
  • Heatmap. Main Chart
  • Columns

4. Trading

  • Trading with Bookmap
  • Order Types
  • Orders Management
  • Cross-Instrument Trading
  • Trading Configuration Panel
  • Trading from DOM
  • Cross Trading

5. Indicators

  • Display And Settings
  • Cumulative Volume Delta
  • Large Lot Tracker
  • Imbalance Indicators
  • Strength Level Indicator
  • Correlation Tracker
  • MBO Bundle Installation Guide

6. Multibook

  • Introduction to Multibook
  • Multibook Synthetic Instruments
  • Multibook vs Multibook Customizer
  • How to Install Multibook
  • Multibook FAQ

7. Strategies

  • Automated Strategies
  • Automated Strategies FAQ

8. Partnerships

  • Thinkorswim (TOS)
  • Coinbase Derivatives Exchange
  • Coinbase Derivatives - Nano Bitcoin

9. Bookmap Wiki

  • Iceberg Orders Tracker
  • Market Mechanics

10. Help

  • Bookmap Basics FAQ
  • Bookmap Performance FAQ
  • Bookmap For Crypto FAQ
  • Bookmap Marketplace FAQ
  • MBO Bundle FAQ
  • Multibook FAQ
  • Glossary
  • Release Notes

11. Errors

  • General Errors And Crashes
  • Performance Issues
  • dxFeed Data And Backfill Data Issues
  • Rithmic Issues
  • Other Issues

12. Appendices

  • Appendix I. Keyboard Hotkeys
  • Appendix II. Custom Notes
  • Appendix III. Special Orders
  • Appendix IV. Orders Format
  • Appendix V. Colour Value Names

Imbalance Indicators

Imbalance Indicators Application

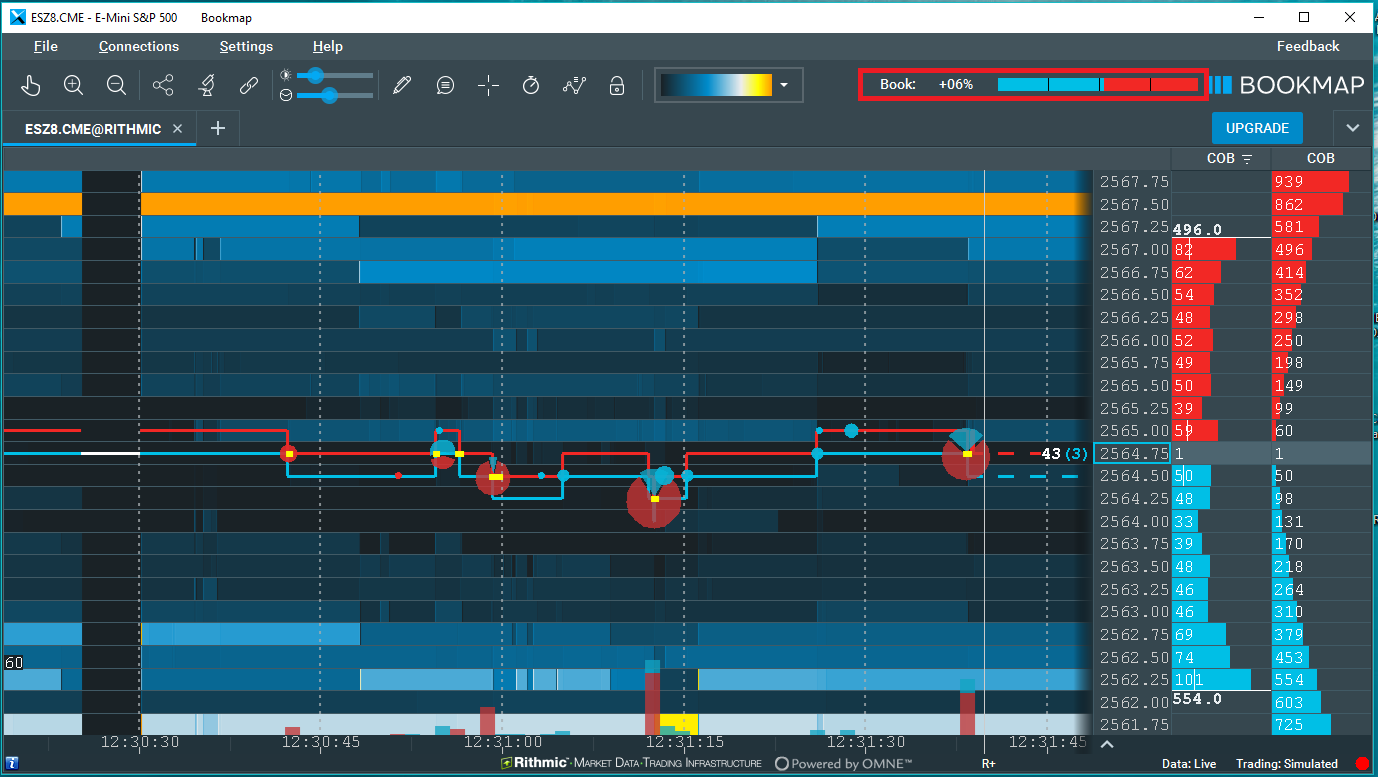
The Imbalance Indicators are located on the top right part of the chart. They display the Order Book Imbalance and the Volume Imbalance.

screenshot

Order Book imbalance represents the ratio between the average bid order book size versus the average ask order book size. The ratio is calculated as:

๐‘๐‘ข๐‘š๐‘๐‘’๐‘Ÿ ๐‘œ๐‘“ ๐‘Ž๐‘๐‘๐‘œ๐‘ข๐‘›๐‘กa๐‘๐‘™๐‘’ ๐‘๐‘ข๐‘ฆ ๐‘œ๐‘Ÿ๐‘‘๐‘’๐‘Ÿ๐‘  โˆ’ ๐‘๐‘ข๐‘š๐‘๐‘’๐‘Ÿ ๐‘œ๐‘“ ๐‘Ž๐‘๐‘๐‘œ๐‘ข๐‘›๐‘ก๐‘Ž๐‘๐‘™๐‘’ ๐‘ ๐‘’๐‘™๐‘™ ๐‘œ๐‘Ÿ๐‘‘๐‘’๐‘Ÿ๐‘ 


๐‘๐‘ข๐‘š๐‘๐‘’๐‘Ÿ ๐‘œ๐‘“ ๐‘Ž๐‘๐‘๐‘œ๐‘ข๐‘›๐‘กa๐‘๐‘™๐‘’ ๐‘๐‘ข๐‘ฆ ๐‘œ๐‘Ÿ๐‘‘๐‘’๐‘Ÿ๐‘  + ๐‘๐‘ข๐‘š๐‘๐‘’๐‘Ÿ ๐‘œ๐‘“ ๐‘Ž๐‘๐‘๐‘œ๐‘ข๐‘›๐‘ก๐‘Ž๐‘๐‘™๐‘’ ๐‘ ๐‘’๐‘™๐‘™ ๐‘œ๐‘Ÿ๐‘‘๐‘’๐‘Ÿ๐‘ 

Volume imbalance represents the ratio between the volume generated by buying aggressors (market order transactions on the offer) versus the volume generated by selling aggressors (market order transactions on the bid). The ratio is calculated as:

๐‘๐‘ข๐‘š๐‘๐‘’๐‘Ÿ ๐‘œ๐‘“ ๐‘Ž๐‘๐‘๐‘œ๐‘ข๐‘›๐‘กa๐‘๐‘™๐‘’ ๐‘๐‘ข๐‘ฆ ๐‘ฃ๐‘œ๐‘™๐‘ข๐‘š๐‘’ โˆ’ ๐‘๐‘ข๐‘š๐‘๐‘’๐‘Ÿ ๐‘œ๐‘“ ๐‘Ž๐‘๐‘๐‘œ๐‘ข๐‘›๐‘ก๐‘Ž๐‘๐‘™๐‘’ ๐‘ ๐‘’๐‘™๐‘™ ๐‘ฃ๐‘œ๐‘™๐‘ข๐‘š๐‘’


๐‘๐‘ข๐‘š๐‘๐‘’๐‘Ÿ ๐‘œ๐‘“ ๐‘Ž๐‘๐‘๐‘œ๐‘ข๐‘›๐‘กa๐‘๐‘™๐‘’ ๐‘๐‘ข๐‘ฆ ๐‘ฃ๐‘œ๐‘™๐‘ข๐‘š๐‘’ + ๐‘๐‘ข๐‘š๐‘๐‘’๐‘Ÿ ๐‘œ๐‘“ ๐‘Ž๐‘๐‘๐‘œ๐‘ข๐‘›๐‘ก๐‘Ž๐‘๐‘™๐‘’ ๐‘ ๐‘’๐‘™๐‘™ ๐‘ฃ๐‘œ๐‘™๐‘ข๐‘š๐‘’

The two imbalance indicators are calculated according to the current chart range. Any change to the chart range (either by dragging or by zooming in or out) will affect the readings of the imbalance indicators.

Imbalance Indicators Interpretation

Users can gauge the imbalance indicators to assess when the activity is heavily titled to a single direction based on the order book and order flow activity. This can help in assessing momentum moves or exhaustion points.

Imbalance Indicators Settings

The Imbalance Indicator Ratios are displayed on the top right side of the chart. Whenever an Imbalance Ratio is equal to or greater than 10%, the number will appear in the colour set for the buyers. If the Imbalance Ratio is equal or less than -10%, the number will appear in the colour set for the sellers.

See Colour Settings for details on changing the colour setup.

To enable the Imbalance Indicator Display, click the studies panel icon above the chart and check either of the two imbalance indicators.
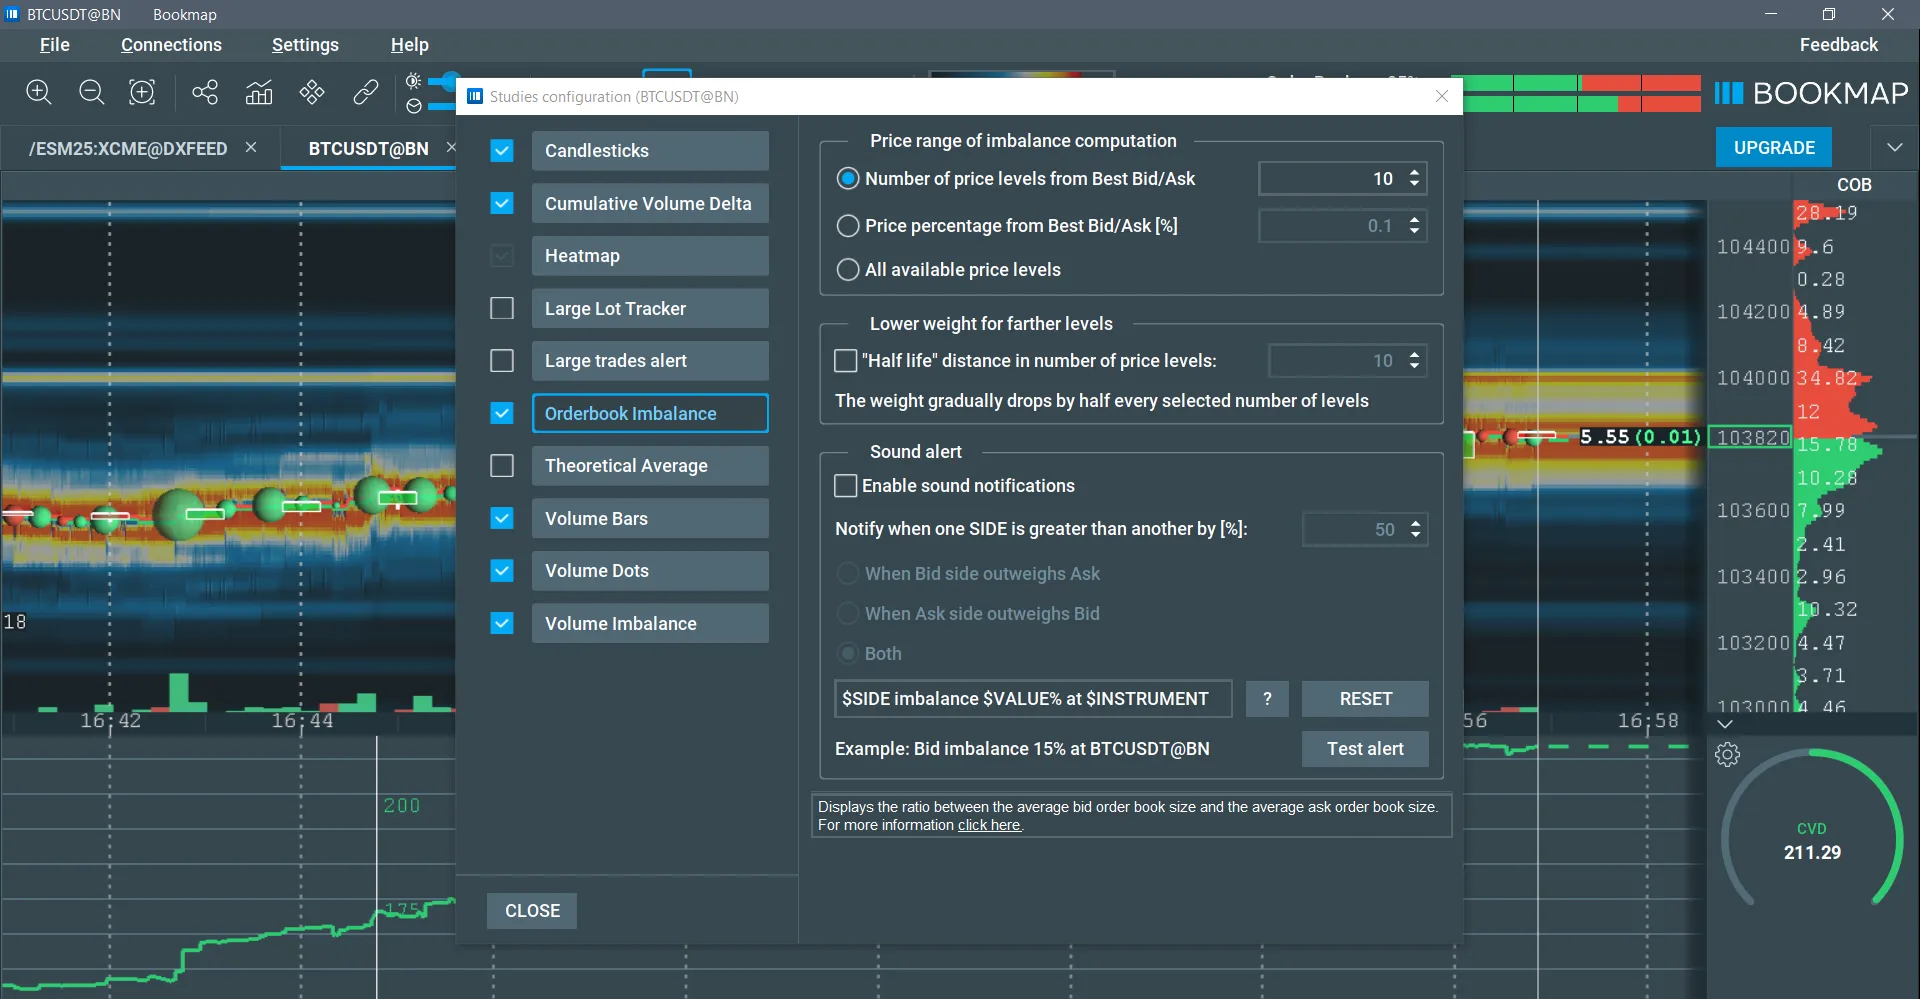
The studies panel also includes settings for the Order Book imbalance as illustrated below.

screenshot

Order Book Imbalance Settings

With Price range of imbalance computation you can set the number of price levels to use, whether as an absolute number or as a price percentage from the best bid and ask. You can also set it to include all available levels.

The Lower rate for farther levels allows you to set an exponential weight to the different price levels so that levels closer to the best bid and ask have more weight in the imbalance calculation. Just set the number of levels interval at which the weight assigned to the next interval of levels decreases by 50%.

Using a Sound Alert, you can set audible alert when imbalance reaches the percentage you configure.

Imbalance Indicators Limitations

The Imbalance Indicators are set to take into account the entire visible range of the chart. To change the time range taken into account when calculating the imbalance ratios, users must zoom in or out or drag the chart.

play

To know more about the imbalance indicators, watch this video.

โ† Large Lot TrackerStrength Level Indicator โ†’
  • Imbalance Indicators Application
  • Imbalance Indicators Interpretation
  • Imbalance Indicators Settings
  • Imbalance Indicators Limitations
Bookmap Knowledge Base
RESOURCES
Main PageForumBlog
Tutorials
Video TutorialsWebinar Recordings
Social
Bookmap Knowledge BaseBookmap Knowledge BaseBookmap Knowledge BaseBookmap Knowledge BaseBookmap Knowledge BaseBookmap Knowledge Base
Copyright ยฉ 2023 Bookmap Ltd