Stops & Icebergs Sub-Chart Indicator
What is the Stops & Icebergs Sub-chart Indicator add-on?
This add-on identifies and displays the executions of Stop Orders and the evolution of Iceberg Orders.
This add-on is designed to help traders quickly overview the market movements of Stop and Iceberg orders on the sub-chart, using greater data detection and analysis tools than a standard instrument. Its main features are:
- Accurate detection of:
- Iceberg orders execution
- Stop orders execution
- The true size of the aggressor order (e.g. "trade reconstruction"). This includes the entire size of partially executed limit orders. The limit price of such orders also becomes known.
- Ability to apply an order size filter to any of the above
- Instant computation and display of each update. Not once per minute or second, but exactly whenever it happens
- Ability to compute and display all results and data from the moment of your instrument subscription, not from the moment of enabling the add-on
- Ability to Process millions of market data events per second on a regular laptop. This allows Bookmap to re-compute the indicator instantly whenever the user changes the settings
![]()
Understanding Iceberg Orders
Iceberg orders are buy or sell limit orders that have been split into smaller limit orders to hide the total order quantity. The term "iceberg" comes from the fact that the visible lots are just the "tip of the iceberg", given the greater number of limit orders are not visible.
Background
Exchanges process orders in an atomic manner, which means strictly according to the order of their arrival on the exchange (unless it applies artificial speed bumps).
Orders that can't be immediately executed (e.g., due to their limit price) become resting (or working) orders and form the order book. A new order can be matched against one, more, or none of the resting orders. Because only the newly arrived (or newly replaced) order may initiate a trade, we call it the aggressor order, and its counterparties -- passive orders.
The order size filter
It is important to understand that the orders size filter refers to the order size, not the trade size. This is because traders are typically interested in tracking the larger orders, and because the actual order size of all participating orders can be larger than their traded size in some particular transactions. This happens when a Stop-Limit order is only partially executed, or when a limit order (especially an iceberg order) was already executed earlier.
To summarize, after the trade object is computed, it is used to update the two cumulative-volume-delta (CVD) lines on the chart as following:
| Stop orders CVD | Iceberg orders CVD | |
|---|---|---|
| Affected by | Aggressive orders where isStop is true | Passive orders where isIceberg is true |
| Value | The sum of tradeSize of passive orders list | Its own tradeSize field |
| Sign | Positive if isBuy is true | Positive if isBuy is false |
| Order size filter applies | orderSize of the aggressor order | totalTradedSize + remainedSize of Iceberg orders |
Accumulation mode
Each object represents the traded volume of its corresponding event. The sign of the resulting value is negative for Sell orders, and positive for Buy orders.
Unfortunately, it is simply impractical to attempt to digest every possible data event visually. Therefore, the indicator line represents some sort of accumulation of past events up until the current moment. For convenience, there are several accumulation methods, which are presented here:
| Accumulation type | The time parameter T means | Accounted time interval | Indicator's value |
|---|---|---|---|
| SUM | N/A | From data start | Regular sum |
| EXPONENTIAL | T - the decay rate (half-life) | From data start | Sum, gradually decaying by 50% every T |
| RESET (every T) | T - tells how frequently to reset, e.g. every 1 minute | From last reset point | Regular sum |
| SLIDING | T - the width of the sliding window | From T time ago | Regular sum |
| SAME_SIDE_SUM | N/A | Accumulates Buy volume until there is any Sell volume, and vice versa | Regular sum |
Voice and Text alerts
Types of alert triggers
Currently there are 2 types of triggers:
- A burst of Iceberg orders executions
- A burst of Stop orders executions
Both are triggered when the volume traded by corresponding orders is greater or equal to V within the time interval T, where V and T are configurable parameters.
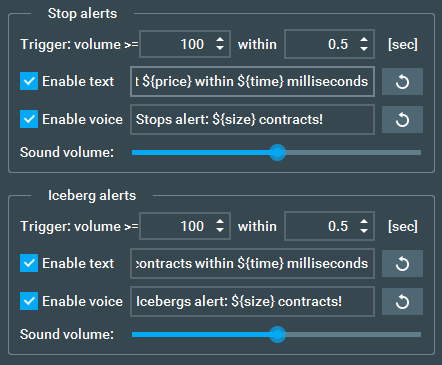
Methods of reporting the alerts
Currently, there are two methods to receive alerts: as text messages via the File->Alerts window, and as a voice alert synthesized from a text message.
The content (or format) of the message is configurable simply by editing the corresponding fields. Variable properties of the alert can be placed anywhere in the message by using keywords surrounded by ${}, for instance:
Stop orders traded ${size} contracts at ${price} within ${time} milliseconds
When an alert is triggered, actual values will be automatically inputted into these variable sections. The following keywords are supported:
${type}- the type of the trigger, e.g.Stop, orIceberg${symbol}- Full instrument's name such as ESU0${exchange}- the exchange, e.g. ES${sym}- 2 first letters of${symbol}${size}- the traded volume which triggered the alert${side}- eitherBuyorSell. Note that the if the event is triggered by Stop order(s) trading against Iceberg(s) orders, thesideof these orders is opposite to each other${time}- the time interval in milliseconds during which it occurred. If it's caused by a single aggressive order, thistimeis zero${price}- at which price the${size}is traded. If there are multiple prices, the${price}represents VWAP (volume weighted average price)${multi}- The system aggregates the alerts as long as the audio system is busy (e.g. pronouncing the previous alert). Then multiple alerts are aggregated and reported as a single alert. The${multi}keyword acts as a separator between the message used for a single alert and the message used for an aggregated alert. If this keyword is absent, the entire message is used regardless of whether the alert is aggregated or not.${N}- Represents the number of aggregated alerts (appears as1for a single alert)
Examples:
${type} ${side} alert at ${sym}: ${size} contracts${type} ${side} alert at ${symbol}.${exchange} (${sym}): ${size} contracts at ${price} within ${time} ms${multi}Miltiple (${N}) ${type} ${side} alerts at ${symbol}.${exchange} (${sym}): ${size} contracts at ${price} within ${time} ms${sym} ${type} alert: ${side} ${size} in ${time} millis${multi}${sym} ${type} multi alert: ${side} ${size} in ${time} millis by ${N} triggers${sym} ${type} alert: ${side} ${size}- a short alert for voice messages${sym} ${type} alert: ${side} ${size}${multi}Multi {sym} ${type} alert: ${side} ${size} by ${N} triggers- if you want to know which alerts consist of multiple alerts
For voice alerts it's recommended to use a very short and simple pattern. For example, ${sym} ${type} alert: ${side} ${size} will sound like ES Stop alert: Buy 50. This will reduce the time it takes the robot to pronounce it, helping you digest the information faster.
Alerts vs Indicator
The latest version of this add-on allows traders to align alerts with indicator values by selecting "Apply threshold on indicator..." checkbox.
If not selected, the two are not designed to be comparable. Here is a simple analogy: when a fire alarm is triggered, it doesn't tell you what the maximum temperature will be during the fire. For that it would need to either delay the alert (not acceptable) or to know the future (not possible).
Due to the above, the indicator's values may reach a higher magnitude. On the other hand, the indicator accumulates Buy and Sell volume with opposite signs, therefore in theory (because it rarely happens) a consequent Buy Stop of 500 and Sell Stop of 500 will not change the indicator, but will trigger two alerts.
Note: If the orders size filter is enabled, it's similarly used by the indicator and the alerts system.
Important Notes
Data Aggregation
The latest version of Bookmap includes some performance optimizations.
When the application is under heavy load and new events happen faster than Bookmap can process, an aggregation mechanism automatically turns on to help performance.
In this mode, Bookmap aggregates several individual events into one, improving performance at the cost of losing accuracy.
This allows Bookmap to operate faster, avoiding freezes and delays in data processing, but may affect indicators that rely on data microstructure accuracy. SI On-Chart and SI Sub-Chart are examples of those indicators.
When the automatic aggregation mechanism turns on, SI indicators may become unpredictable (lose detections, show fake detections, etc.)
Therefore, if you are using SI indicators and need accurate data, you can disable automatic aggregation to ensure you get reliable data.
But we do not recommend doing so, as Bookmap may not run smoothly during volatile market conditions. This means you’ll be unable to perform real-time actions like closing positions or moving orders, which most traders would consider more critical to trading.
To disable automatic aggregation go to Settings > Performance > Automatic aggregation and set Event queue size to Never.
Again, DO NOT DISABLE AUTOMATIC AGGREGATION if you need to perform real-time actions and execute trades, as significant drops in performance will hinder this.
If you’re not trading and you’re happy that Bookmap may occasionally slow down under heavy load, you can change the default parameters to increase the SI detection accuracy. Set the events queue slider to 20000 and delay to 5 seconds.

When the aggregation mechanism is enabled for the first time during a Bookmap session, the SI Sub-Chart add-on will display the following warning:

Note: With aggregation enabled, the SI Sub-Chart add-on is still operational, but it cannot get the required information from parts of the data which were aggregated, so some detections may be missing.
Missing MBO data
Sometimes the MBO data feed may disconnect, for example a bad internet connection or problem with the data provider. In this case, the add-on will warn you with the following notification:

The add-on will continue to work as usual as soon as the MBO connection is restored.
Note: CME does not provide MBO data for implied orders. Read more about implied orders here.
Stops & Icebergs Sub-Chart Indicator FAQ
Why do I see different Stops & Icebergs values between different PCs?
This could be due to one of the following reasons:
-
Data Aggregation - It may be the performance optimization feature causing the variation. It allows Bookmap to operate faster, avoiding freezes and delays in data processing, but may affect indicators that rely on data microstructure accuracy. SI On-Chart and SI Sub-Chart are examples of those indicators. Read more here. Aggregation can be applied differently on different PCs, so detection will be different too.
-
Resets - There is always some difference between event timestamps on different PCs, typically by +/- 20ms. It's enough to have different detections - on one PC a reset may be applied before a reset on another.
-
Different Stops & Icebergs add-on versions - We improved the SI On-Chart and SI Sub-Chart multiple times, and improved the detections accuracy and the add-on performance. The detections may be different because one computer has a newer version than another.
Why do I see different values between the SI On-Chart and SI Sub-Chart Indicator add-ons?
First, make sure you are using the latest versions of the SI On-Chart and SI Sub-Chart Indicator add-ons.
It is important to note that the volume calculation logic differs between the Sub-Chart and On-Chart Icebergs Indicators. For a more reliable comparison, please ensure you configure indicators in the same way:
- Disable filtering for SI Sub-Chart and set the ‘Accumulate as’ parameter to SUM.

- Set the threshold for SI On-Chart to 0, and select individual icebergs events only.


- Once this is done, you can zoom in and compare the volumes. Note that the engine works differently, and the SI Sub-Chart does not include some detection events.

Why don't I see any icebergs on a specific instrument on CME?
Unfortunately, CME does not allow using native iceberg orders on some instruments.
Here is a list of known CME instruments without icebergs:


Installation
To install the Stops & Icebergs Sub-Chart indicator, simply get Bookmap 7.4 and install it from the Add-ons Manager.
This add-on takes advantage of the new Add-ons Manager feature, which simplifies both the installation and updating process. If you'd like to learn more about the Add-ons Manager and how it can benefit your experience, please visit the following page.