Liquidity Marker
What Is the Liquidity Marker Add-on?
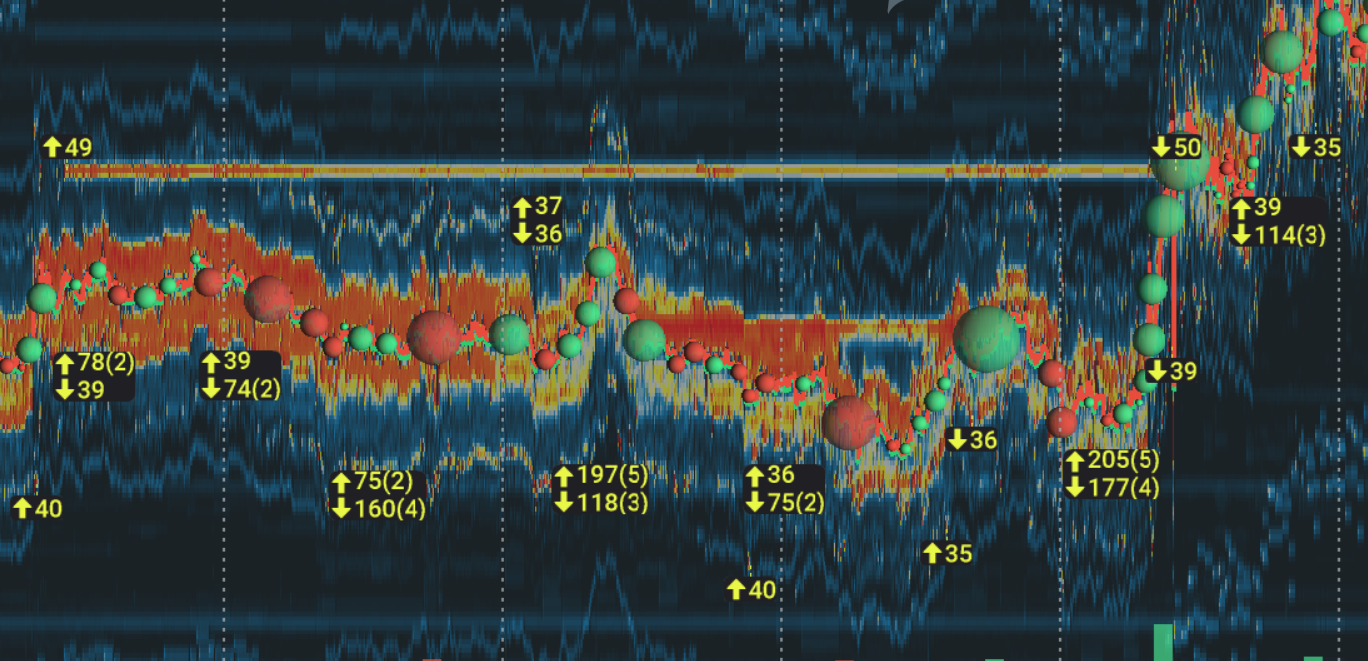
The Liquidity Marker shows you where significant changes in liquidity have occurred. This add-on also allows you to see larger player activity, and indicates the precise moment that limit orders were added, pulled, or moved, all while showing you the amount of liquidity involved.
How It Works
The Liquidity Marker works in 2 modes:
- Liquidity Markers: This adds markers that show price levels on the heatmap where the liquidity has significantly changed (by a configurable amount) within a 5-second period. You can adjust the sensitivity of the marker by changing the threshold setting in the configuration panel.
- Max Liquidity Levels: This shows where the largest liquidity is positioned. You can filter out low liquidity, and select the number of markers you wish to be displayed on the chart.
Marker Aggregation
Setting a relatively low threshold during volatile market conditions could result in many markers being displayed on the screen at once, creating a cluttered and confusing heatmap.
To avoid this situation, overlapping markers are automatically aggregated, cleaning up the heatmap and making the information easier to digest.
Aggregated markers display both the total liquidity and the number of aggregated markers. For example, “112/3” indicates that the liquidity changed by 112 and that there were 3 individual changes that were aggregated into one marker.
By zooming in you will see the aggregated marker separate into individual markers, allowing you to always view the details by enlarging the chart.
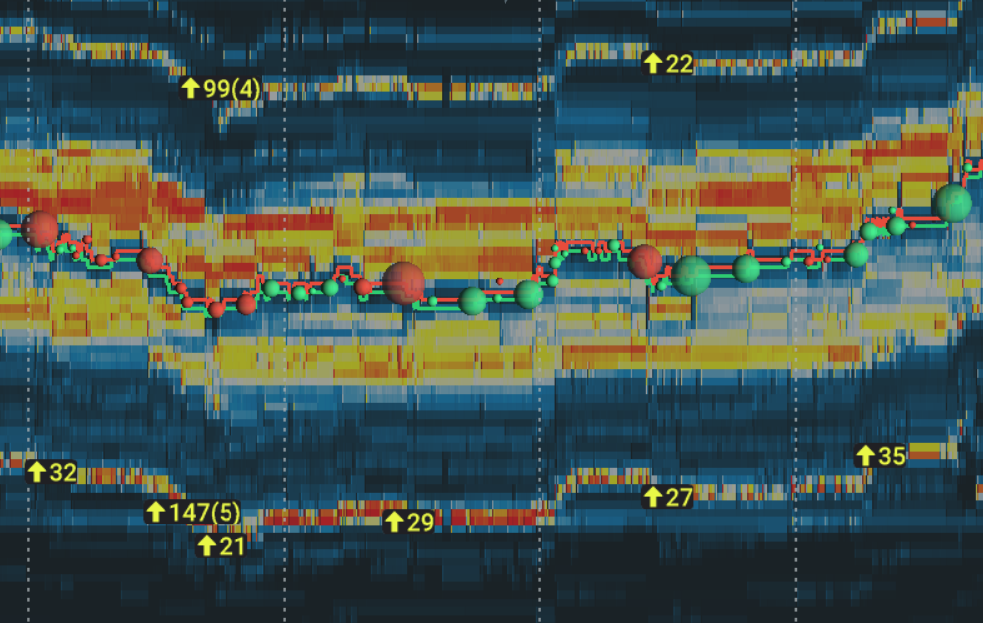
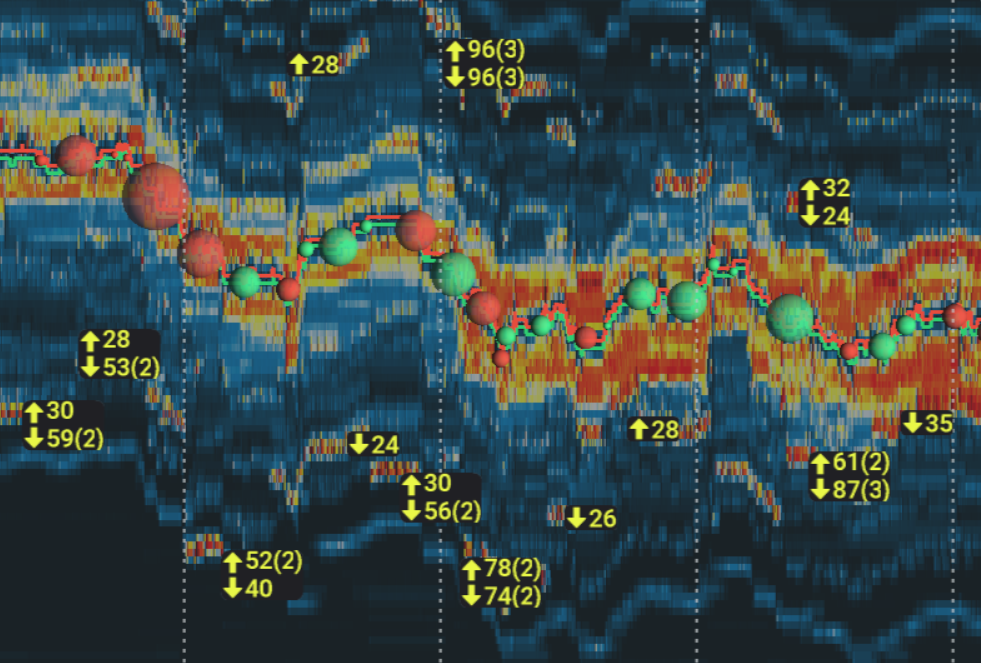
If both increasing and decreasing liquidity are enabled, and markers of different types overlap, they will be aggregated into a marker with combined information about increasing and decreasing liquidity. This marker will have a separate line for both the aggregated increasing liquidity and the aggregated decreasing liquidity, as shown below.
Video Walkthrough - How to use the Liquidity Marker
How to Configure the Liquidity Marker
Designed to give traders as much flexibility as possible, the Liquidity Marker is configurable for each instrument separately, allowing you to customize each instrument to your needs.
Choose Your Mode
At the top of the settings panel you can switch between liquidity modes.

-
Liquidity Markers: This shows price levels on the heatmap where the liquidity has significantly changed (by a configurable amount) within a 5-second period.
-
Max Liquidity Levels: This shows on the heatmap where the largest liquidity is positioned.
Liquidity Markers Mode
Display Threshold
The display threshold allows you to set the minimum liquidity change required, within a 5-second period, to display a marker.

For example, setting the display threshold to 40 means that in order to display a marker, the liquidity must change by more than 40 units of any given measurement, at the same price level, within 5 seconds.
The 'Auto calculate' button automatically calculates the threshold based on your 'Number of markers to display' settings, along with the active heatmap timeline. If the active heatmap timeline is too small for the calculation, markers will be calculated for up to the last 30 minutes.
We recommend experimenting with the threshold until you find the best settings to match your needs. Variables such as market conditions, instrument type, and zoom level can all effect which threshold setting you should use.
Number of Markers to Display
Traders can use this setting to restrict the maximum number of markers displayed on the chart, ensuring that your chart never becomes too cluttered, even during volatile markets.
For example, if set to 20, only the 20 biggest liquidity changes will be shown, and any smaller liquidity changes that would have otherwise been shown will be instead hidden from your chart.
Note: when dragging or zooming in/out of your chart, the liquidity aggregation calculation can change as aggregated liquidity markers separate. This could result in different liquidity markers being displayed, with previously smaller markers aggregated into a large marker being separated and consequentially hidden.
Filter Markers Near BBO
This setting allows you to filter out and hide all the markers close to the BBO (Best Bid and Offer). It can be useful in reducing clutter on the chart caused by HFT activity.
Traders can set how many levels from the BBO markers are filtered out at, allowing you to declutter your heatmap only as much as you need to.
Show Increasing/Decreasing Spikes
This setting allows you to display only increasing liquidity changes, only decreasing liquidity changes, or both increasing and decreasing liquidity changes.

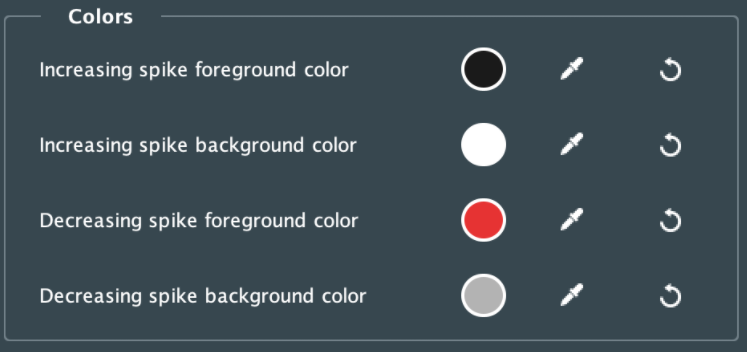
Colors
You can choose the marker color for each liquidity change type, both in the foreground and background. This can be done by choosing either a preset color option, or by using the color picker .
Max Liquidity Levels Mode
Display Threshold
Markers will be shown on the chart only if they are above or equal to the value that is set by you. If there are no levels with higher liquidity than the threshold amount, then no markers will be shown.
Number of Levels to Display
This setting indicates how many levels of markers will be displayed. Only levels with the largest liquidity will be highlighted.
Colors
You can set the foreground/background color of the maximum liquidity levels, either by choosing a preset color option, or by using the color picker.
Liquidity Marker FAQ
Why do I not see any icons on the screen?
There are several solutions that could fix this issue. First, make sure you’re using depth data (the liquidity marker add-on won’t work with L1 data).
If this doesn’t work, you should check your configuration. You may need to:
- Decrease the threshold
- Adjust the maximum number of markers
- Decrease the number of levels near the BBO
- Enable the checkboxes to see the decreases and increases.
- Zoom out by time and price
If you still don't see any icons, please contact support@bookmap.com.
Why do the icons change position and volume on chart drag/zoom?
This is most often caused by aggregation (which changes depending on zoom level) and the maximum number of markers restriction. If you want to see more markers, increase the 'Number of markers to display' setting.
Why do I see differences in size between the standard heatmap and the liquidity marker add-on?
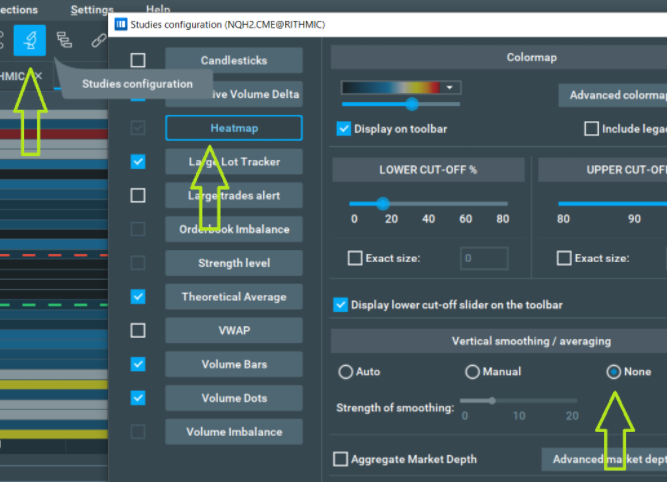
This can be because of the heatmap vertical smoothing/averaging. To compare the liquidity change events with the heatmap, disable the heatmap smoothing/averaging:
- Studies > Heatmap > set the vertical smoothing to 'None'.
Does the add-on work with an extended order book?
No, it does not support the extended order book. This option must be disabled for the add-on to work correctly.
What providers/instruments are supported?
All the providers/instruments with depth data (Orderbook, for example) are supported, and there are no restrictions based on instrument type. Please note that market data with a restricted number of depth levels may show false detections, as new levels may appear/disappear according to the data restriction.
What are the recommended settings for the 'Liquidity markers' mode?
The best settings for each trader will depend on personal preference. To have a cleaner, less cluttered chart, traders should increase their threshold to have fewer markers on the chart, Also causing remaining markers to have a larger liquidity delta.
Please note that this should be adjusted per each individual instrument. A similar effect can be achieved by decreasing the "Number of markers to display" for more clarity. More markers will be filtered out from the screen, and markers with a bigger liquidity change will remain.
We recommend experimenting with the display threshold until you achieve the desired results. Many factors such as market conditions, instrument type, and zoom level can all determine the threshold setting you use.
How to Install the Liquidity Marker
To install the Liquidity Marker, simply get Bookmap 7.6 and install it from the Add-ons Manager.
This add-on takes advantage of the new Add-ons Manager feature, which simplifies both the installation and updating process. If you'd like to learn more about the Add-ons Manager and how it can benefit your experience, please visit the following page.