Tradermap Pro
What is Tradermap Pro?
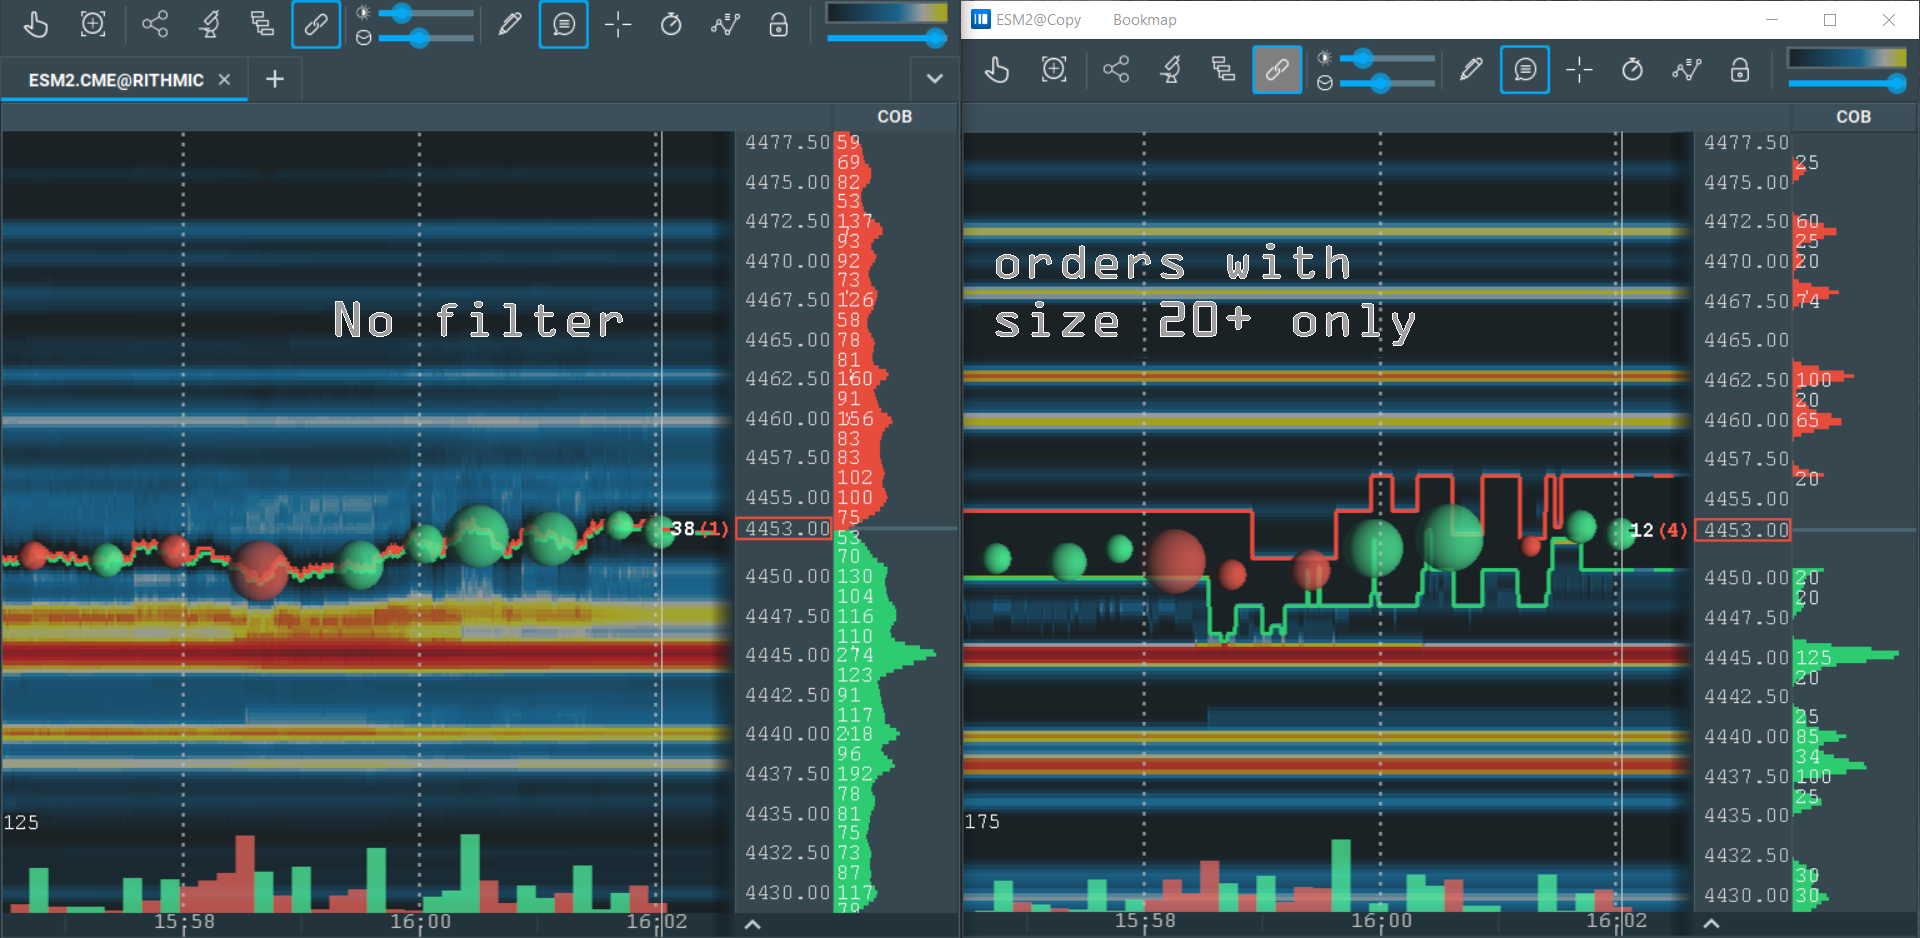
Tradermap Pro is an add-on that allows you to create special heatmaps for subscribed instruments with various MBO filters for the order book applied to them.
Watch The Walkthrough
Configuration
Creating a Tradermap Pro chart.
To create a Tradermap Pro chart, open the original instrument tab for the instrument you want to be used as a data source, and then open the Tradermap Pro add-on configuration panel. Simply click the “Create” button, to begin configuring your new heatmap. This works very similarly to the Instrument Copy add-on.
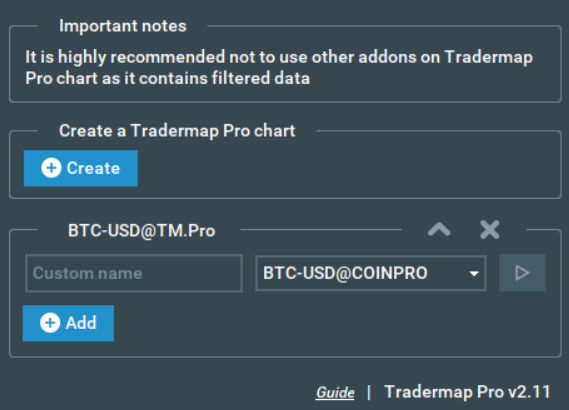
At the bottom of this panel, you’ll see the filters configuration section. At least one filter must be added to create a Tradermap Pro chart, as this is what creates the unique heatmap.
The add-on will automatically add a “@TM.Pro” ending to the instrument name, helping you to distinguish it from the original instrument.
Tradermap Pro allows you to create multiple specialized charts of the same instrument using different filters/filter combinations, however each Tradermap Pro chart must have a unique name to identify it.
It is important to note that you cannot create a Tradermap Pro chart from another Tradermap Pro chart, meaning you must select a normal Bookmap chart as your template.
To add a filter to an instrument in a Tradermap Pro chart simply open its tab, go to the Tradermap Pro configuration panel, click the "Add" button, and then pick one of the filters or data transformators from the drop-down list:
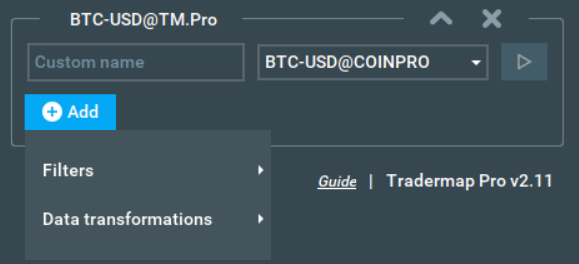
Remember, you can add multiple filters to the same Tradermap Pro chart, allowing you to fully customize your heatmaps and have charts that are as focused or as broad as you require.
Remove/unsubscribe a Tradermap Pro chart
Each Tradermap Pro Chart is created as a copy from an original instrument. To unsubscribe from this Tradermap Pro chart copy, just close its tab or click on the “stop” button.

After unsubscribing from a Tradermap Pro chart, the configuration panel of said Tradermap Pro chart will remain open, and you can apply the same filters (or change them) without changing the name.
To remove the settings panel for a Tradermap Pro chart, just click the “X” button above the settings panel.

Keep in mind that when you delete a Tradermap Pro chart settings panel, the actual filter settings you have applied in that panel will also be deleted.
Change chart names on the fly
You can change the name of the chart copy at anytime after it is created.

To change the name of a chart copy must be inactive (i.e. not subscribed to).

Note: The chart copy’s name must be unique and not empty.
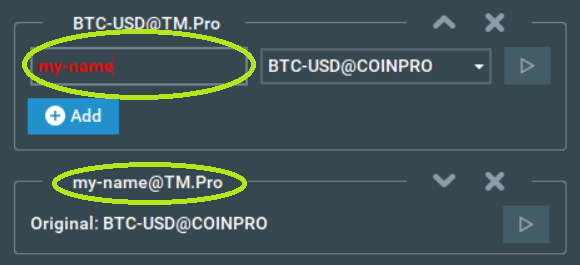
Change parent instrument
After creating a Tradermap chart copy, you can change its parent instrument to any active original instrument without issue.
For example, you have created a copy and realized that its parent tool has no MBO data.

However, this is not a problem, as you can change the parent instrument to one with MBO data, ensuring you have a working heatmap.

Data filters
Bot remover
The Bot Remover filter helps you exclude market maker bots (algos) from your data. These bots usually don't execute orders and stay at a set distance from the price, creating 'noise' that disrupts chart analysis.
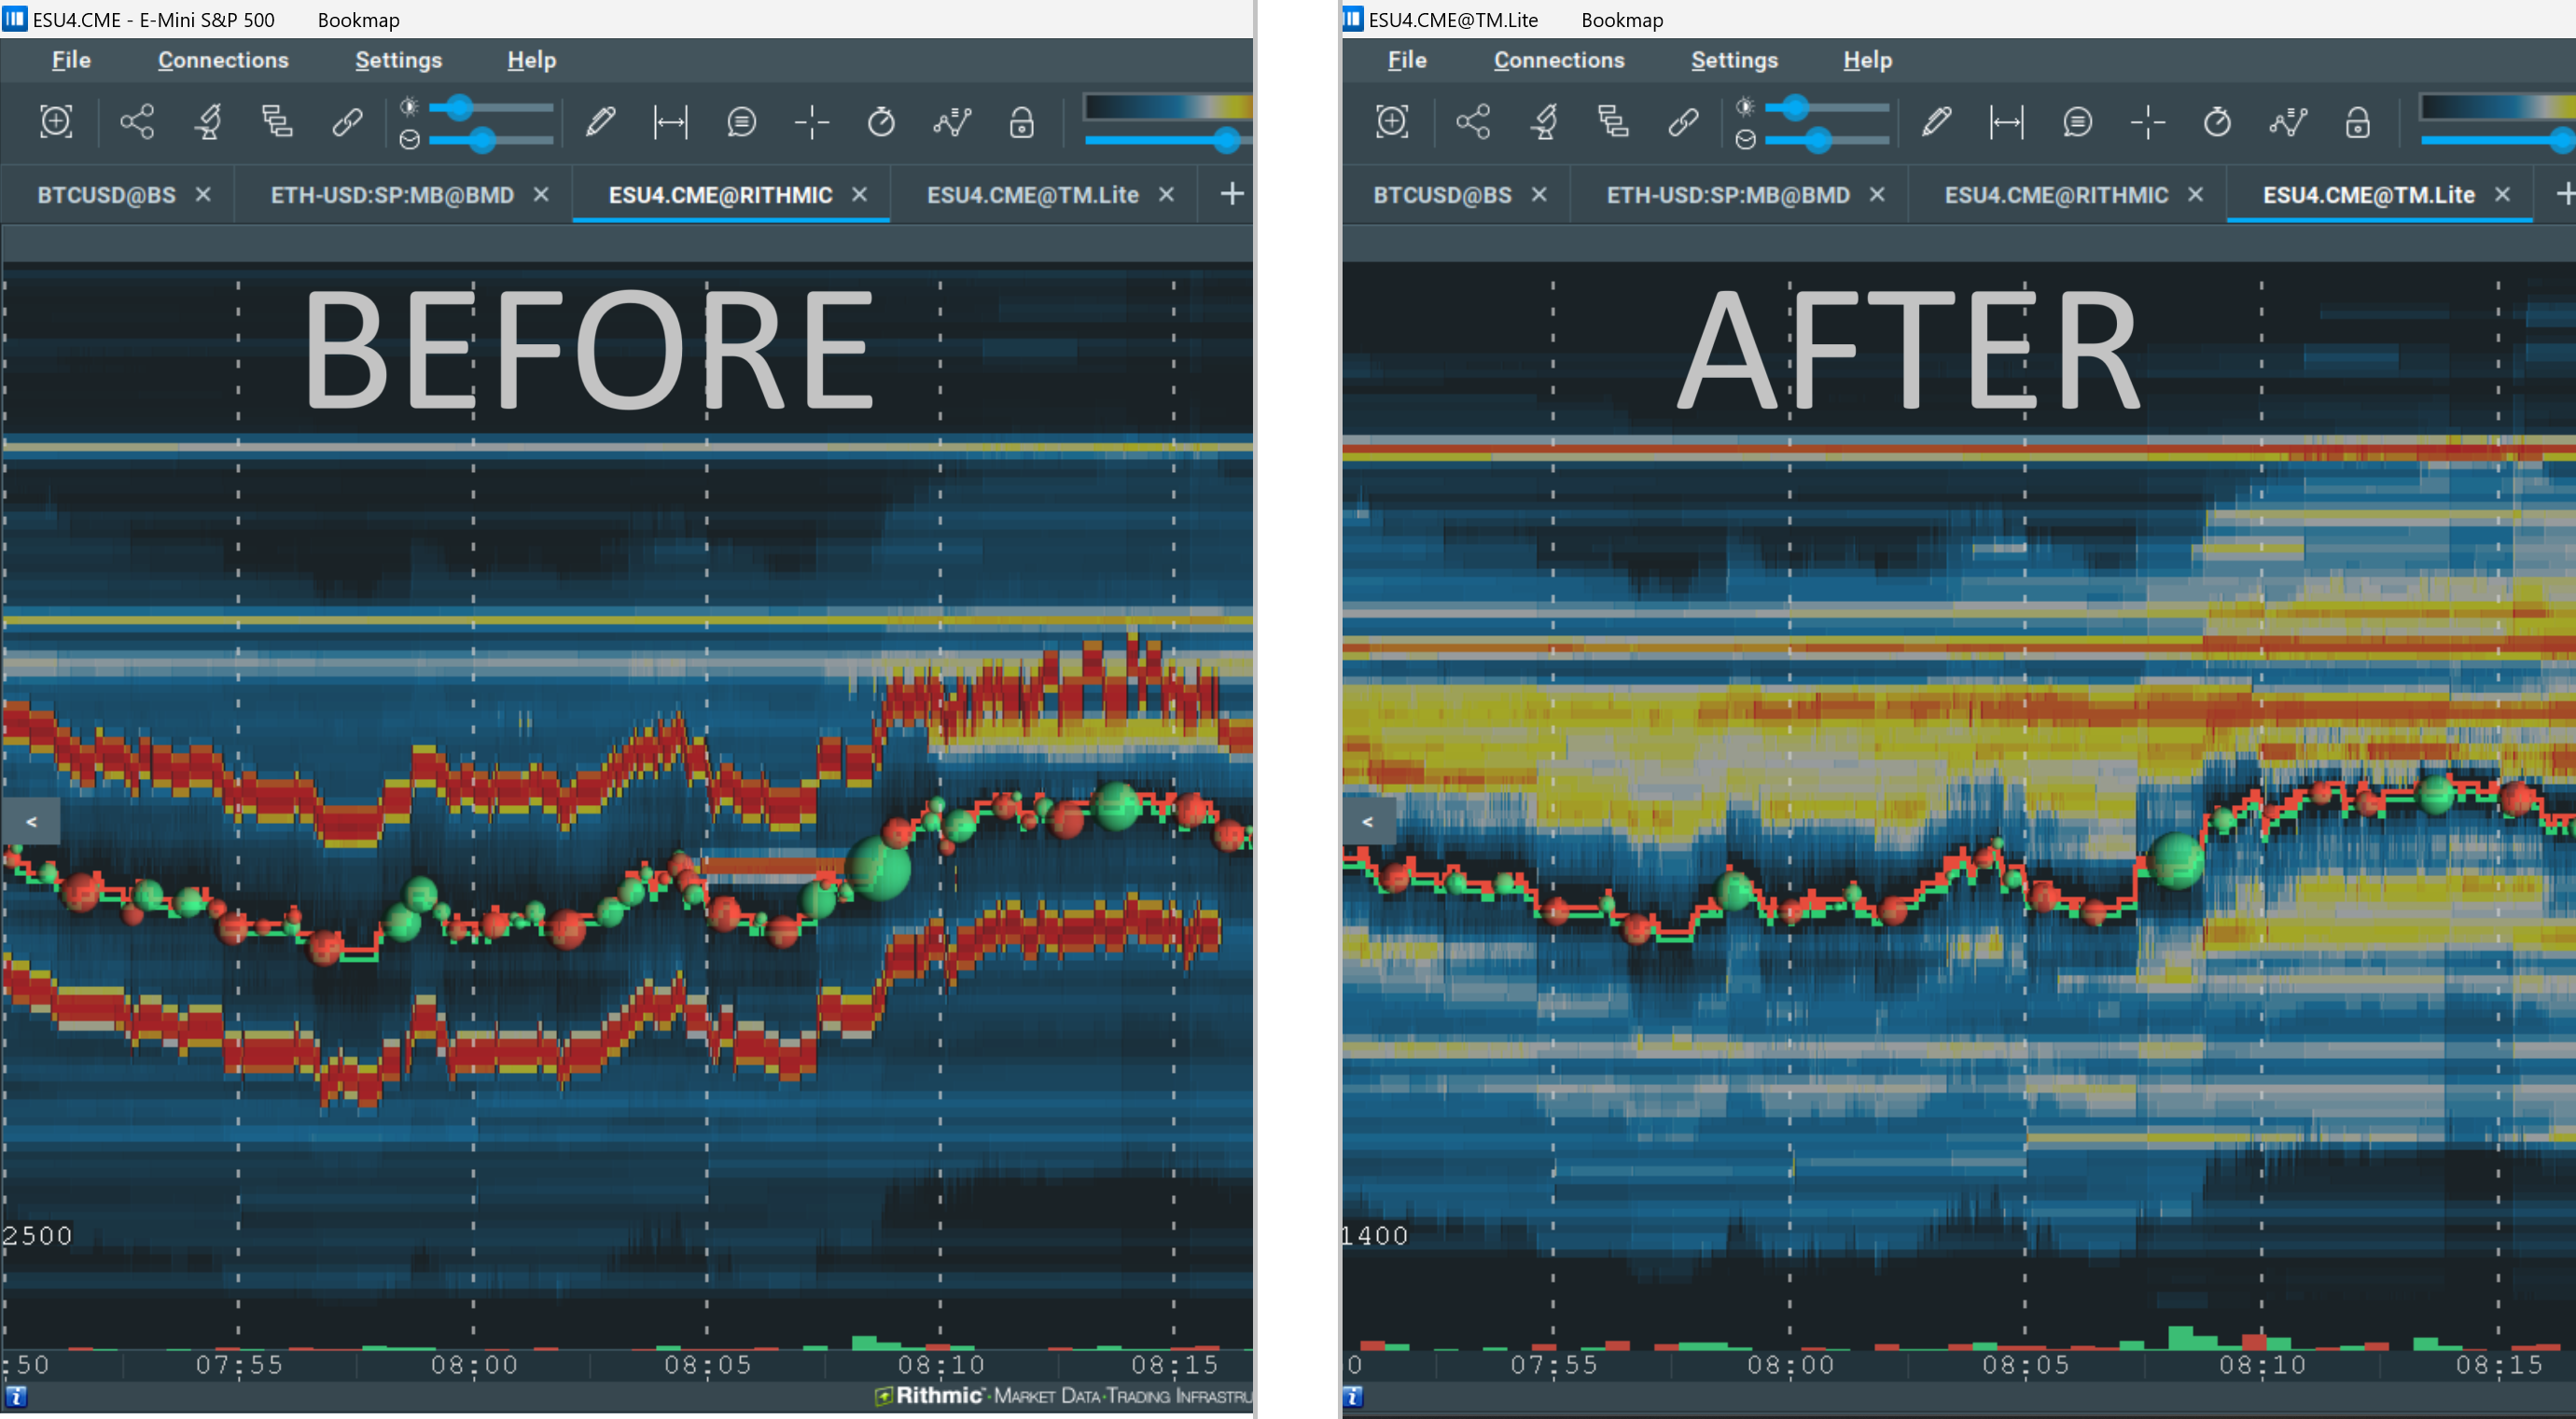
Increasing the filter sensitivity will remove more of these bot orders.

We have pre-selected sensitivity levels specifically for ES, NQ, MES, and MNQ Futures.
Standard sensitivity
Filters out most bots. While effective against the majority of bots, some specific bots may still appear on certain instruments.
High sensitivity:
Maximizes bot filtering. Removes nearly all bots across all instruments. Be aware that this setting might also exclude some common orders. Use it with caution to avoid unintended order exclusions.
Low sensitivity:
Minimal interference with regular orders. This filter has little to no impact on normal orders but may filter out many (though not all) bots, providing a balanced approach between order visibility and bot exclusion.
Order size filter
The Order size filter allows you to filter orders by their size, meaning you can focus on the market activity of a specific range/selection of order sizes. This filter only works with Order-by-Order data (e.g. CME/Rithmic MBO).
As this is an order size filter, this filter only displays orders.
Example: “Keep orders from 5 to 10” means that all the orders with sizes 1-4 and 11,12+ will be filtered out from the chart, with only orders with sizes 5 to 10 displayed.

Order size filter %
The Order size filter % it is simplified version of Order size filter. With this filter, you can choose a specific percentage of the largest orders you want to see displayed on the chart.

Tradermap Pro then analyzes the orders and calculate the threshold immediately, based on the percentage you selected. It will then show the orders that exceed this threshold, providing you with a clear visualization of the most significant orders.
When analyzing orders at price levels close to zero, there can be many large orders (spikes) that may affect the threshold calculation. Depending on your preference, our program can either include or exclude these outlying orders in the threshold calculation, allowing you to tailor the visualization to your needs.
Overall, the Order size filter % is a valuable tool that enables you to identify the most significant orders in the market, providing you with crucial information for making accurate trading decisions.
Order change filter
The Order change filter allows you to customize your view of the market by showing only specific types of orders based on changes in price and/or size. This filter allows you to focus on only the most relevant information and gain more detailed insights into market trends.

You can also choose to ignore or not process order changes resulting from trades. By selecting this option, the filter will only track changes in orders that were not initiated by a trade, such as changes made by you manually, or by the system. This allows you to isolate the changes that are not driven by market activity, providing a clearer view of the order book and the market's movements.
Here are the options available with this filter:
- "Show only orders that have changed in price" - Displays only the orders that have had a change in price, whether that change is an increase or a decrease.
- "Show only orders that have changed in size" - Displays only the orders that have had a change in size, whether that change is an increase or a decrease.
- "Show only orders that have changed in price or size" - Displays only the orders that have had a change in price or size.
- "Show only orders that have not changed in price" - Displays only the orders that have remained at the same price.
- "Show only orders that have not changed in size" - Displays only the orders that have remained at the same size.
- "Show only orders that have not changed in price or size" - Displays only the orders that have remained completely unchanged.
By using these options, you can quickly identify the most relevant orders and gain a better understanding of the market's movements, utilising the filters to quickly identify specific patterns and staying ahead of the market.The ability to ignore or not process order changes resulting from trades further enhances the filter's utility in providing a clearer view of the market.
Order ID filter
Pattern mode
The Order ID filter will filter orders based on their unique ID, allowing you to focus on or cut out particular order.

You can also choose whether or not to filter orders based on if they correspond to a selected pattern on the chart.
You can enter a pattern that the order or trade ID should follow, such as:
- Contains
- Starting with
- Ending with
- Regular expression (Guide)
Broker ID mode
Broker ID mode allows you to select one or multiple brokers from a list and display a chart with only the orders or/and trades placed by these brokers.
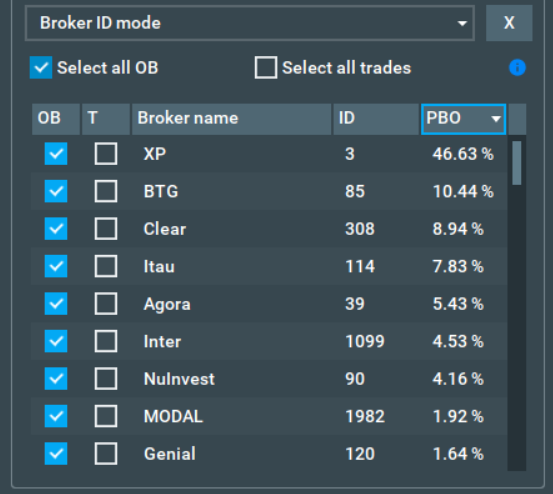
Broker ID mode only works for the Cedro platform.
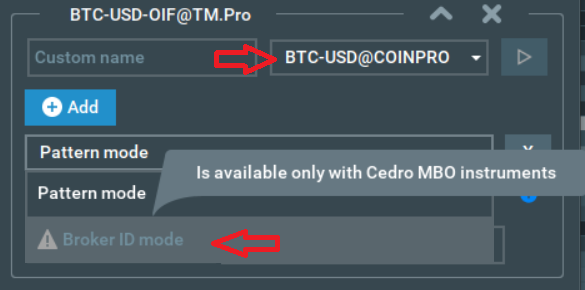
This feature gives you the ability to focus specifically on the orders and activities of particular brokers, enabling you to analyze their performance and adjust your trading strategies more effectively.
Order duration filter
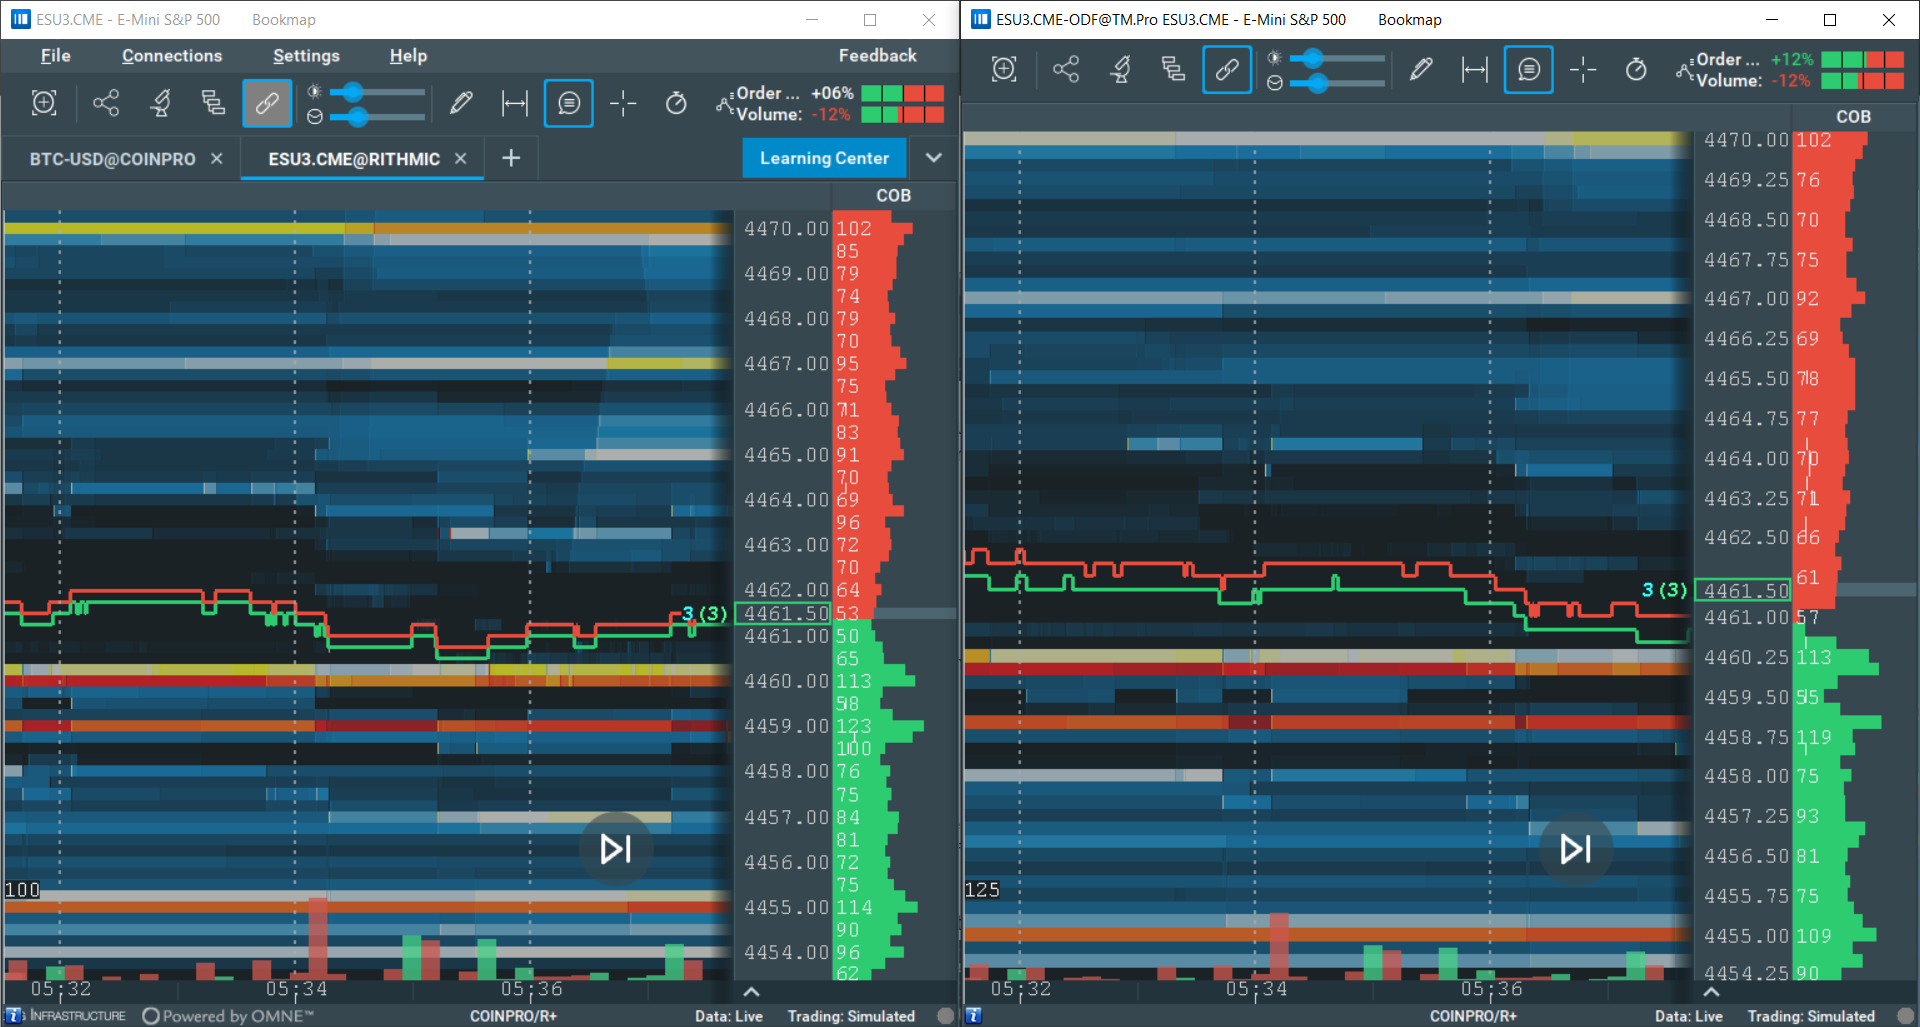
This filter lets you choose how long an order must stay on the books to show on the chart. This means that orders will not show on the chart until they have remained on the books for a certain length of time.
Example
If you set it to 60 seconds, only orders that stay on the books for at least 60 seconds will show on the Tradermap Pro chart.
Why Is This Useful?
Some orders come and go very fast because of computer programs, or "algos." These quick changes can make the chart confusing and hard to read. With this filter, you can remove these quick changes and make the chart clearer.
You can use this filter with other filters to get even better results, and customize the specfic amount of time orders must have existed for in order to show on the chart.

Data transformations
Number of orders per price
The Number of orders per price is a special chart view filter that shows the quantity of orders on each price level. Not only is the heatmap altered by this transformation; all the columns and add-ons used with this feature will also display the number of orders per price level, instead of the total size of a price level.
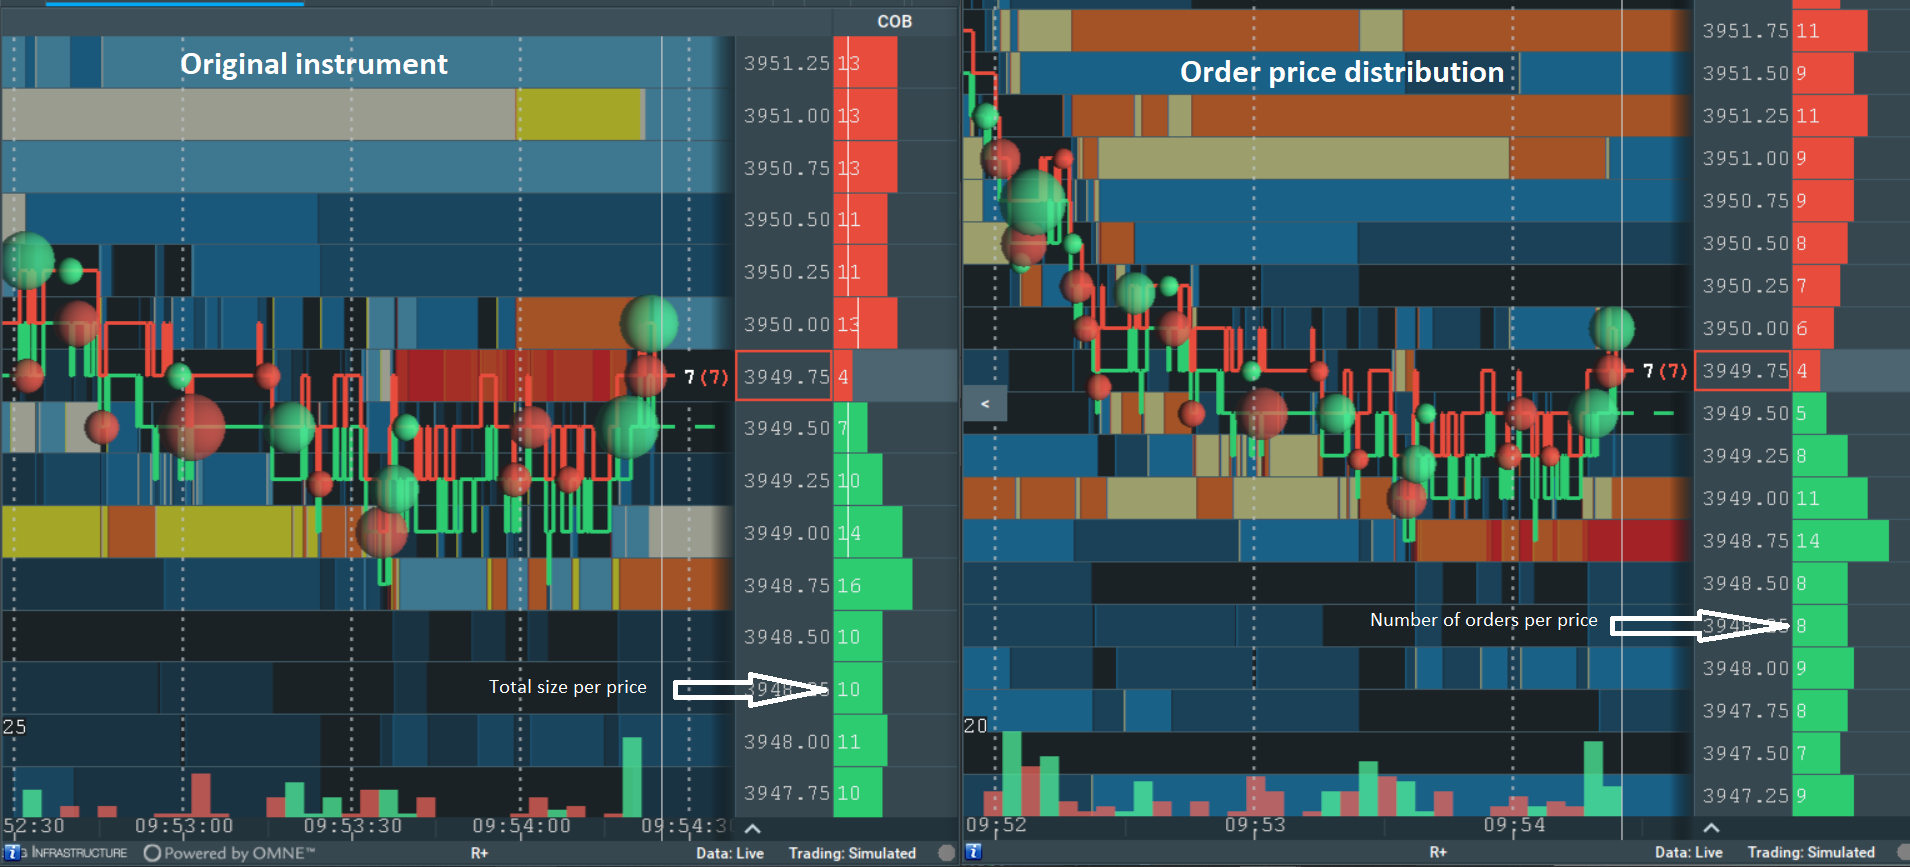
Example: In the image below you can see the original instrument (on the left) compared to the instrument with the Number of orders per price filter applied (on the right). The COB column on the Number of orders per price chart now represents the number of orders, Whereas the original instrument shows you the total size (sum of) of the orders on price level.
On the original instrument in this screenshot, for instance, the size of 4 on the price 3949.75 may consist of 4 orders with the size 1 each (1+1+1+1), or 2 orders (3+1 or 2+2) or 3 orders (1+1+2). The Number of orders per price filter shows traders exactly how many orders there are in the orderbook on each price level. For the price 3949.75, traders an see with the Number of order per price filter that there are 4 orders with a size of 1 each.
Distribution of orders by size
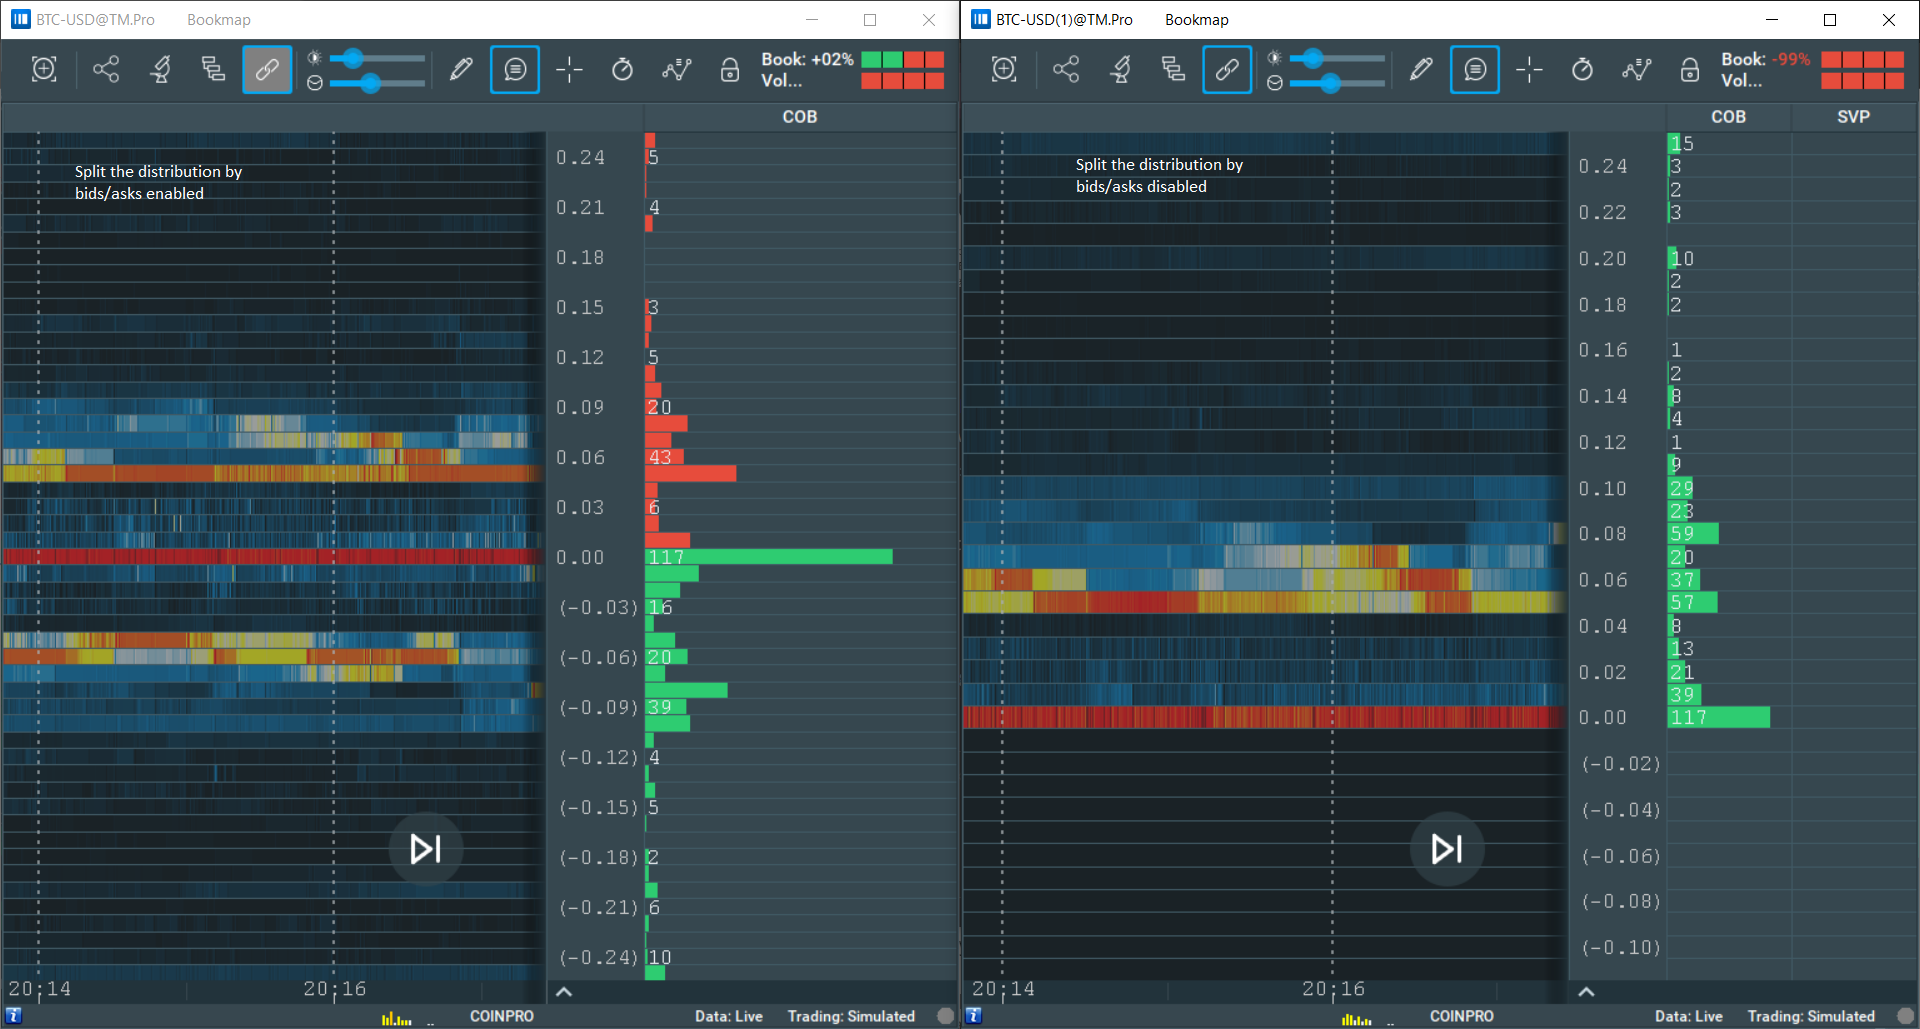
Distribution of orders by size is a special chart where the size of the orders is replaced by their quantity, and the price is replaced by the size. On this heatmap chart there is no price axis at all, and all the columns and add-ons with this filter applied will also display the number of orders instead of size, and the order size instead of price.
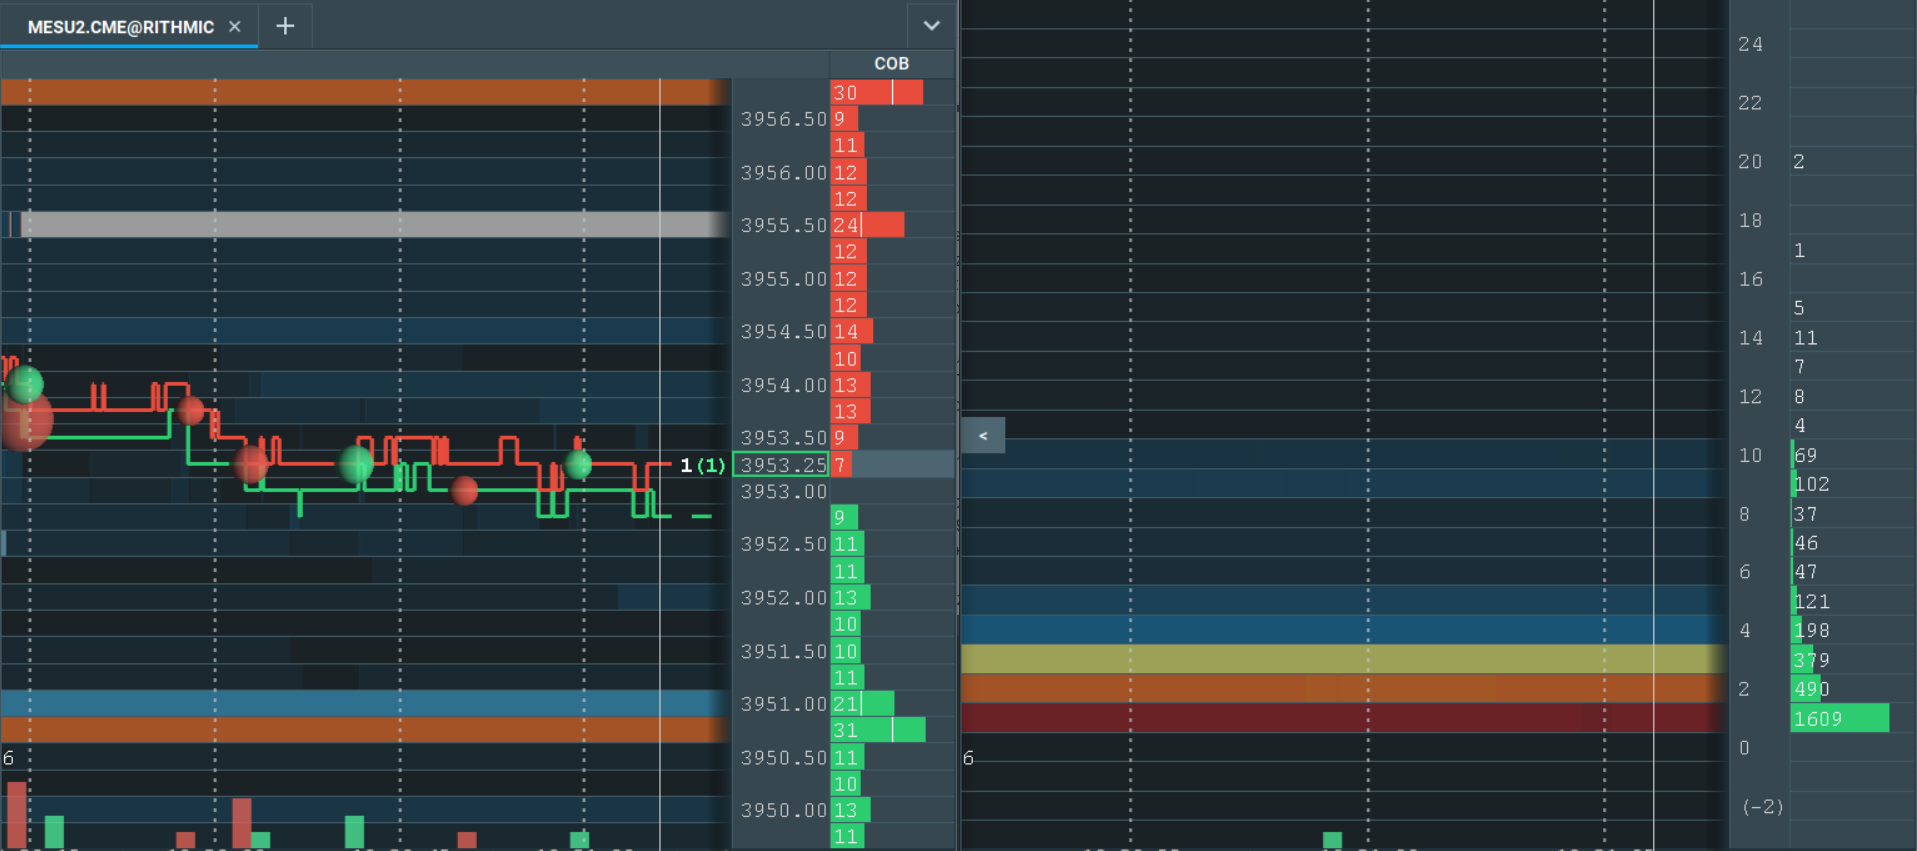
Example: On the image below you can see the original instrument (on the left) compared to the insturment with the Distribution of orders by size applied (on the right). The COB column on the Distribution of orders by size chart now represents the number of orders, while the usual price column represents the sizes.
Using the Distribution of orders by size chart shows traders can see that there are 1609 orders with a size of 1 in the orderbook, 490 orders with the size of 2, 379 with the size of 3, etc. The maximum order size is 20 and traders can quickly identifty that there are 2 orders with said size at this moment in the image below.
This proves to be a crucial tool in your trading arsenal, allowing you to quickly digest information on order sizes and larger market trends based on the distribution of orders.
Split the distribution by bids/asks
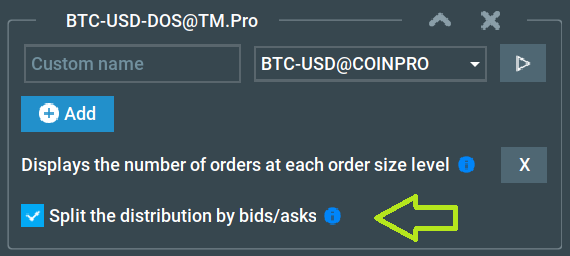
This feature allows you to see bids and asks separately. Bids will be displayed at negative levels, as if they are mirrored.
Aggregation
We aggregate data in two cases:
- Some exchanges have a smaller granularity of size than Bookmap, so when rounding we can get zero size. That is why at the price of zero (which in our case corresponds to size zero) you will see the sum of bids and asks.
- If you turn off the “Split the distribution by bids/asks” function, bids and asks will be aggregated, so the values shown are equal to the ask orders + bid orders number.
Average order size
This allows you to see the average order size at any configured price level.
For example, if there are two orders with sizes 10 and 30 at the price level 100, you will see the average order size, which in this case is 20, after applying the filter.
Canceled book
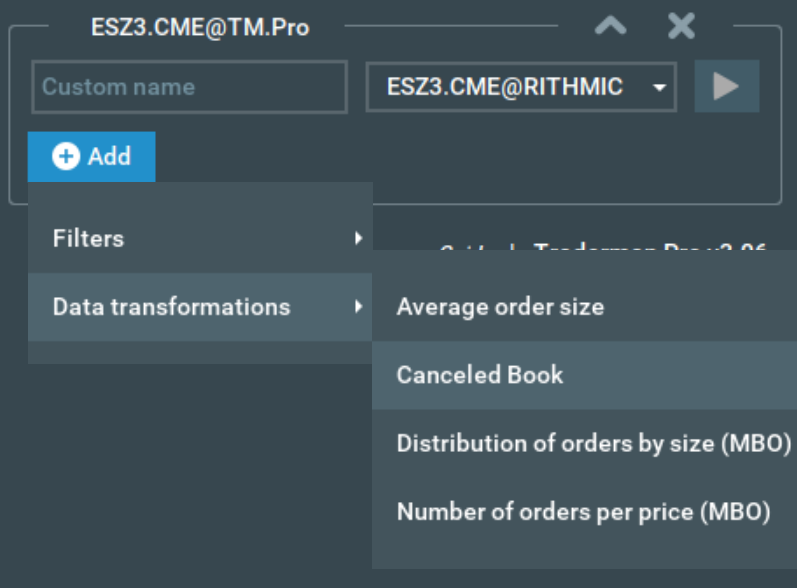
This feature shows orders only after they are canceled.

How It Works
Normal heatmaps show changes when a new order is placed or an old one is changed. But when you use the Canceled Book feature, the heatmap will show only the orders that have been canceled, along with their sizes.
You can pick how long canceled orders will remain on your heatmap.
Example
- Let's say you set canceled orders to show for 5 seconds.
- If an order of size 10 at price 100 is canceled, the heatmap will show 10.
- If another order of size 5 at the same price is canceled 1 second later, the heatmap will show 15 as an aggregate canceled order.
- 4 seconds later, the first order will be gone, so the heatmap will show 5.
- After 1 more second, the heatmap will show 0.
Price inversion
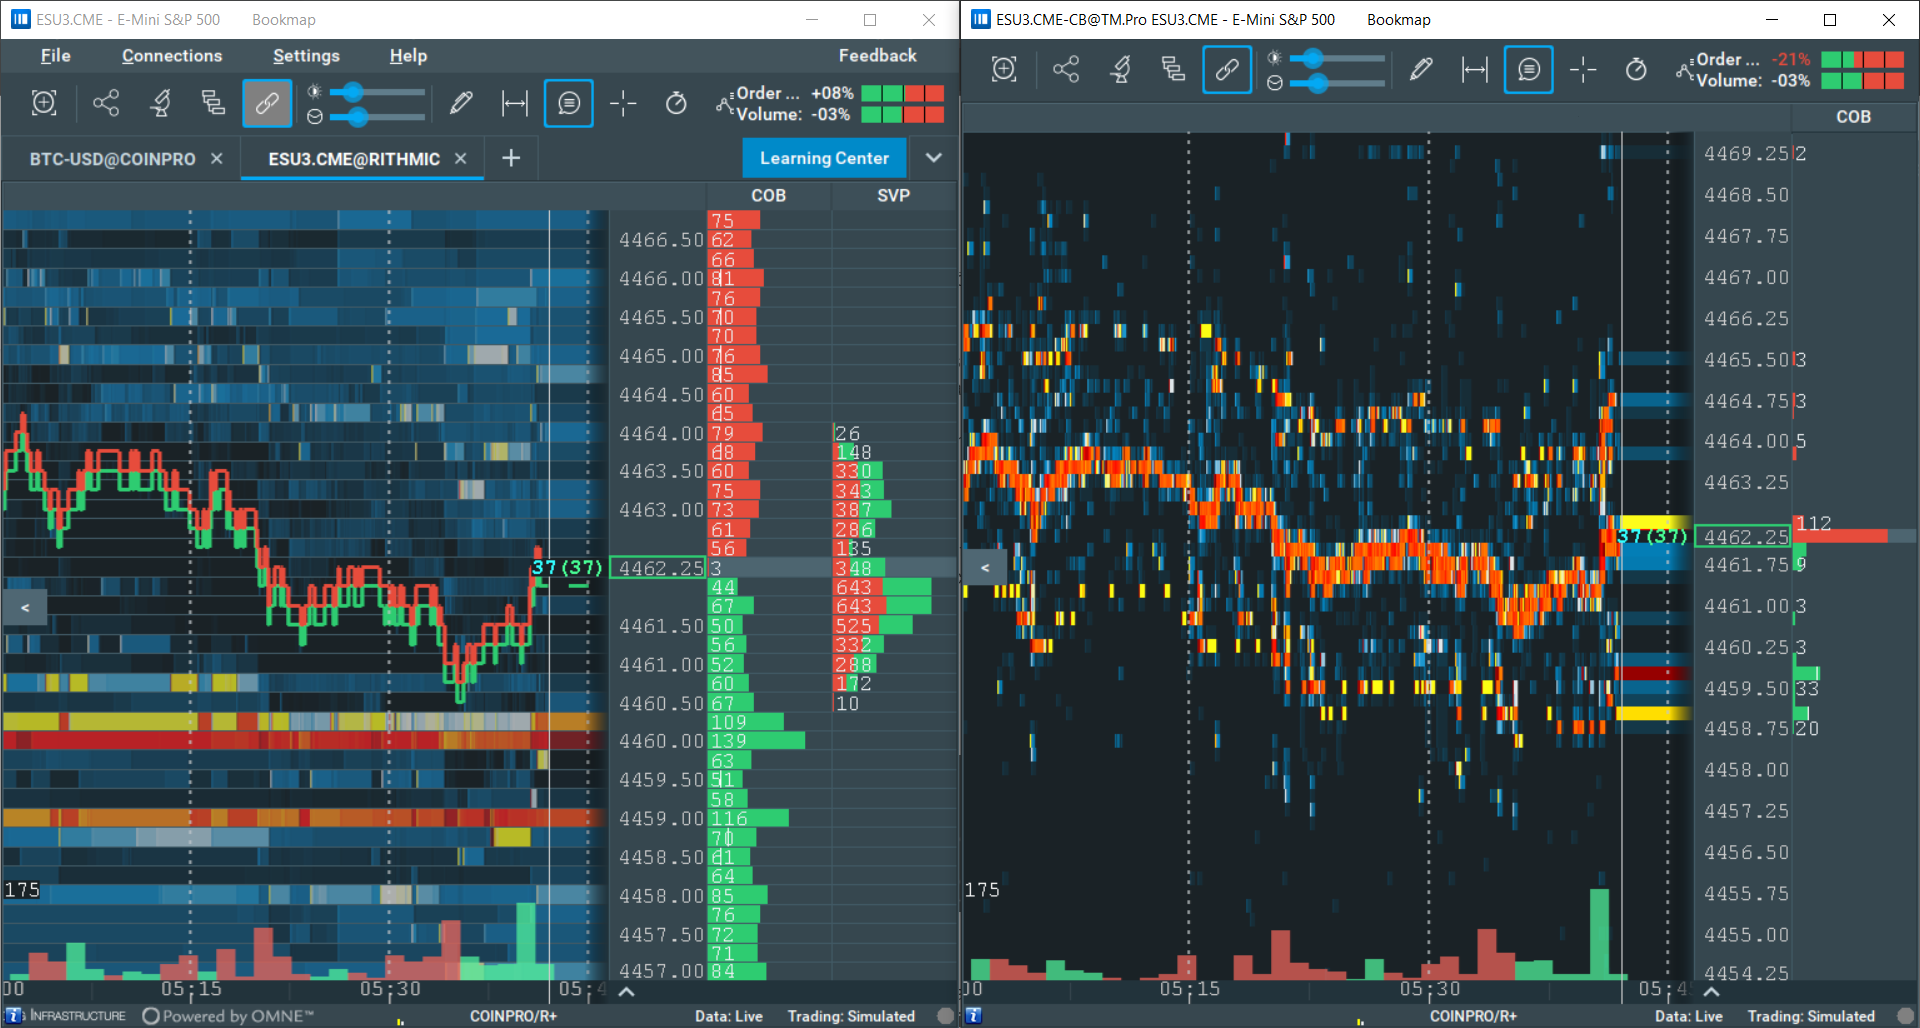
The price inversion filter allows you to see how many shares you can buy for a single dollar, instead of the whole price of one share.
The Price Inversion filter has two modes:
Price * (-1)
Multiplies all prices by -1, thus flipping the chart.
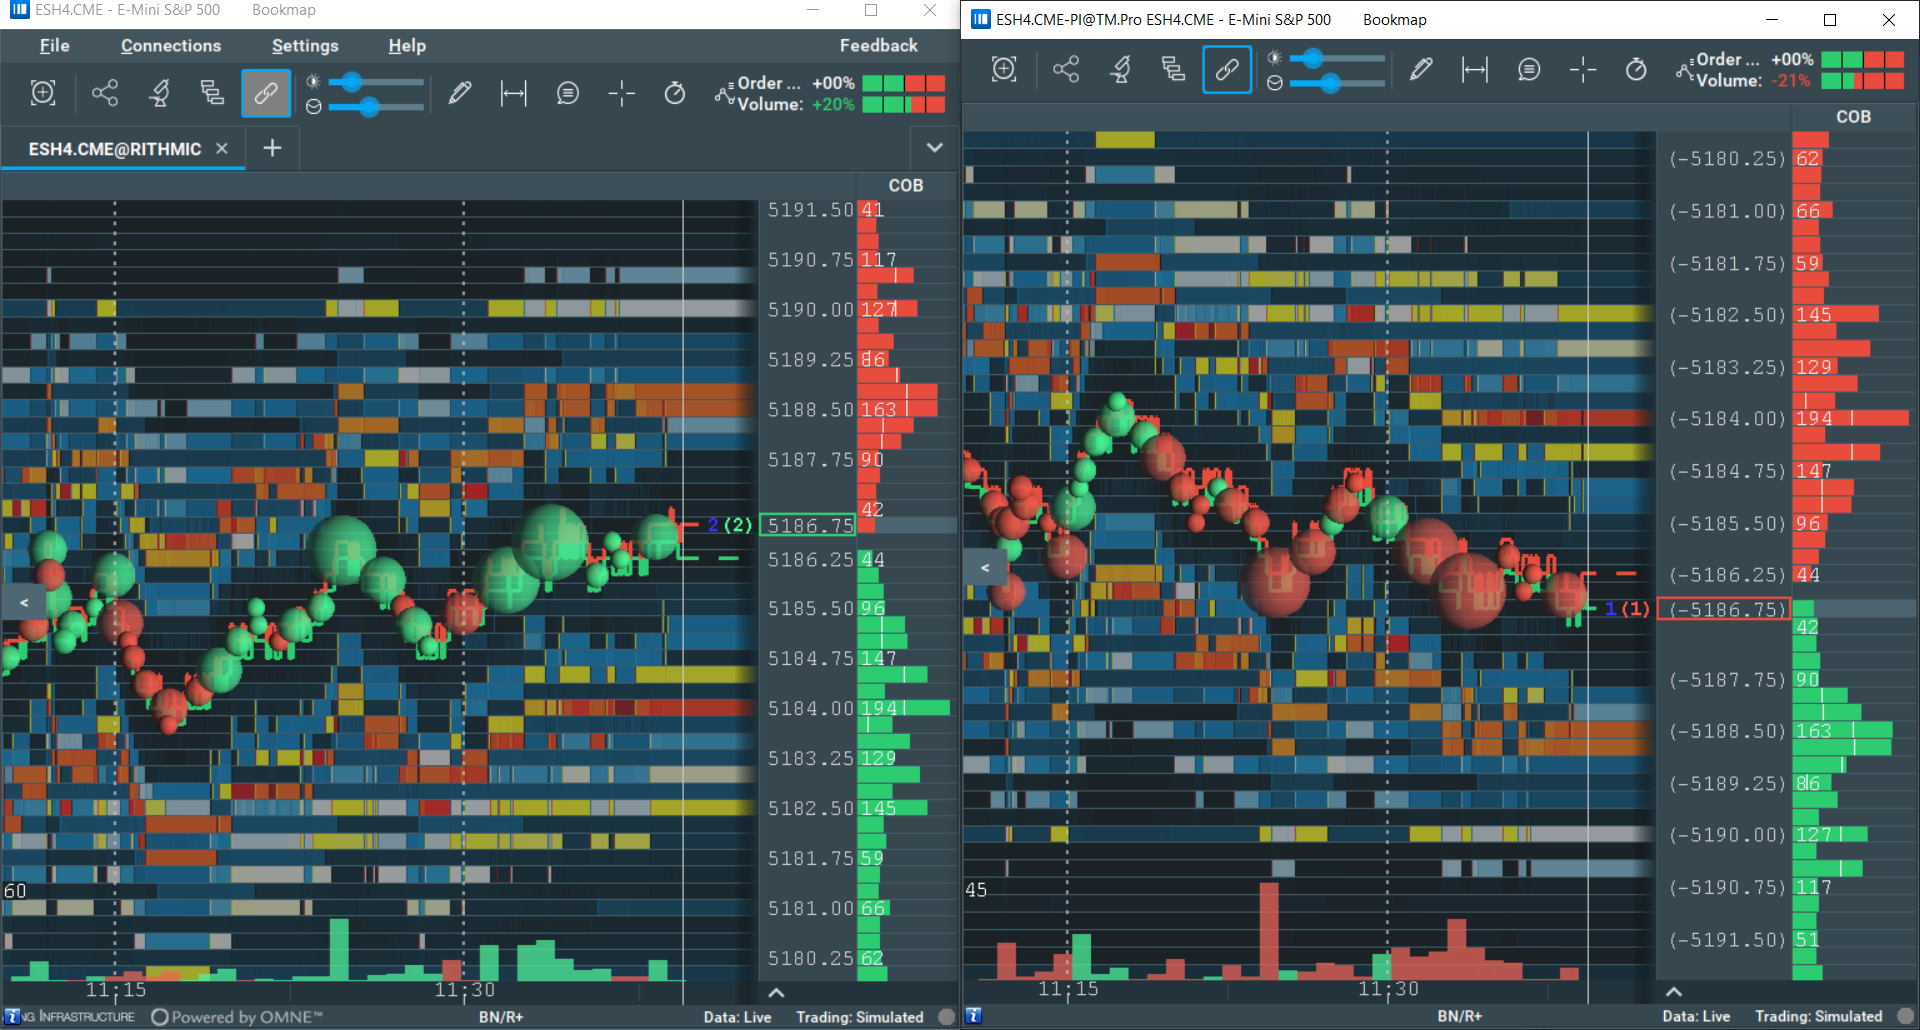
1 / Price
This mode allows you to see how many shares you can buy for a single dollar, instead of the whole price of one share.
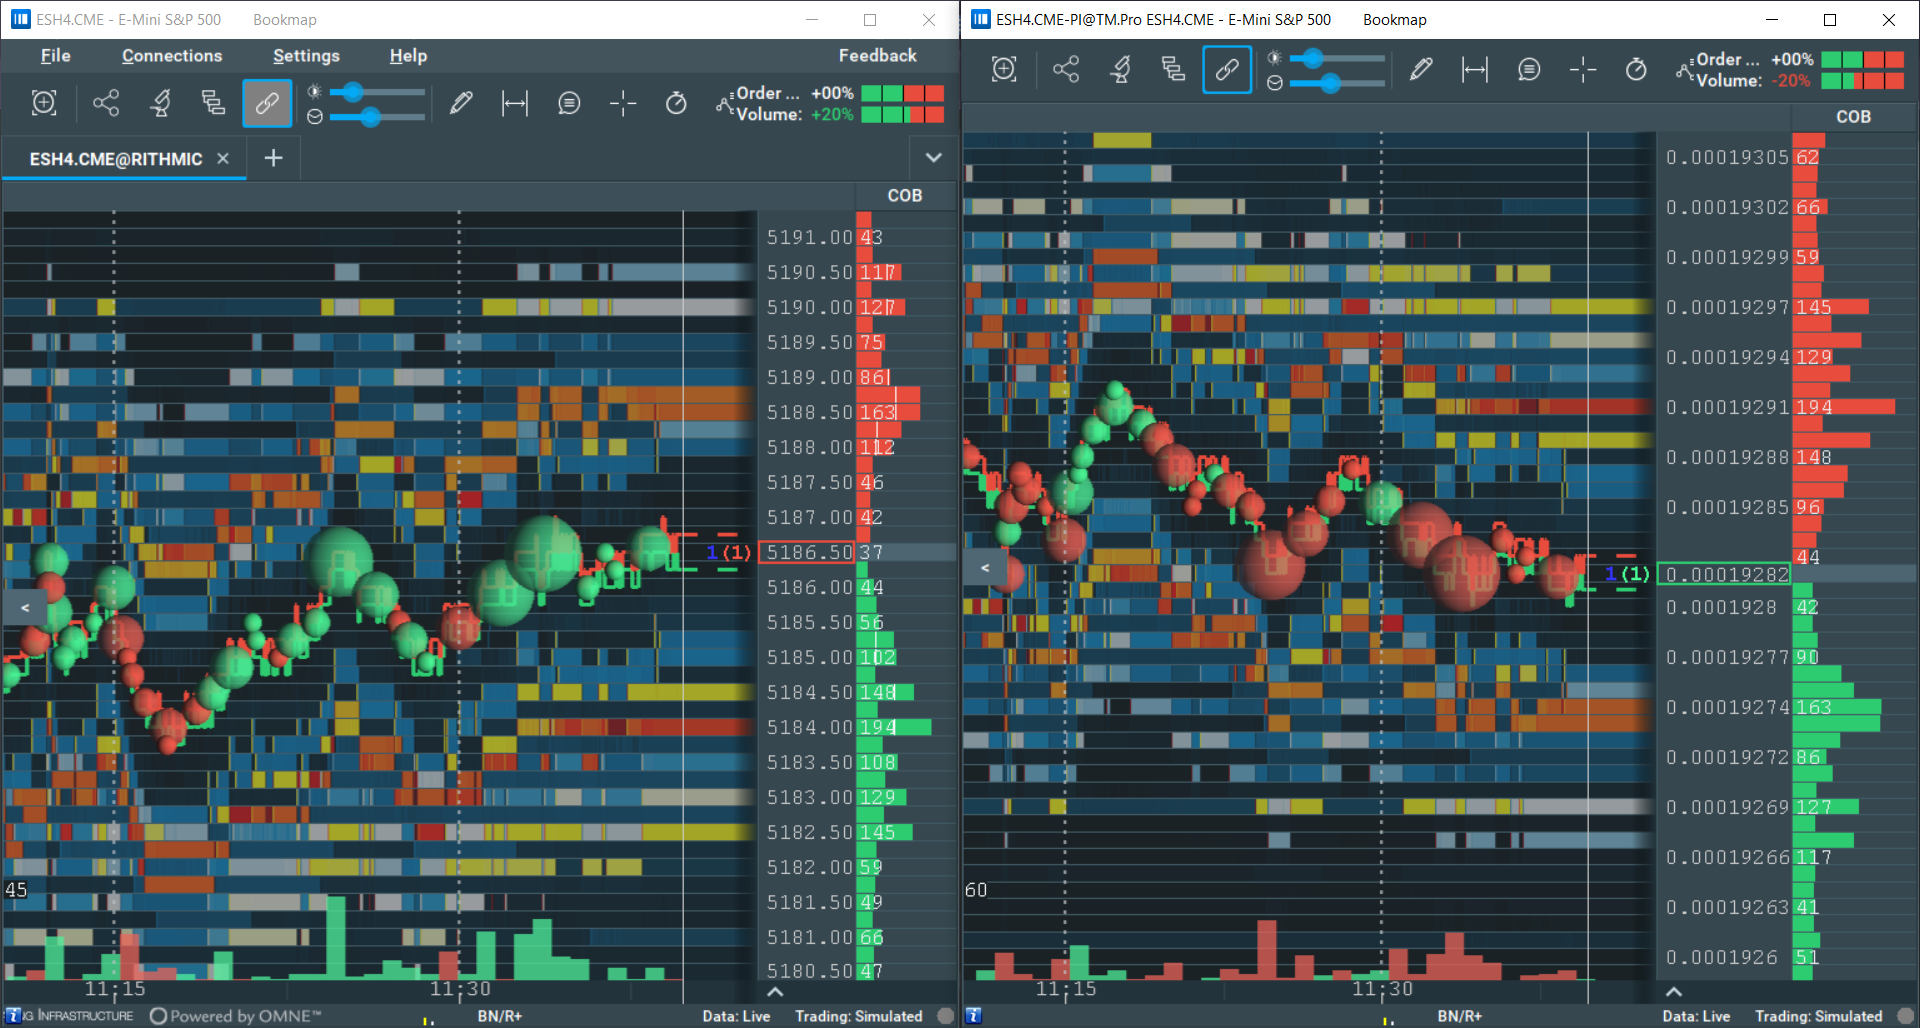
Please note that after the inversion, the sides of both the orders and trades will be reversed.
Filter combination
To allow traders to create their own tailored trading platform, It is possible to combine multiple filter types all on one chart. This opens up a field for experimentation, helping you create exactly the charts you need to maximise your trading.
In the case of combining the Order size filter with the Number of orders per price, the Order size filter will be always applied before the Number of orders per price. This means that some orders will be filtered out before the result is transformed into the Number of orders per price chart.
For filters that involve data transformation (Number of orders per price and Distribution of orders by size), you can only add one of them at a time. So you cannot add the Number of orders per price and the Distribution of orders by size to the same chart.
It is currently not possible to add the Order size filter and the Distribution of orders by size to a chart at the same time.
Order of filters
The filters you select filter the data in a specific order. That is, first, all data passes through the first filter, then the data that has successfully passed the filtering goes to the second filter, and so on. This is done for several reasons: to ensure that less data passes through more complex logic (saving resources), sometimes the data must first pass through the first filter and only then through the second, otherwise the meaning of the filters is lost (for example, the combination of Order Size Filter and Distribution of orders by size).
This table shows the order in which filters are added (some filters are added only to the end or only to the beginning)
- Canceled Book, Order Duration Filter
- Data filters (like an Order Size Filter)
- Data transformations (like an Average Order Size)
Tips
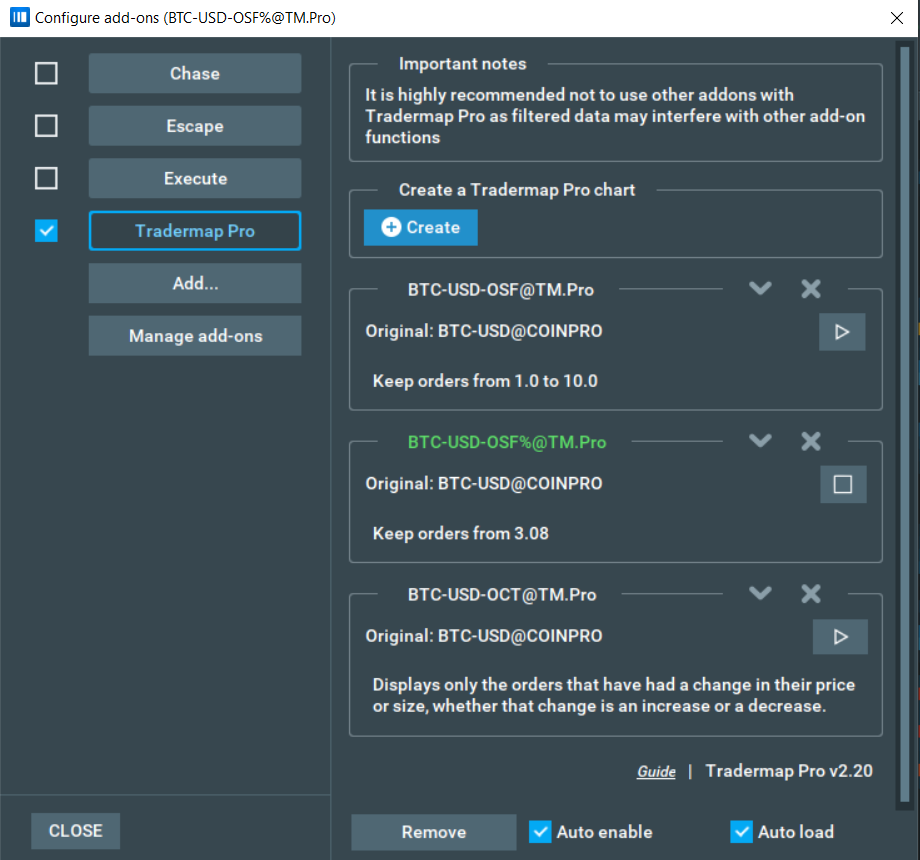
If you open the Tradermap Pro settings dialog, the current opened Tradermap Pro chart’s configuration title will be marked with green.
Historical data
After subscribing to a Tradermap Pro chart, historical data from the original instrument will be downloaded and filtered.
Tradermap Pro transfers all trades from the original instrument to the newly created copy as either history or as live data, no matter how they got to the original.
However, not all depth data is transferred the Tradermap Pro chart is able to load only the MBO data accumulated live by the original instrument. It is the exchanges restrictions, unfortunatly they do not provide hitorical MBO data.
For example, you subscribed to the original instrument, waited 30 minutes and downloaded an hour of history. Then you subscribe to the copy. On the copy, you will see all the trades (from the last 1 hour and 30 minutes), but only 30 minutes of all the depth data.
Constraints
Maximum number of Tradermap Pro charts
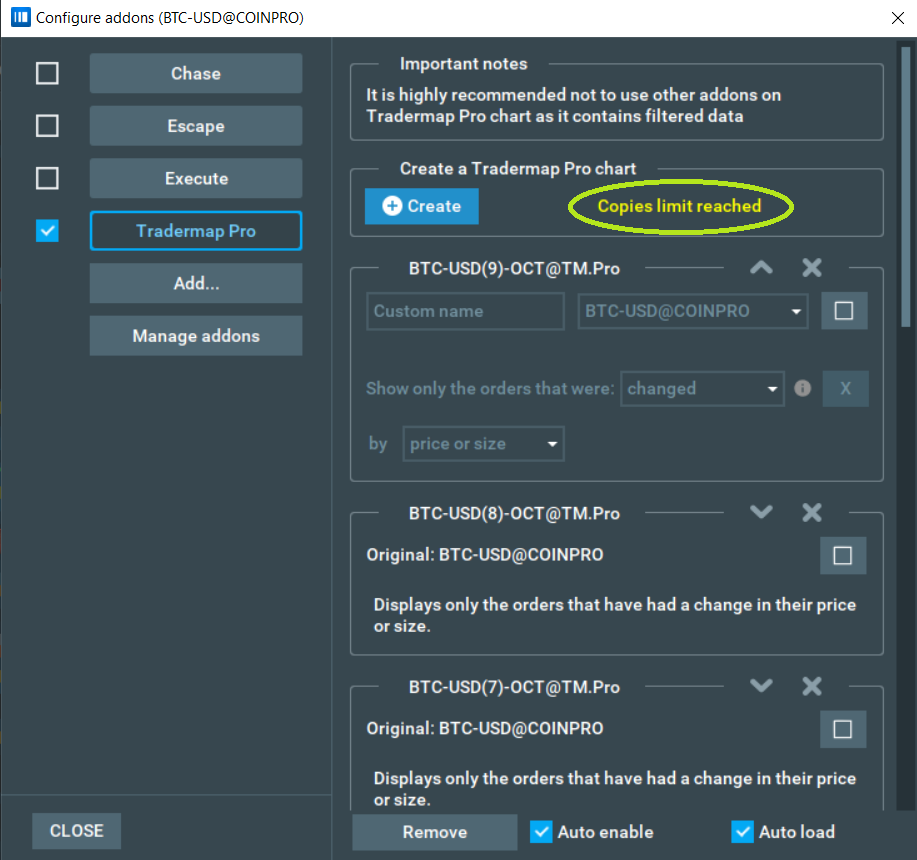
When you reach the limit of the number of Tradermap Pro charts, you will see a corresponding message and you will not be able to subscribe to new Tradermap Pro charts.
To be able to subscribe to new instrument you need to unsubscribe from any Tradermap Pro chart.
You can, however, create new copy panels for your Tradermap Pro instruments.
It is not possible to create a Tradermap Pro chart from another Tradermap Pro chart.
Important notes
- The minimum compatible version of Bookmap for using Tradermap Pro is 7.4.0.11
- Currently, there is no way to create a copy from an instrument created by a client-side Multibook add-on.
Feedback
Survey link: https://bookmap.com/addons/tradermap-pro/survey
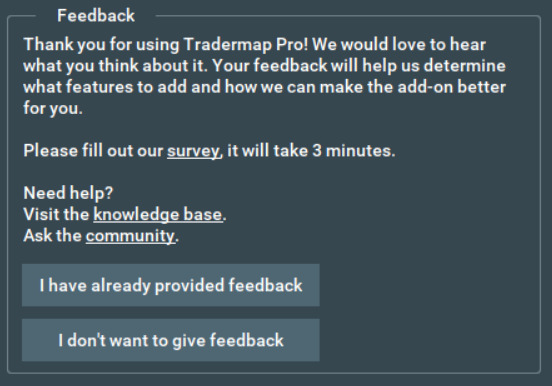
After one hour of using the add-on, you will be prompted to give feedback - this feedback helps us improve the add-on for future use, and is the best way to see your suggestions implemented.
You will see the feedback panel in the add-on configuration panel.
Answer options:
- I have already provided feedback: This panel will no longer appear.
- I don’t want to give feedback: This panel will no longer appear.
Tradermap Pro FAQ
I created a Tradermap Pro chart of an instrument, but it has no data despite the original instrument having data. What should I do?
- Try to remove some filters or decrease the thresholds on the Tradermap Pro chart to make sure that you get all available data there. This is because it is possible that the filters are removing the data shown on the original instrument chart, especially if the filters are quite narrow.
I have a question about Tradermap Pro, who can I ask?
- Feel free to ask any questions in our Discord channel or contact support@bookmap.com
I closed the original instrument - why do my Tradermap Pro charts close as well?
- All the Tradermap Pro charts source their data directly from the original instrument, and so cannot exist separately. If you close the original instrument, there is no data for the Tradermap Pro charts to use, and so all Tradermap Pro charts will automatically close.
Why were the BBO (Best Bid and Offer) lines moved when the order size filter was applied?
- When you apply the order size filter, it filters out some orders from the order book for this chart. The BBO line is based on the order book data, and it is calculated after the filter applies. So if any of the best bid or ask orders were filtered out, the BBO line will be moved to the new best bid/ask. In this case, it will not be a real BBO line. That is why in this case the trades may be located in between the BBO.
Why can’t the SpotGamma cloudnotes be loaded on Tradermap Pro chart instruments?
- Unfortunately this is because the cloudnotes CSV contains the full instrument names to allow them to be loaded - in the case of a Tradermap Pro chart this name is changed.
- There is, however, a Workaround: first, export Notes from the main instrument, and then change the name to match the Tradermap Pro chart's. You can then import to the Tradermap Pro chart instrument, as the names will now be matching.
Why can't Tradermap Pro be used in replay mode?
- It is not possible to use Tradermap Pro add-on.
How to launch Tradermap Pro on a Cedro instrument?
- The add-on works only with Cedro L0 data adapter. Use this guide to install the latest available version of the adapter.
Is it possible to use Stops and Icebergs on top of Tradermap Pro chart?
Yes, it is possible to use Stops and Icebergs on the Tradermap Pro chart. Follow the Stops and Icebergs guide to read more.
Is it possible to trade from the Tradermap Pro chart?
Yes, Tradermap Pro allows synthetic instruments created by the addon to cross-trade to the original instrument and to any instruments that the original instrument can cross-trade to. For example, if a synthetic copy is created from ES@RITHMIC, it can cross-trade to both ES@RITHMIC and MES@RITHMIC. Please note that in Bookmap 7.5, cross-trading is only supported to the original instrument.
Disclaimer
This version of the add-on has known bugs and issues. We recommend avoiding using this add-on while you are trading.
Known bugs and issues:
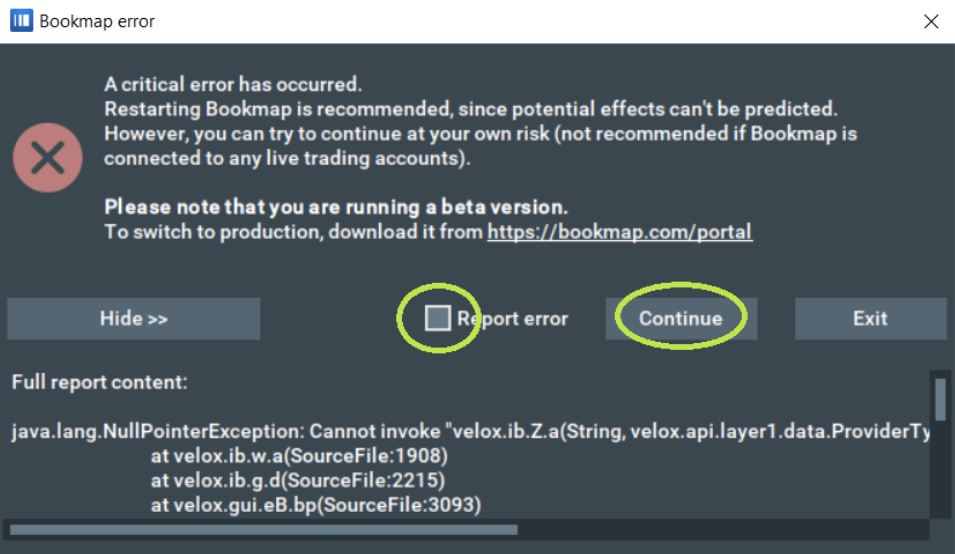
- Tradermap Pro supports cross-trading from the Tradermap Pro chart to the original instrument. Note: If cross-trading is not enabled, you can still open the TCP panel and click FLATTEN. In this case, you will see the 'Bookmap error' window. You can ignore this message and simply press the continue button (there is no need to report this error).
Installation
Please note that the Tradermap Pro is only compatible with Bookmap version 7.4.0 build 11 or higher.
Additionally, this add-on takes advantage of the new Add-ons Manager feature, which simplifies both the installation and updating process. If you'd like to learn more about the Add-ons Manager and how it can benefit your experience, please visit the following page.
Versions changelog
3.16
Improvements:
- Added the Canceled Book feature
- Added the Order Duration Filter
- Added the Average Order Size feature
Fixed bugs:
- Fixed a crash that occurred if you enabled the add-on on DXFEED instruments while the market was closed.
- Fixed a bug where Tradermap Pro settings were sometimes not saved.
- Fixed a crash that sometimes occurred when trying to add the Order ID Filter for CEDRO instruments.
- Minor UI fix.
2.57
Fixed bugs:
- Fixed: issues with the file for the Broker ID filter that led to crashes
- Fixed: problem with trades that occurred on the Broker ID filter and led to a crash (Aggressors for trade components did not match).
- Fixed: issue that occurred when the add-on was turned on or off, leading to a crash (Order ### already exists).
- Fixed: bug causing freezing charts.
- Fixed: bug that led to the error "publishing candle too late".
- Fixed: bug where active copies persisted after users turned off the add-on, which then required users to manually unsubscribe from them.
Improvements:
- History aggregation has been reduced to 100 milliseconds.
