Strength Level Indicator
What is Strength Level?
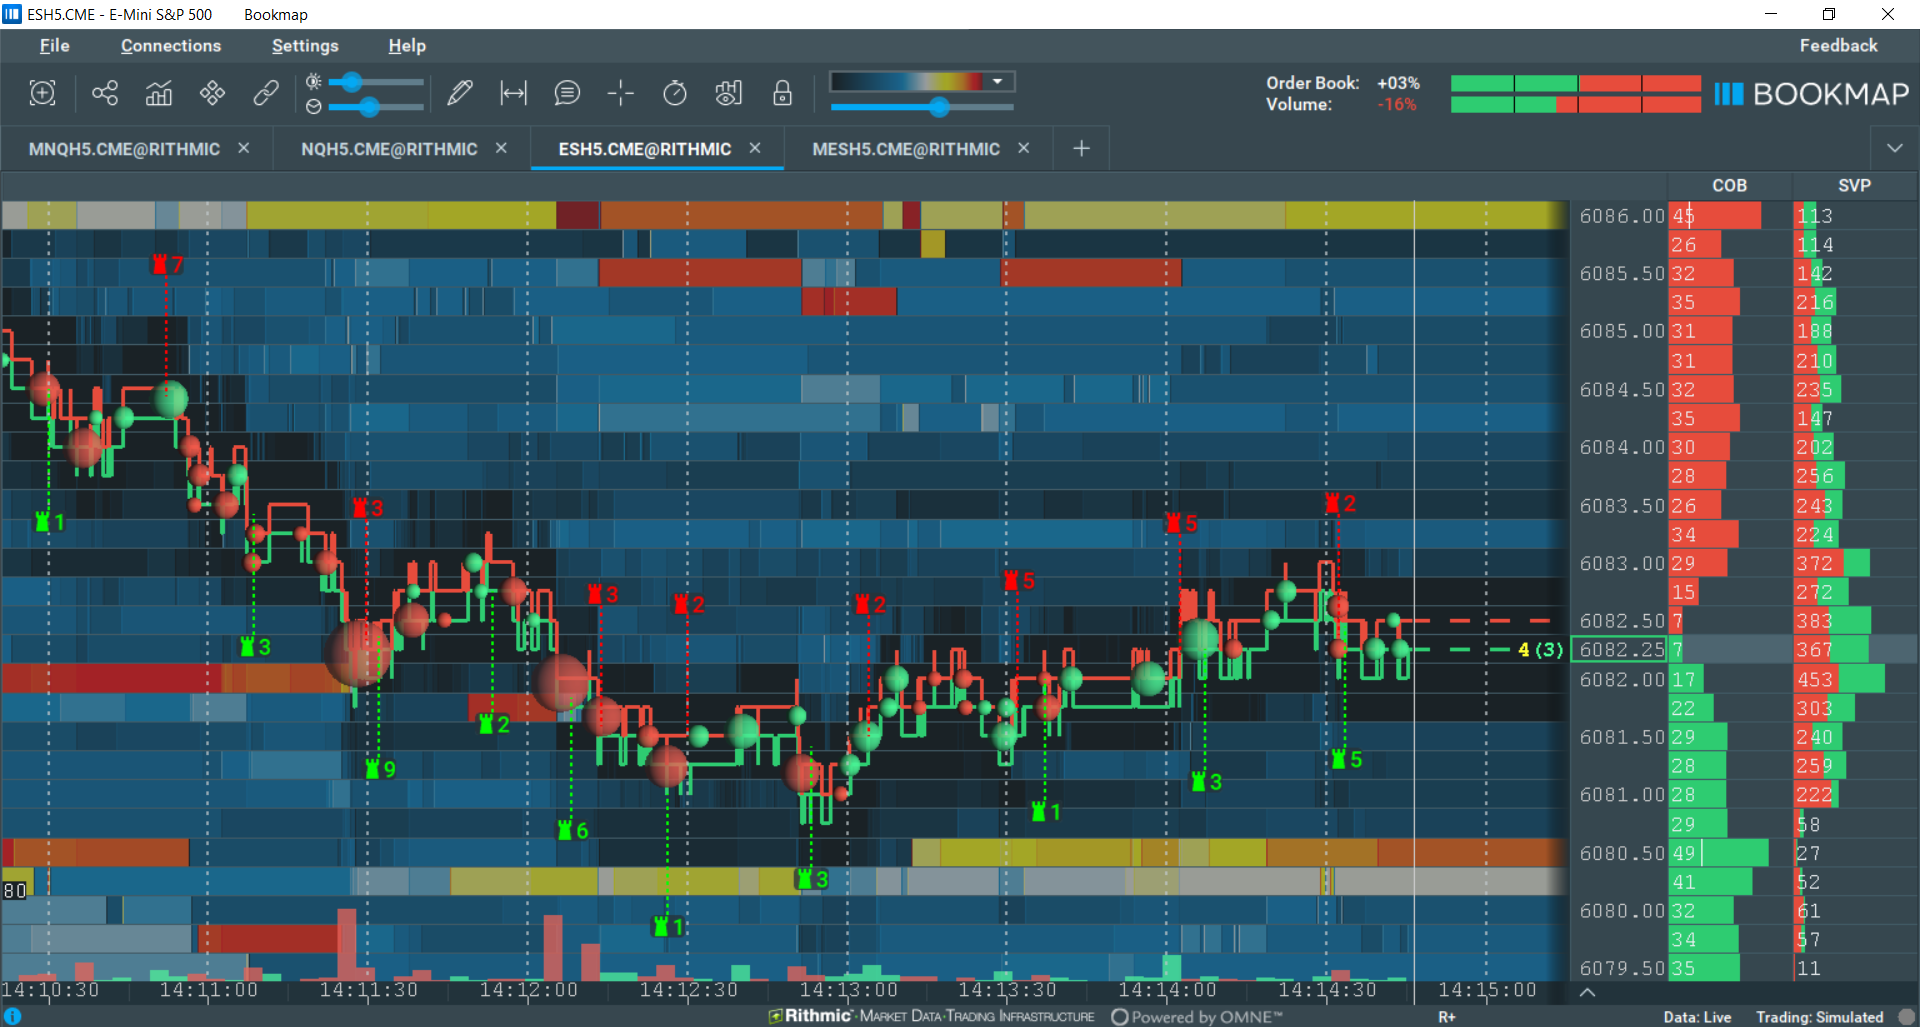
The Strength Level Indicator add-on displays the number of hidden contracts on the heatmap. Bookmap generates the iceberg indications based on the difference between the actual pending orders offered at that price level and the actual number of orders that transacted at that price level. For example, if the Strength Level Indicator displays 43, this signifies that 43 more contracts were transacted than were available in the order book at that specific time. In contrast, the display of the strength level on the chart does not depend on a specific chart range and is placed at the relevant time and price on the chart.

Traders can assess the possibility of hidden liquidity at certain price levels with the Strength Level Indicator. Since hidden orders are usually associated with the activity of more sophisticated players, traders may also use this information to assess possible short-term price action and areas of resistance or support.
Configuration
Modes
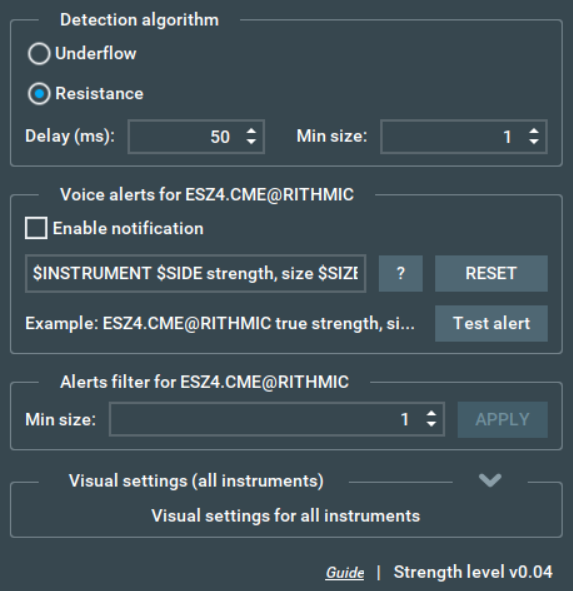
It contains two modes: Underflow and Resistance
- The Underflow algo reads the quantity in the order book and the size of the transactions made. If the transactions are bigger than the amount of liquidity in the order book, we assume it is an iceberg order. It might not work on some data sources as it relies on depth data being aggregated.
- The Resistance indicator detects how fast limit orders are added to the order book after a transaction. Users can configure the delay since the transaction and also filter the minimum size. With a small delay value and high-quality data, it may produce results similar to the Native Iceberg, although this option is less reliable than the Native Iceberg*.
The Strength Level Indicator works with many data providers and many exchanges. The quality of the detections depends on both your market data provider and the sequence of events received. Because of the inaccuracy of data provided and the algorithm used, false positives can occur. For instance, when there is an unrelated size increase shortly after a trade, despite those belonging to two different users and are just a coincidence, the algorithm will see it as a Strength Level).
*Native Iceberg, part of the Stops & Iceberg Tracker add-on within the MBO bundle, can be purchased on the Bookmap Marketplace. It solely tracks CME MBO data and is currently supported by Rithmic.
Such icebergs are iceberg orders directly managed by CME exchange. The Stops & Iceberg Tracker shows the executed iceberg segment, viewable on the bottom Indicator Panel. For more information, visit the MBO Bundle page.
Other settings
To enable the Strength Level Indicator, click the Studies Panel icon above the chart and check the Strength Level Indicator box.
- Users can control the colors of indications for sell and buy orders.
- Users can also set voice alerts and apply an order size filter for the alerts. There are no specific settings for the Strength Level Indicator.

Limitations
The Strength Level Indicator can only display hidden orders after the execution of those orders has taken place; it is not forward-looking. It cannot display hidden orders currently resting at specific price levels. As mentioned earlier, discrepancies are likely to occur in low-quality data. Even on colocation servers, high-quality data and timing are very important for proper iceberg detection. We recommend starting from a setting of 5ms delay and testing the results. In fact, the best option to filter out some noise will be 0.5ms. For example, 50ms is quite a long time in the HFT environment. Bear in mind, though, that in general, discrepancies will occur; this is the nature of the business and technology. To get very precise iceberg detection would require the highest quality data with a collocated dedicated connection directly at the exchange.