Footprint Indicator
What Is The Footprint Indicator?
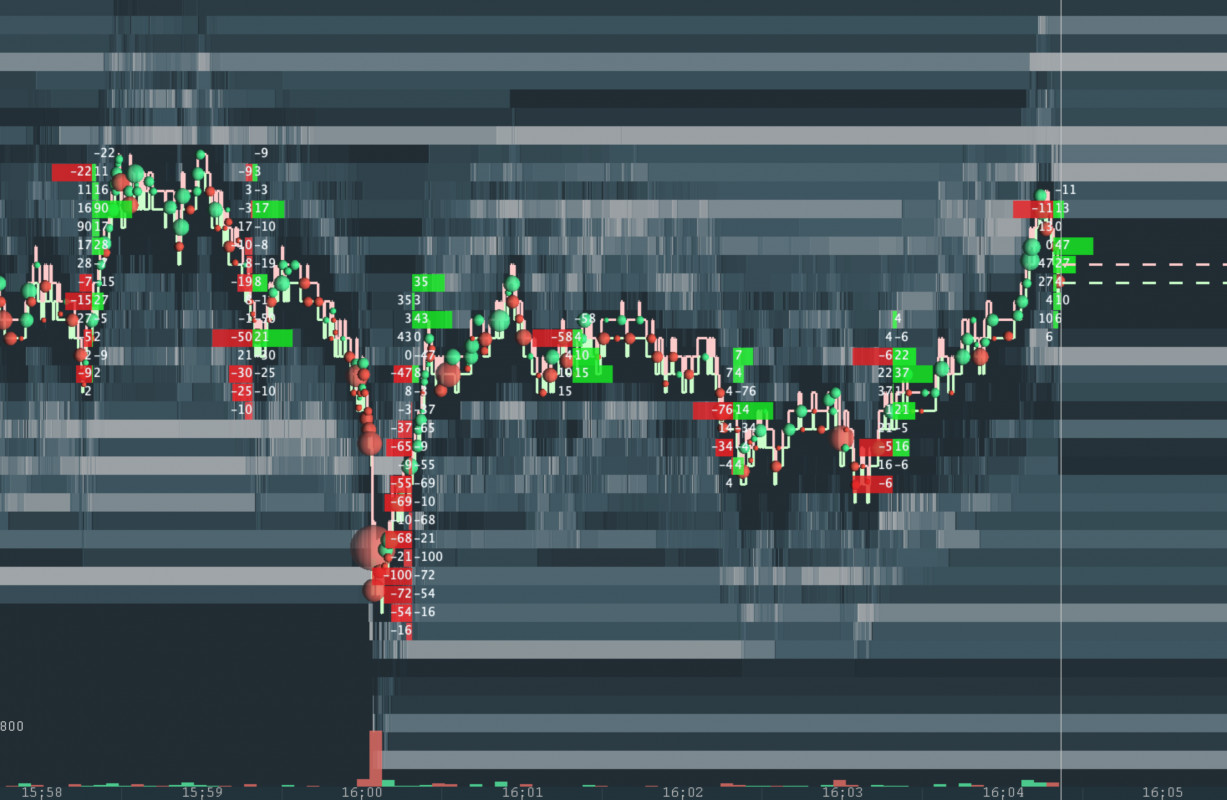
This indicator offers Footprint (Number Bar) variations for Bookmap, including:
- Time interval (30 seconds to 30 minutes)
- Reversal bar
- Range bar
- Volume bar.
After using this add-on, please provide us feedback: https://bookmap.com/addons/footprint/survey
Video Walkthrough:
Configuration
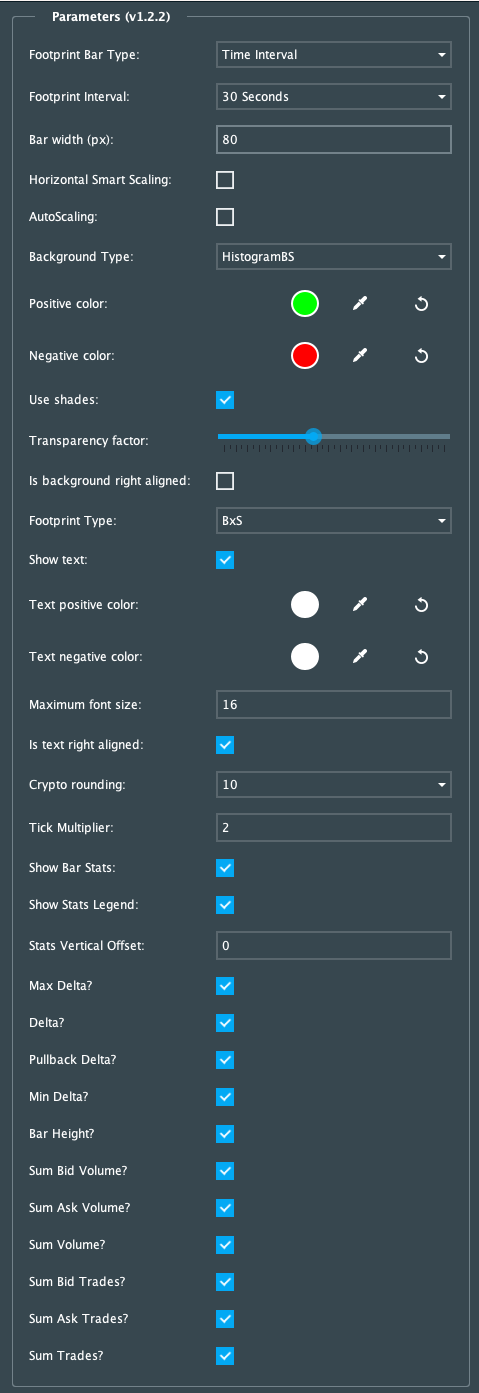
The dropdown "Footprint Bar Type" allows selection among bar types. Settings below adjust based on the chosen bar configuration.
Time Interval Type
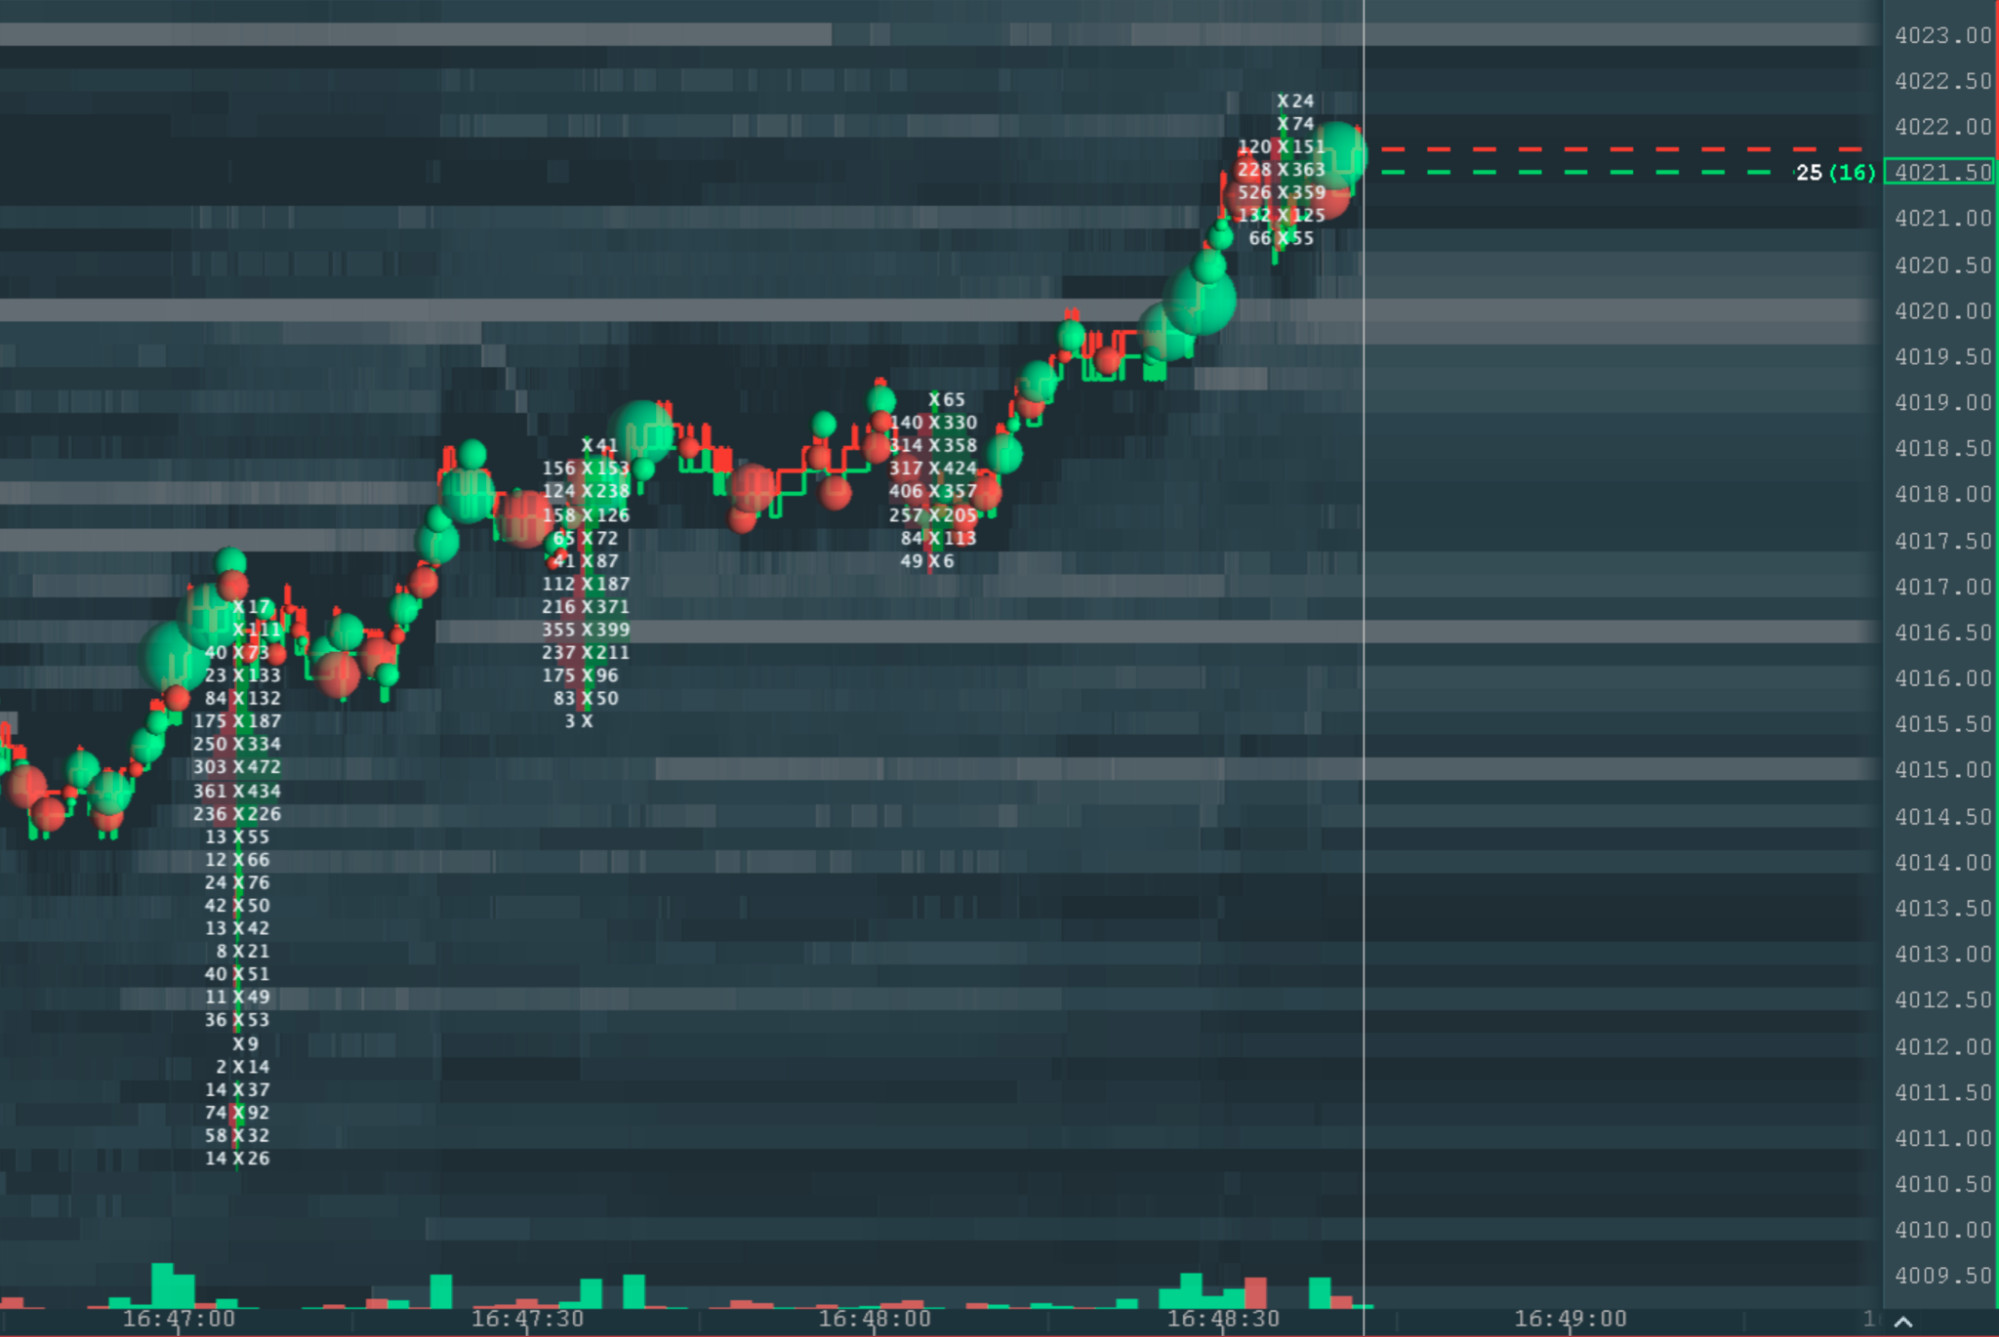
"Time Interval" provides time-based bars. A new bar forms at each set interval, ranging from 30 seconds to 30 minutes.

For example, a setting of 30 seconds will overlay a footprint bar every half a minute:
Reversal Type
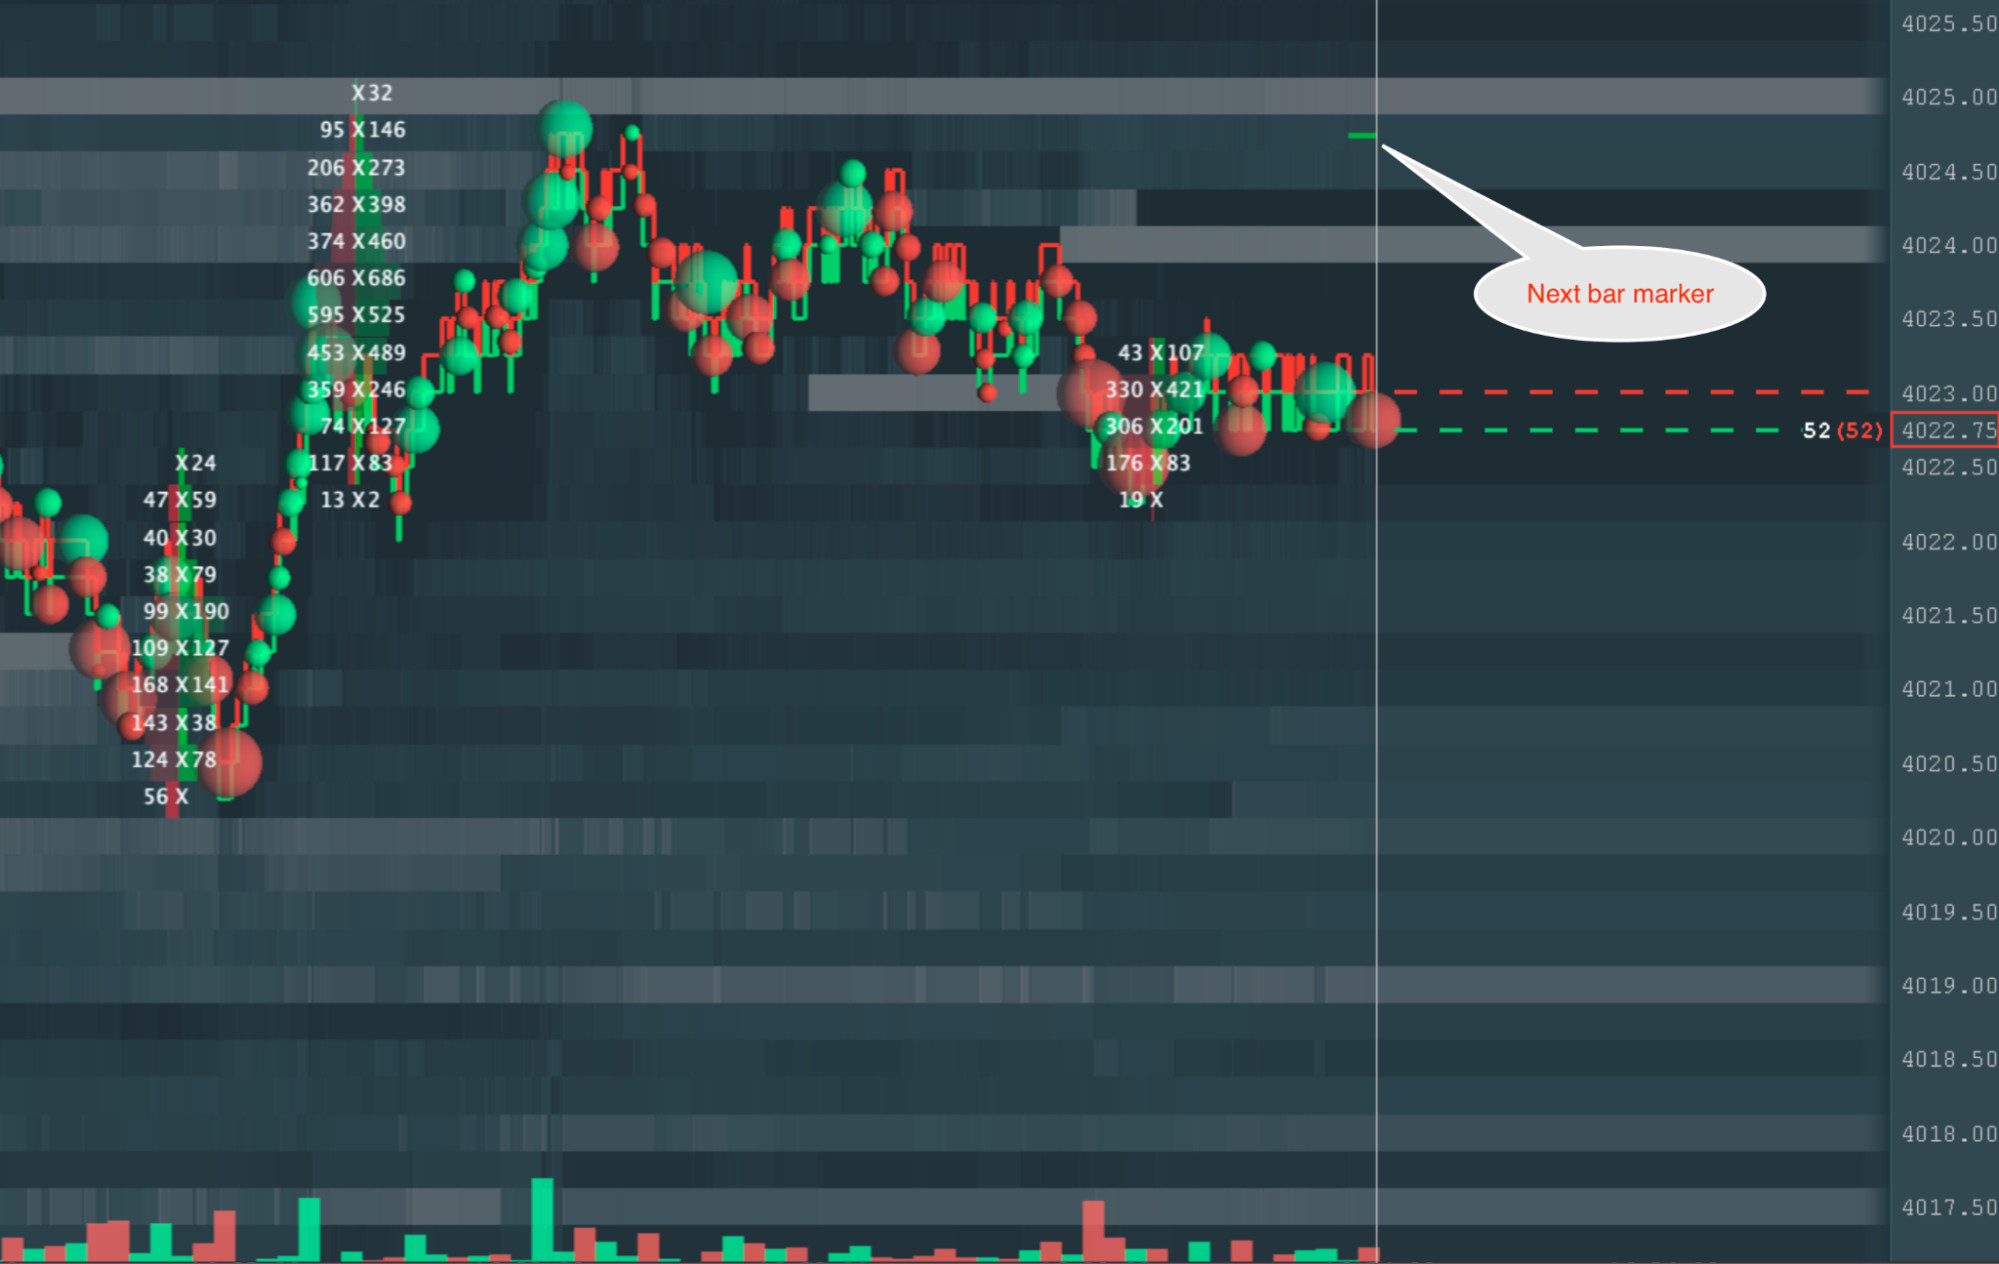
Reversal Bar forms a new bar when the price reverses a set number of ticks from its extremes. A small green/red icon on the timeline marks the price for the new bar. You can select the tick count to trigger a new bar formation (a positive round number).
On the heatmap, the configuration above displays like this:
Range Type
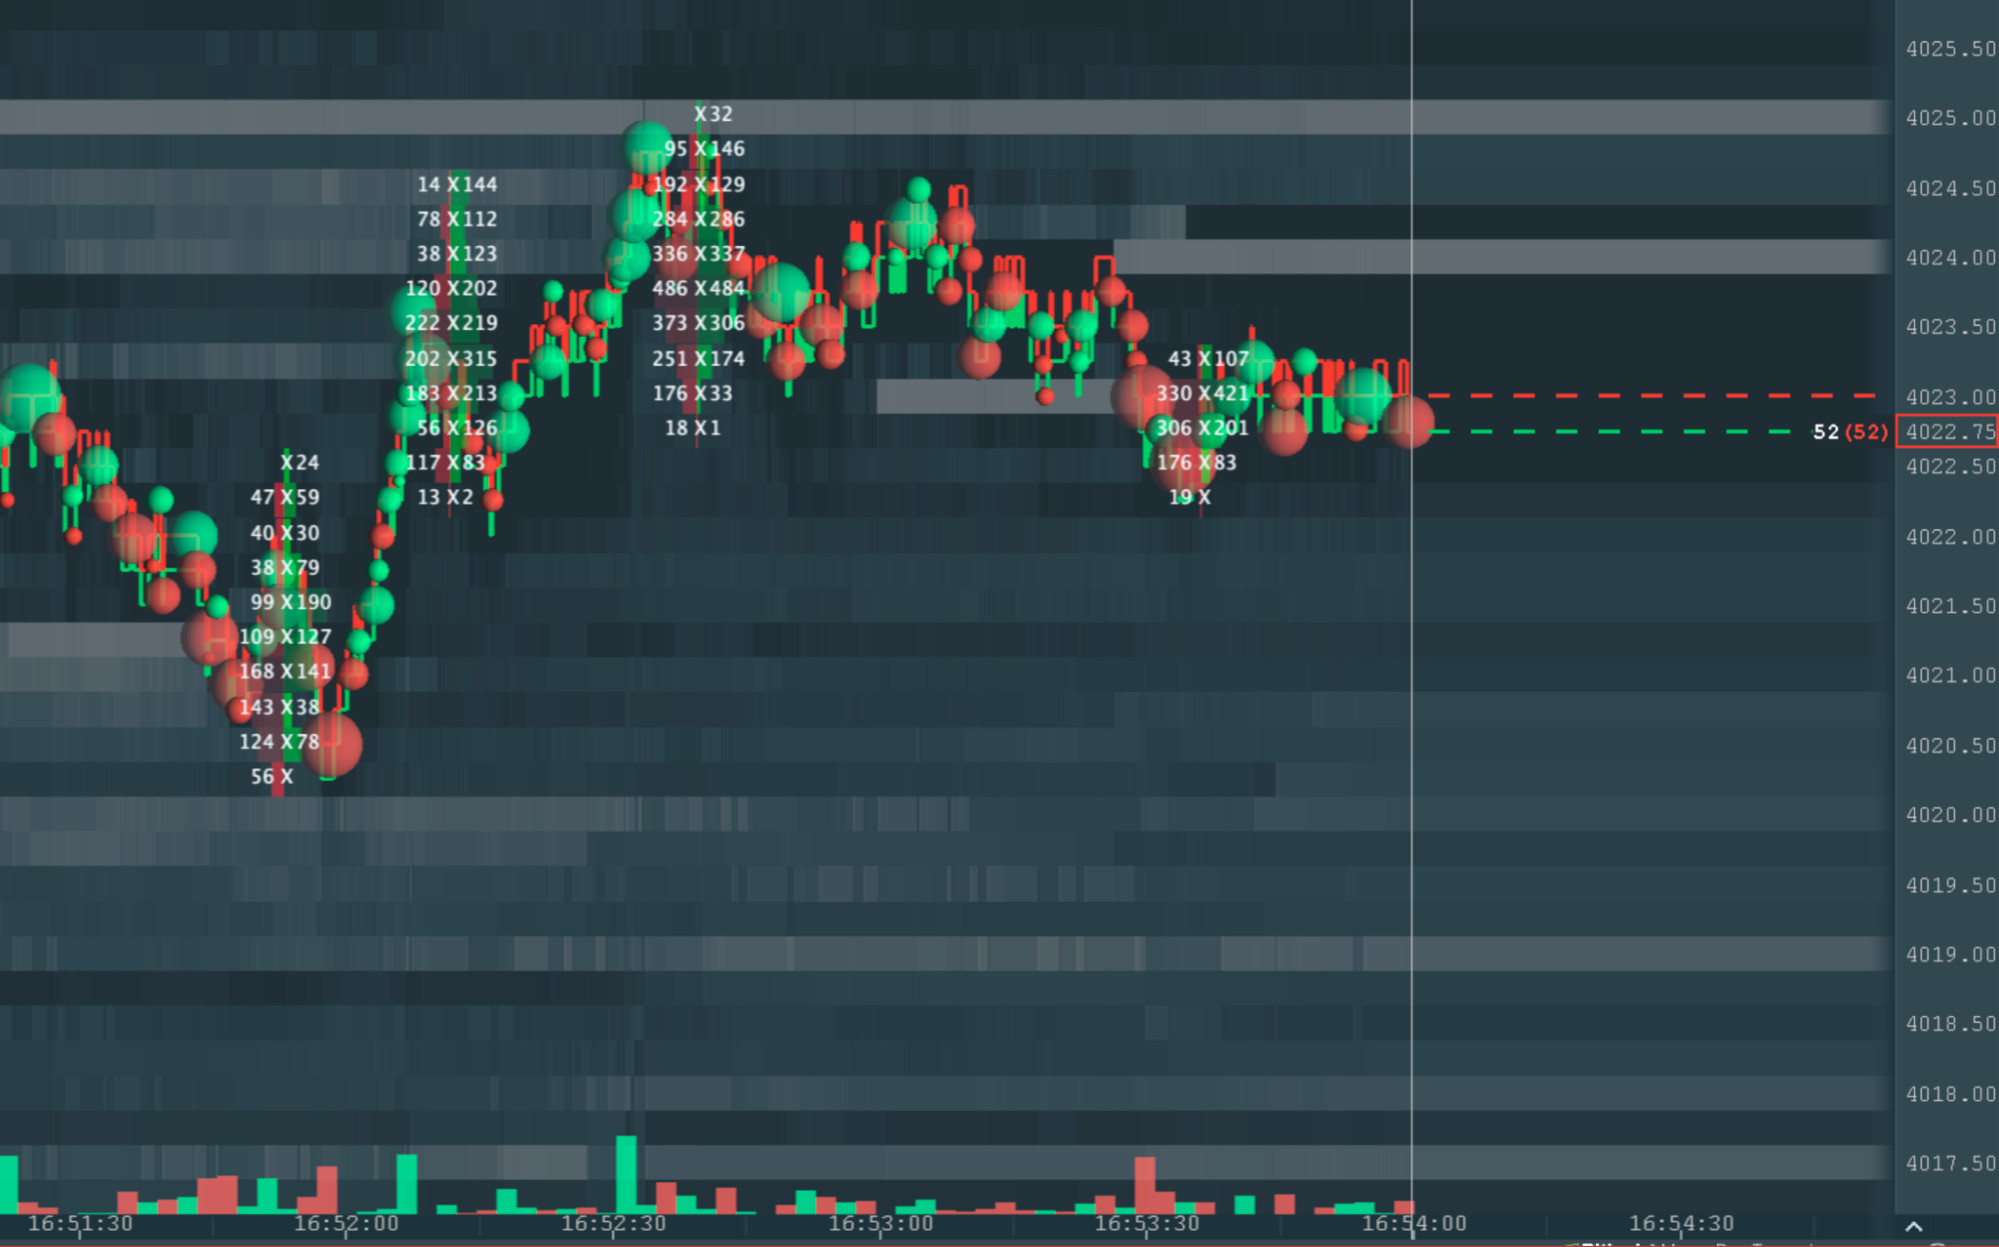
Range Bar sets a defined range, and a new bar forms if the price move exceeds this range. You need to specify the bar's range in ticks (a positive round number).
A 10-tick range bar is shown below:
Volume Type
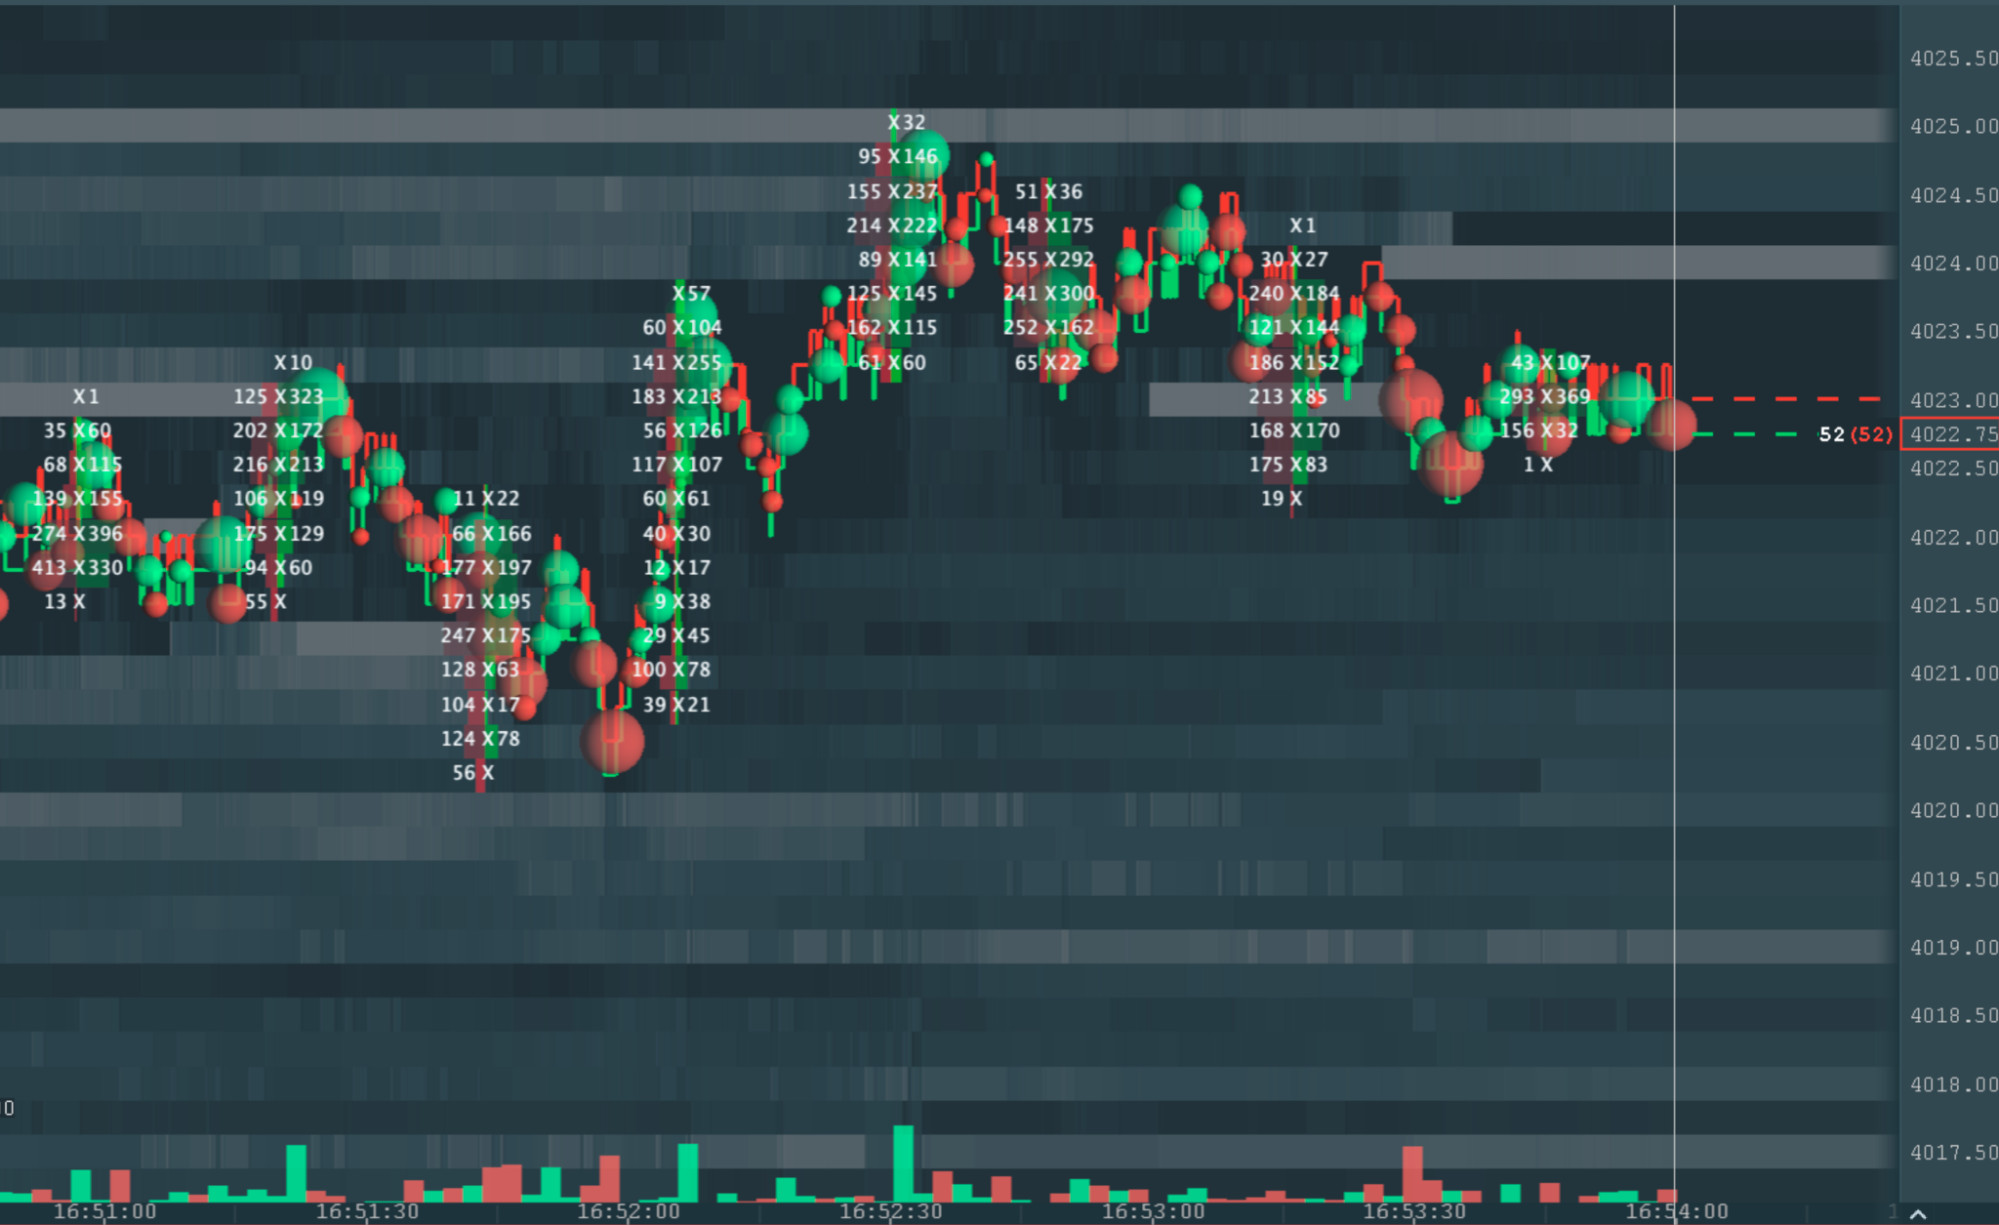
Volume Bar is based on a set traded volume. Once the volume surpasses this set limit, a new bar is created. You must define the volume for a new bar in a positive round number.
Here is an example of the above configuration:
Other Settings
The width of each bar (or footprint column) is adjustable, catering to personal visual preferences. Moreover, if the type permits, alignment can be chosen as either left or right. A delta bar with a 160 width is shown below.

A variety of background and foreground styles are offered by the indicator. The options are:
- None
- Histogram (based on sum volume)
- Histogram Delta +- (based on delta volume with coloured bars)
- Histogram Diagonal Delta +- (based on diagonal delta volume with 2 sided coloured bars)
- Histogram BS (buy / sell volume with 2 sided coloured bars)
- Full Background Single Colour (single colour background for visibility)
- Full Background Delta +- (background based on delta volume with +- colour).
The background positive and negative colours can be configured freely, their transparency can be configured numerically and shades can be used instead of single colours to indicate weight. If the background type is a histogram type, it can also be left or right aligned.
AutoScaling
The Vertical Smart Scaling feature supports tick aggregation for all Footprint bar type. When the vertical scale is zoomed (the price axis), the Footprint automatically changes the tick aggregation and merges the price level together for better visibility.
In case of "Time Interval"; Footprint bar type, even horizontal (time axis), autoscaling can be used. If enabled, the Footprint Interval changes automatically to an Interval that can be displayed on the screen. (ex.: when zoomed out, 30 minutes footprints will be displayed, when zoomed in, 30 seconds)
Bar Statistics
Bar statistics can be displayed for the bottom of the chart. Not only to enable or disable the statistics and their legends, but it allows you to pick one by one which statistics should be displayed and the Offset of the statistic bars from the bottom of the chart:
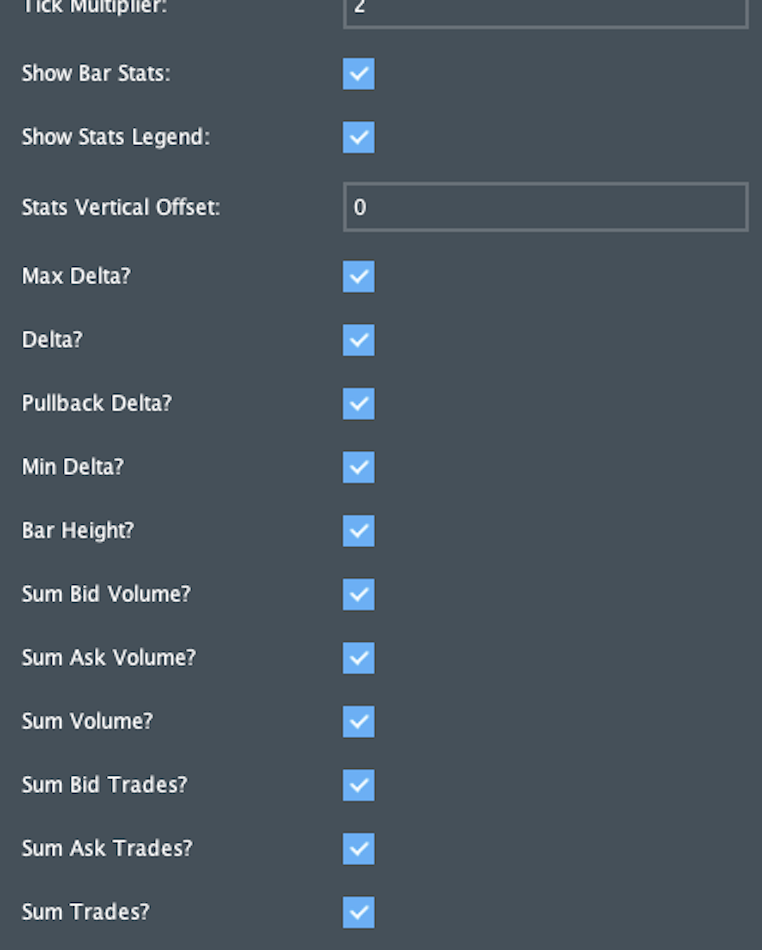
The statistics display:
Max Delta: The maximum delta of the bid and ask volume of the bar
Delta: The current difference of the bid and ask volume
Pullback Delta: The difference of the delta from the last extreme delta (retracement from the most recent max delta or min delta)
Min Delta: The Minimum delta of the bid and ask volume
Bar Height: The bar height in ticks
Sum Bid Volume: The sum of the bid volume
Sum Ask Volume: The sum of the ask volume
Sum Volume: The total volume
Sum Bid Trades: Sum of the bid trades
Sum Ask Trades: Sum of the ask trades
Sum Trade: Sum of all trades
Consider this setup:
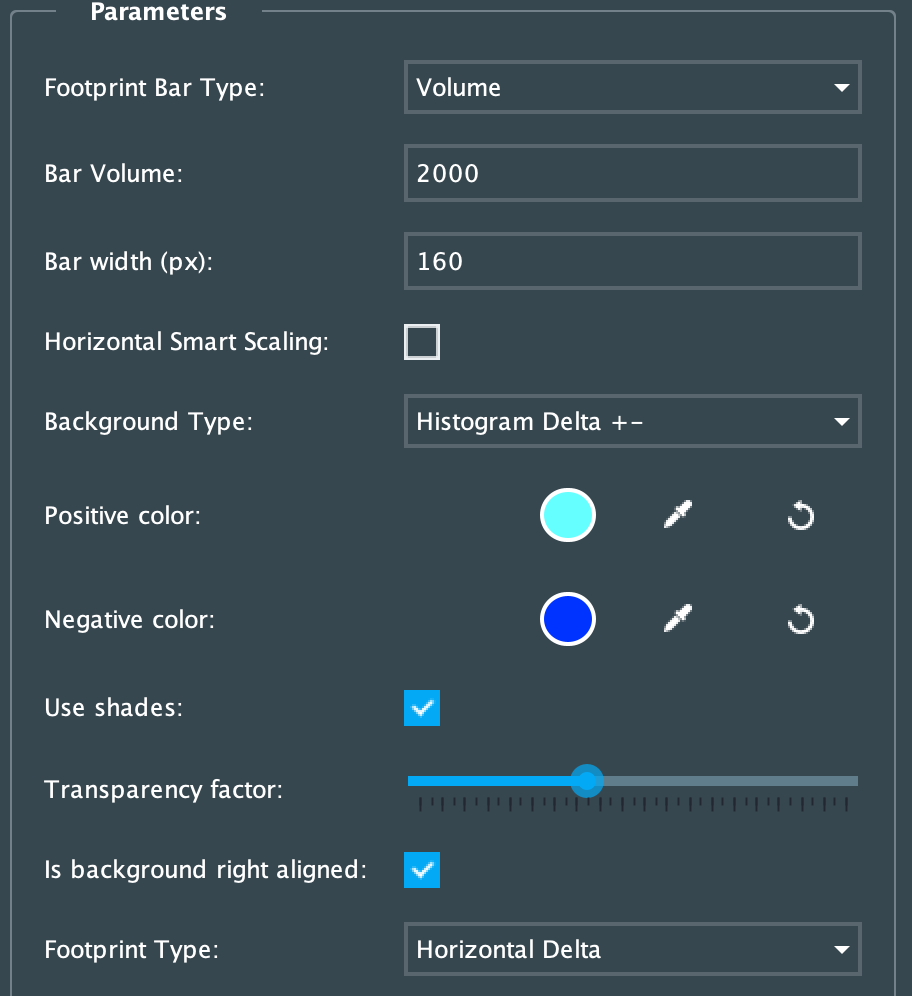
It translates visually to:
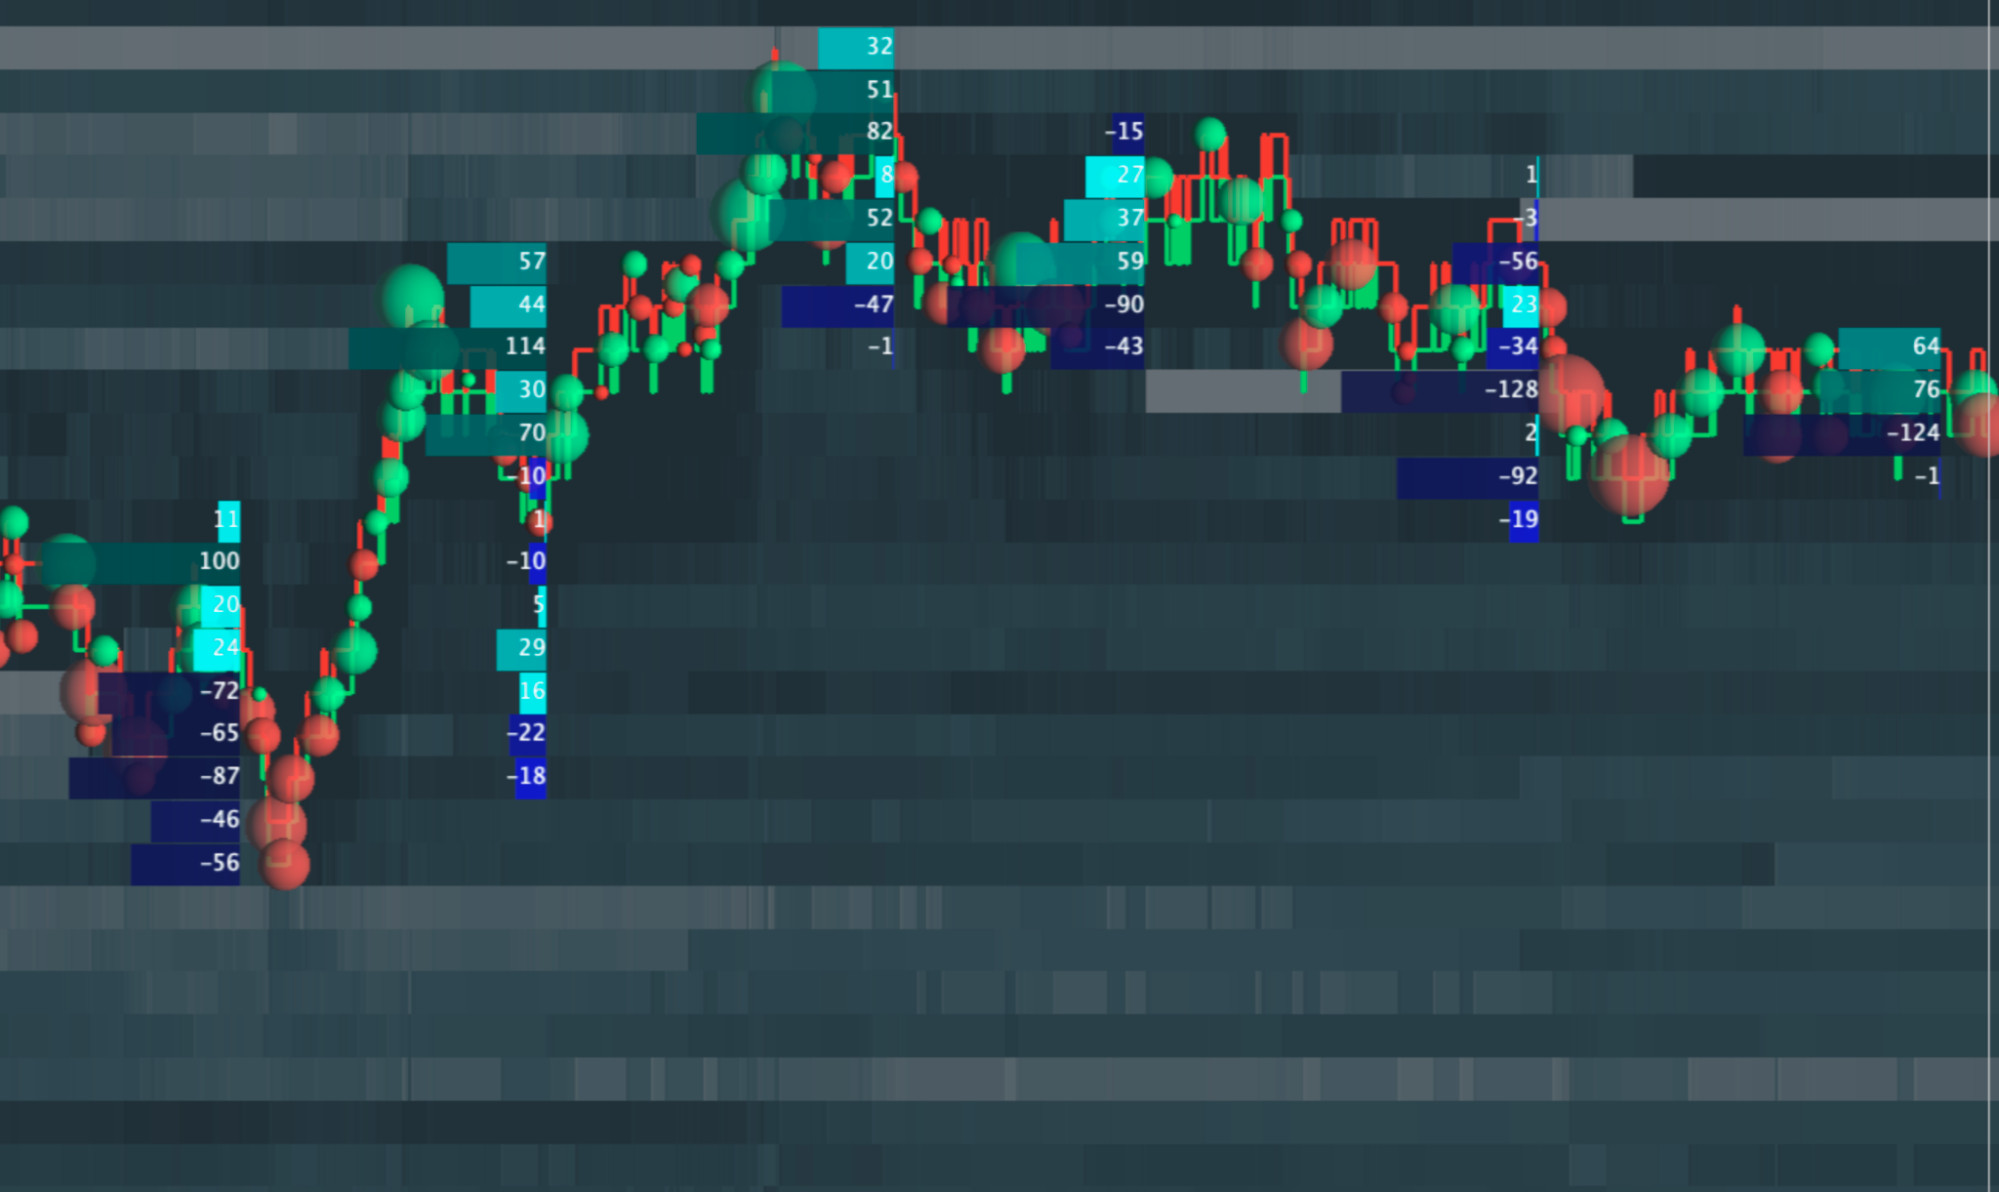
For the Footprint text, you have options such as:
- BxS (buy / sell volume with and x in between)
- Sum (sum volume)
- Horizontal Delta
- Diagonal delta.
Note: The background and foreground information are decoupled and can give you a double view on the volume.The text colour can be chosen separately for positive and negative numbers and the text can be hidden. If the type allows, it can be right aligned too.
Note: The Footprint text size auto scales and as soon as the font size falls below 7, it is not displayed anymore.You can even choose the tickbox not to display texts.
Here's another configuration for reference:

And its visual representation is:

Crypto markets can deliver different fraction formats, therefore prices might not be usable for building a footprint. The plugin offers a rounding feature for crypto markets to circumvent this problem:

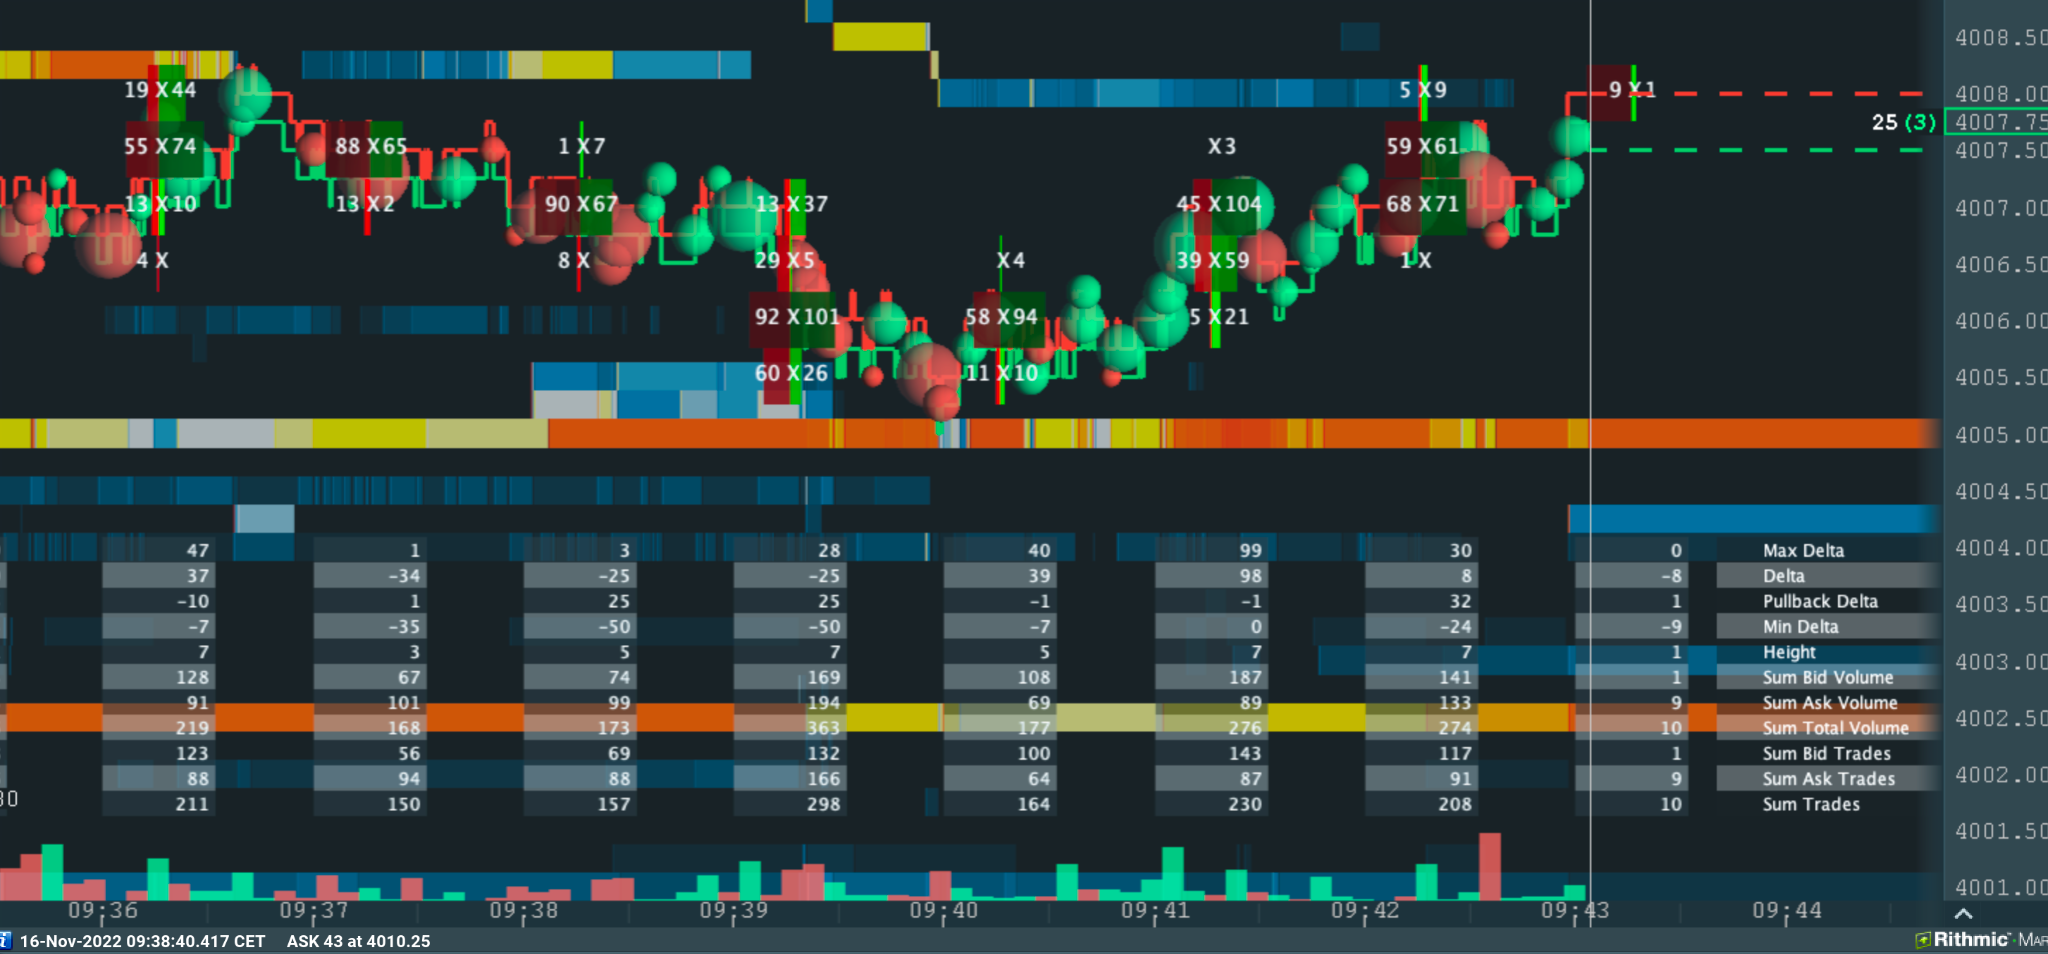
Statistics display for 1 minute bars:
Footprint Indicator – Additional Info & FAQs
Footprint Trading Indicator Software
Bookmap’s Footprint add-on offers several footprint bar types: time-based, reversal, range, and volume bars, designed for active traders who want to visualize order flow. It’s one of the few tools that merges footprint functionality with a live heatmap of liquidity.
Leading Footprint Chart Analysis Tools
While many trading platforms offer basic footprint bars, Bookmap overlays this data directly on its dynamic liquidity heatmap. This allows traders to see both executed volume and visible liquidity in one unified display.
Highest-Rated Order Flow Footprint Indicators
Traders consistently rank Bookmap’s footprint add-on highly due to its real-time responsiveness, bar customization options, and the way it integrates with bid/ask liquidity tracking. It’s especially popular among futures and crypto traders.
How to Interpret a Footprint Chart Indicator for Market Reversals?
Look for shifts in delta volume and pullback delta after a strong directional move. For example, decreasing delta or shrinking green bubbles into resistance may suggest buyer exhaustion, potentially signaling a reversal.
What’s the Difference Between Footprint Charts and Traditional Volume Profile?
Footprint charts show how volume transacts (aggressively or passively), while volume profile shows where volume is concentrated. Bookmap supports both via volume bubbles and replayable heatmaps that offer real-time and historical views.
Can Beginners Effectively Use Footprint Charts for Day Trading?
Yes, but it’s best to start with a simple bar type (e.g., Time Interval) and gradually explore delta or diagonal delta overlays. Bookmap’s visual interface makes it easier to interpret than raw number-based platforms.
What Are the Best Strategies for Trading With Footprint Chart Indicators?
Footprint indicators are often used to confirm breakouts, identify trapped traders, or detect aggressive volume shifts. Combining them with visible liquidity and heatmap changes, as in Bookmap, can strengthen entry/exit decisions.
Advanced Order Flow Analysis Platforms
Bookmap is considered an advanced order flow platform because it not only shows trades and volume, but how they interact with order book liquidity. This offers traders a deeper understanding of market microstructure.
Professional Technical Indicators for Market Microstructure
Features like pullback delta, diagonal delta, and bar-based statistics give insight into momentum shifts and imbalance behavior, critical for traders operating within short timeframes or volatile markets.
Volume-Based Trading Strategy Software
Volume bars, delta overlays, and customizable statistics in the Bookmap Footprint add-on help traders execute volume-based strategies with precision. You can visualize large player activity in real time.
Bid/Ask Footprint Chart for Futures Trading
Bookmap’s Footprint can be configured to display bid vs ask volume at each price level, especially useful for futures traders trying to interpret execution aggression and potential absorption zones.
Real-Time Footprint Charts for Scalping
The add-on supports short timeframes (30s bars or small range bars) and real-time updates, making it ideal for scalpers who need to act on second-to-second shifts in delta, volume, or liquidity.
Footprint Chart Tools With Liquidity Heatmaps, Like Bookmap
Bookmap’s standout feature is that it blends real-time footprint bars with a full-depth historical heatmap. This combination shows both trade execution and the evolving liquidity landscape.
Footprint Indicators for Crypto Markets
Due to crypto's unique tick structures and fractional prices, Bookmap includes rounding settings to normalize data for footprint display. This allows meaningful order flow analysis across major crypto pairs.
Are You Focused on a Particular Asset Class Like Futures, Stocks, or Crypto?
Bookmap’s Footprint works across asset classes, but setup options may vary depending on the market structure (e.g., rounding needed for crypto). Choose your bar type and settings accordingly.
Which Trading Platform Do You Plan to Use This On?
This footprint indicator is designed specifically for use within Bookmap. It integrates seamlessly with Bookmap’s heatmap and volume tools to provide a unified view of order flow and liquidity.
Do You Prefer Bid/Ask, Delta, or Volume-Based Footprint Charts for Your Analysis?
All major styles are supported. You can use delta, sum volume, or bid/ask separation, and customize how it appears (histogram, background color, or text overlay).
Are You Looking for Tools That Offer Historical Market Replay for Practice, As Seen in Bookmap?
Yes, Bookmap includes a robust market replay mode. You can pause, slow down, or fast-forward the market and see how the footprint and liquidity interacted in real time, ideal for training or review.
What Traders Are Saying About Bookmap
Want to see how other traders are using Bookmap and its footprint tools? Check out real reviews from active users:
Why can’t I see the Footprint when I pause in replay mode?
For performance reasons, Footprint draws only when a replay is playing.
Have Footprint questions?
Visit our forum thread: https://bookmap.com/forum/viewtopic.php?f=59&t=3582.
Known issues
Sometimes when "Show bar stats" feature is enabled statistics bars on the bottom of the chart may disappear or display zero values.
Workaround: disable the addon and enable it back to restore the functionality.
We are going to fix the above issues in the future, until then you may use the described workarounds.
Installation
This add-on takes advantage of the new Add-ons Manager feature, which simplifies both the installation and updating process. If you'd like to learn more about the Add-ons Manager and how it can benefit your experience, please visit the following page.