Traded Volume Visualization

Volume Bubbles (Volume Dots)
Application
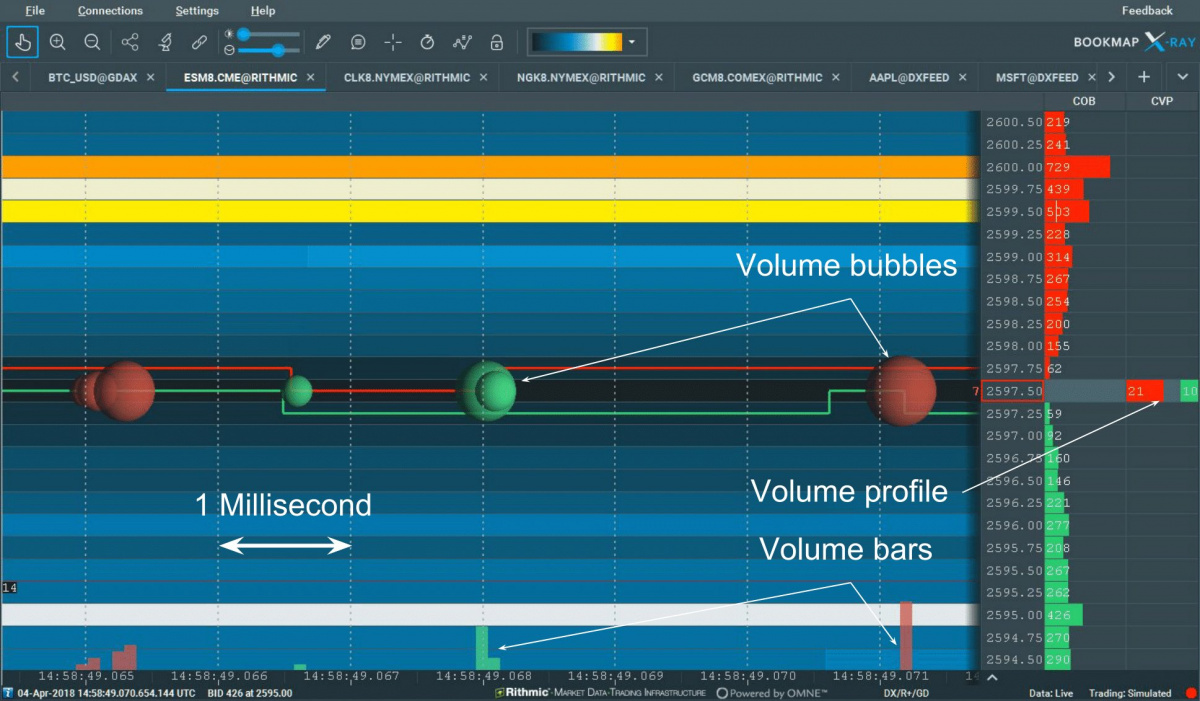
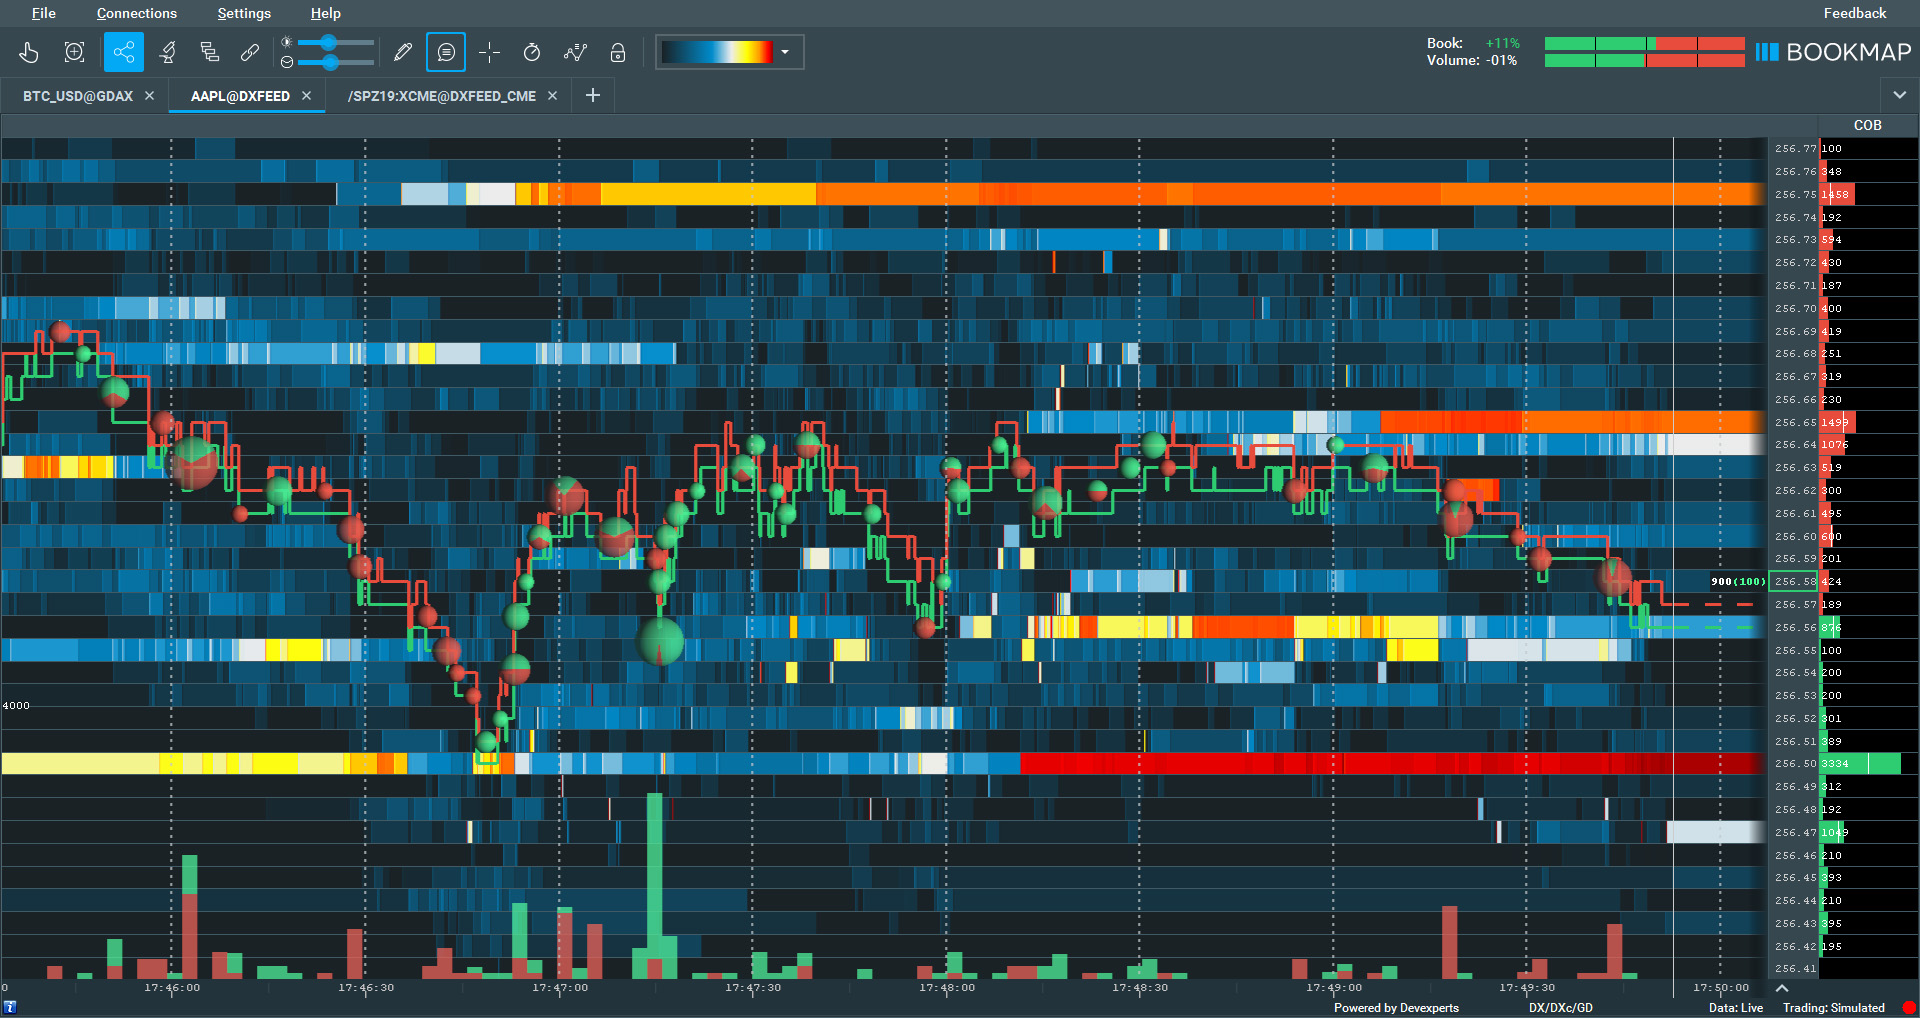
Bookmap uses volume bubbles (or volume dots) to visually represent traded volume. Each bubble represents the aggregate volume that has been executed during a time period that is equivalent to a single-pixel slice. The timeframe represented by a pixel varies based on your zoom level on the Bookmap chart. A zoomed-in view correlates to a shorter pixel timeframe, and vice versa.
Volume bubble sizes are influenced by both user settings and a specific algorithm. This algorithm scales the volume of trades at a particular pixel-time against the instrument's average trade volume.
Interpretation
Volume bubbles provide insights into trade volumes at precise times and prices, highlighting which side (buyers or sellers) was aggressive. The central point of the dot pinpoints the exact time (X-axis) and the Volume Weighted Average Price (VWAP) for that period (Y-axis).
The dot's color indicates the aggressor, which is set on a gradient scale of two configurable colours representing buyers and sellers. A stronger colour represents a more aggressive action by the side associated with that colour. Users can assign the colours they want for buyers and sellers. See Colour Settings for more information.
Settings
To display or hide volume bubbles, click the studies icon above the chart and check the volume bubbles option on the studies panel.
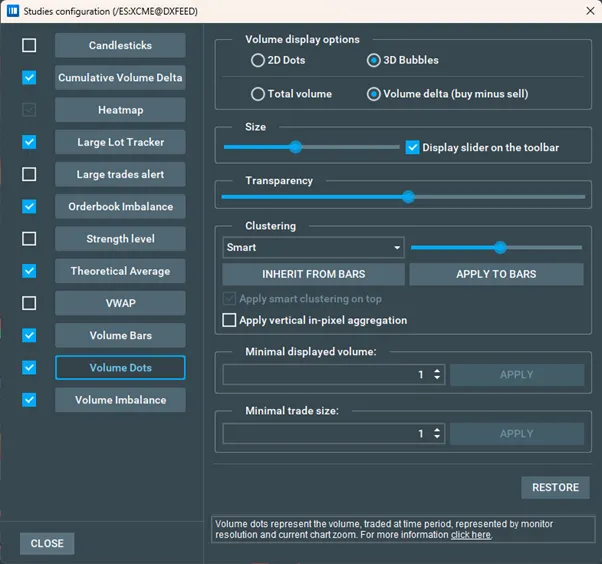
Volume Dots Configuration Panel

Minimal Trade Size Settings
The Minimal Trade Size displays each transaction for the precise input amount. For instance, at a setting of 100, a volume dot appears for a 100 share/lot trade, but not for 90 shares/lots.
The Minimal Displayed Volume reveals rapid and multiple transactions. Rather than one 100-lot trade, it might be 100 one-lot trades, common in HFT settings. If set to 100, it shows when 100 lots trade quickly within a single pixel's duration on the chart. The display adjusts with zoom; zooming in may hide the dot if trades span more than a pixel, but zooming out will show it if they're within that pixel's time.
Various settings can be accessed from the studies panel when clicking the Volume Bubble item:
-
Minimum accountable dot volume: The aggregate volume threshold to display a dot.
-
Dot size: Adjusts the scaling of volume dots.
-
Transparency: Sets the opacity of the dots.
-
Volume Dots Drawing Type: Defines how the classification of aggressor side is to be indicated on the dot.
- Gradient: Shows the relative size of the aggressor side (buy and sell) as a scale of 2 colors representing buyers and sellers.
- Solid: Displays the relative size of the buy and sell aggressor trades as a split of 2 solid colors.
- Pie: Displays the relative size of the buy and sell aggressive orders as a split pie.
-
Volume Display Option
- Bubbles can be 2D or 3D.
- They can represent total traded volume per dot or the difference between aggressive and passive trade volume (delta).
-
Dot Clustering
Defines whether dots are clustered or not and the method of clustering. There are several clustering methods:
- Smart: Using an internal algorithm, Bookmap aggregates together several adjacent or overlapping dots into a single displayed dot. This dot is positioned on the chart based on the weighted averages of the trades’ prices and execution time. Use the slider to define the level of aggregation.
- By time: Bookmap will paint a volume dot every configurable period of time.
- By volume: Bookmap will create a volume bubble whenever the volume of traded contracts reaches the volume defined by the user. Thus, volume dots will have a similar size but they will appear at different frequencies (intervals) depending on market activity. Note that the volume dot can represent more contracts traded than the configured number in cases where the last trade exceeds the configured volume size. For example, if the configured volume size is 100 and there are several trades with the volumes 20, 15, 35 and 270, the aggregated volume dot will show the volume of 300 and leftover volume 40 will be included into the next volume dot.
- By price: With this clustering method, all of the volume traded at the same price level is aggregated until volume starts trading at a different price level.
- By price and aggressor: With this clustering method, all of the volume traded at the same price level is aggregated until the aggressor side changes.
Click ‘Apply to Bars’ to apply the volume dots clustering method to volume bars. Click ‘Inherit from Bars’ to align the volume dots clustering with the volume bars’ setting.
‘Apply vertical in-pixel aggregation’ enables aggregation of data points that align vertically by sharing the same horizontal coordinate, similar to the method used in previous versions of Bookmap. This groups data more compactly along the vertical axis for analysis.
Volume Bars
Application
Bookmap displays transacted volume using volume bars painted on the lower part of the heatmap. Each bar reflects the aggregate volume executed within its pixel width’s time span. This duration adjusts according to the bar’s pixel width and the chart’s zoom level: a more zoomed-in view shortens the time represented by each pixel and vice versa.

Interpretation
Users can interpret volume bars to discern the relative execution sizes and the more aggressive side during transactions. The aggressor's identity is indicated by the bar's colour, set on a gradient scale of two adjustable colours for buyers and sellers.
A stronger colour signifies greater aggression from that side. Users can customize these colours. Refer to the Colour Settings for details.
Settings
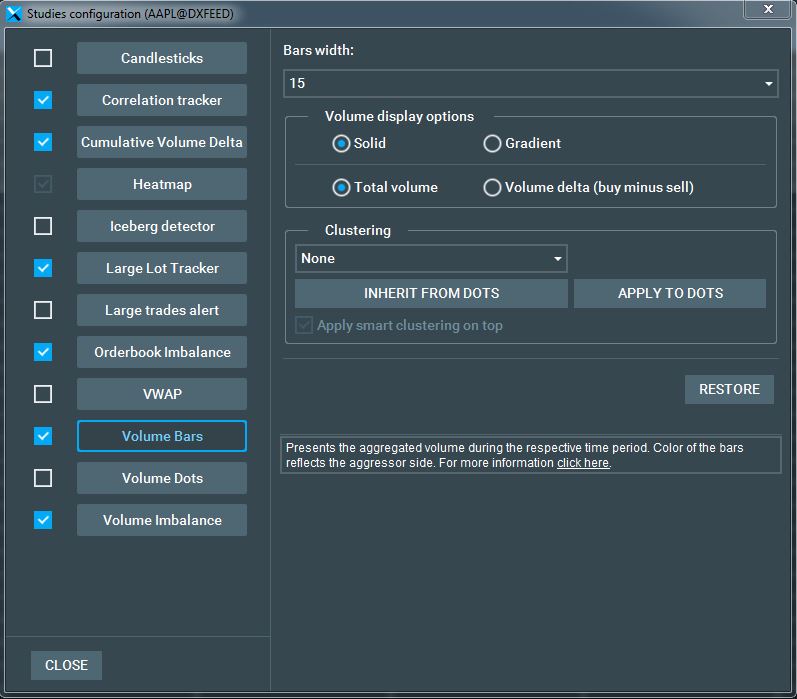
By default, the Bars Width is set at one pixel. To adjust the width up to 15 pixels, navigate to the settings window on the studies panel.
Volume Bars Drawing Type: Defines how the classification of the aggressor side will be indicated on the volume bar.
- Gradient: Displays the aggressor side's relative size (buy and sell) by blending the two colours for buyers and sellers.
- Solid: Shows the buy and sell aggressor relative sizes using two distinct solid colours.
Bars Clustering: It defines whether volume bars are clustered or not and the method of clustering. There are 3 methods:
- Smart: Bookmap uses its algorithm to merge multiple adjacent bars into one, placed at the time-weighted average of trades.
- Volume: A volume bar is painted for every preset number of traded contracts. However, if the last trade surpasses the set volume, the bar may display a larger count. For instance, with a set size of 100, a bar with two consecutive trades of 50 and 100 will display 150 contracts and not 100.
- Time: A volume bar is created at every configurable time interval.
- Aggregation by Price: Volume traded at the same price is aggregated until trading shifts to a different price. During paused chart views and zoom-ins, aggregated dots might not show in their initial positions.
To apply volume bar clustering settings to volume dots, click Apply to Dots. Alternatively, to synchronize the clustering setting of volume bars with volume dots, click Inherit from Dots.
Adjust the volume bar display height by hovering over the volume bar area and dragging the red line. The number on the right indicates the max volume bar value within the shown range.

