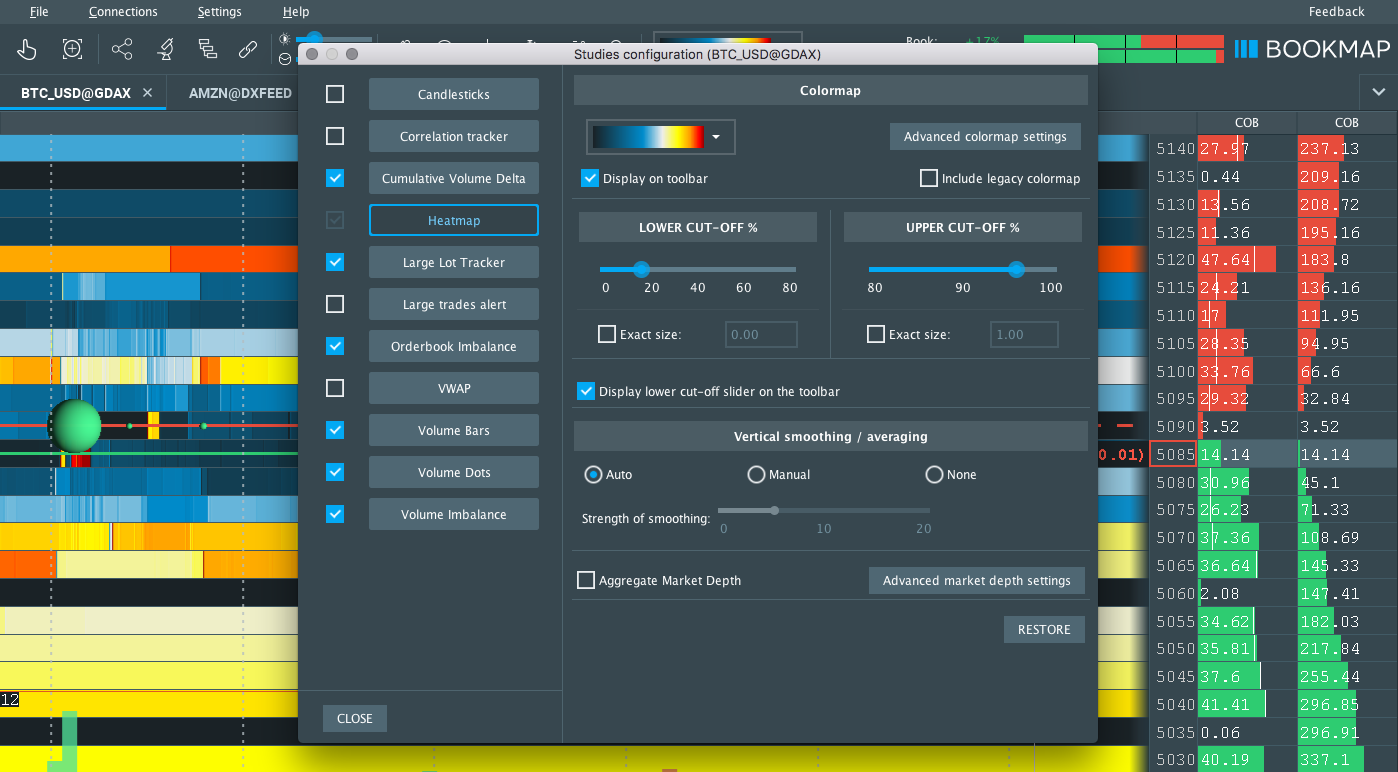
Studies configuration
Studies configuration
Open the Studies window to set up key chart elements like Candlesticks, CVD, Heatmap, VWAP, Volume Dots, and more.

Configure Add-ons
You can install any Bookmap addon as follows:
-
Open the Bookmap platform and go under Settings > Configure Addons > Manage Addons
-
On the new window opened, scroll down to the available for install section and click the "Install" button next to the relevant addon you want to install.
-
After installing, just close the window and under the "Configure addons" window find the newly installed addons on the list and check the box to activate them on your chart.
If you can't find the addon you are looking to install in the Addons Manager, it means that it's a 3rd party addon. You can install any 3rd party addon into Bookmap as follows:
- Go to your Bookmap Marketplace account here and download the relevant jar files for the addon
- Open the Bookmap platform and go under Settings > Configure Addons > Add and find the downloaded jar files
- Double click on the jar files and click Load on the popup window to load them onto Bookmap
- Check the box next to the loaded addon to enable it on the Bookmap chart/subchart
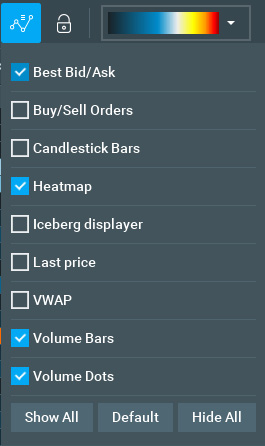
Configure Visible Components
- Use the Information Bar at the bottom of the chart to view order data. Hover over a specific time and price to see the number of pending orders.
- Hover over a volume dot to see the transaction volume. Ensure your cursor is centered on the dot to view the VWAP for that transaction.

- Show/Hide the trade control panel. When enabled, the panel appears to the left of the main chart.
