Trading Statistics
What is the Trading Statistics add-on?
The Trading Statistics add-on is a crucial component of any trader's toolkit. Significantly improving your trading performance, the Trading Statistics add-on exposes ineffective trade executions and offers valuable insights into order placement strategy.
To do this, Trading Statistics provides valuable information about a trade's current state, including its entry price, profit and loss, and the potential outcomes based on market movement using post trade exit analysis.
With real-time information about these variables traders can make data-driven decisions to adjust orders, manage risk effectively, and ultimately maximise profits.
Additionally, the tool can also provide insights into market conditions, helping traders identify suboptimal behaviour patterns and trends in their execution of any trade opportunities. By effectively utilising the Trade Stats add-on, traders can enhance their overall trading strategies, helping traders make better decisions on actual execution data and “expectancy”, leading to more profitable trades.
How the Trading Statistics add-on works?
Upon start, the add-on opens one separate window per instrument where it has been activated, and each window contains 2 sets of data:
- Global data: displays the accumulated data of all positions and other information such as Pnl, % of wins/losses, and quantity of orders filled/cancelled.
- Position data: displays position specific data and starts collecting at the position start time.
Once a position starts, the add-on will update the Global values and will create a new line at the bottom table, and while the position is open the values will update as shown below:

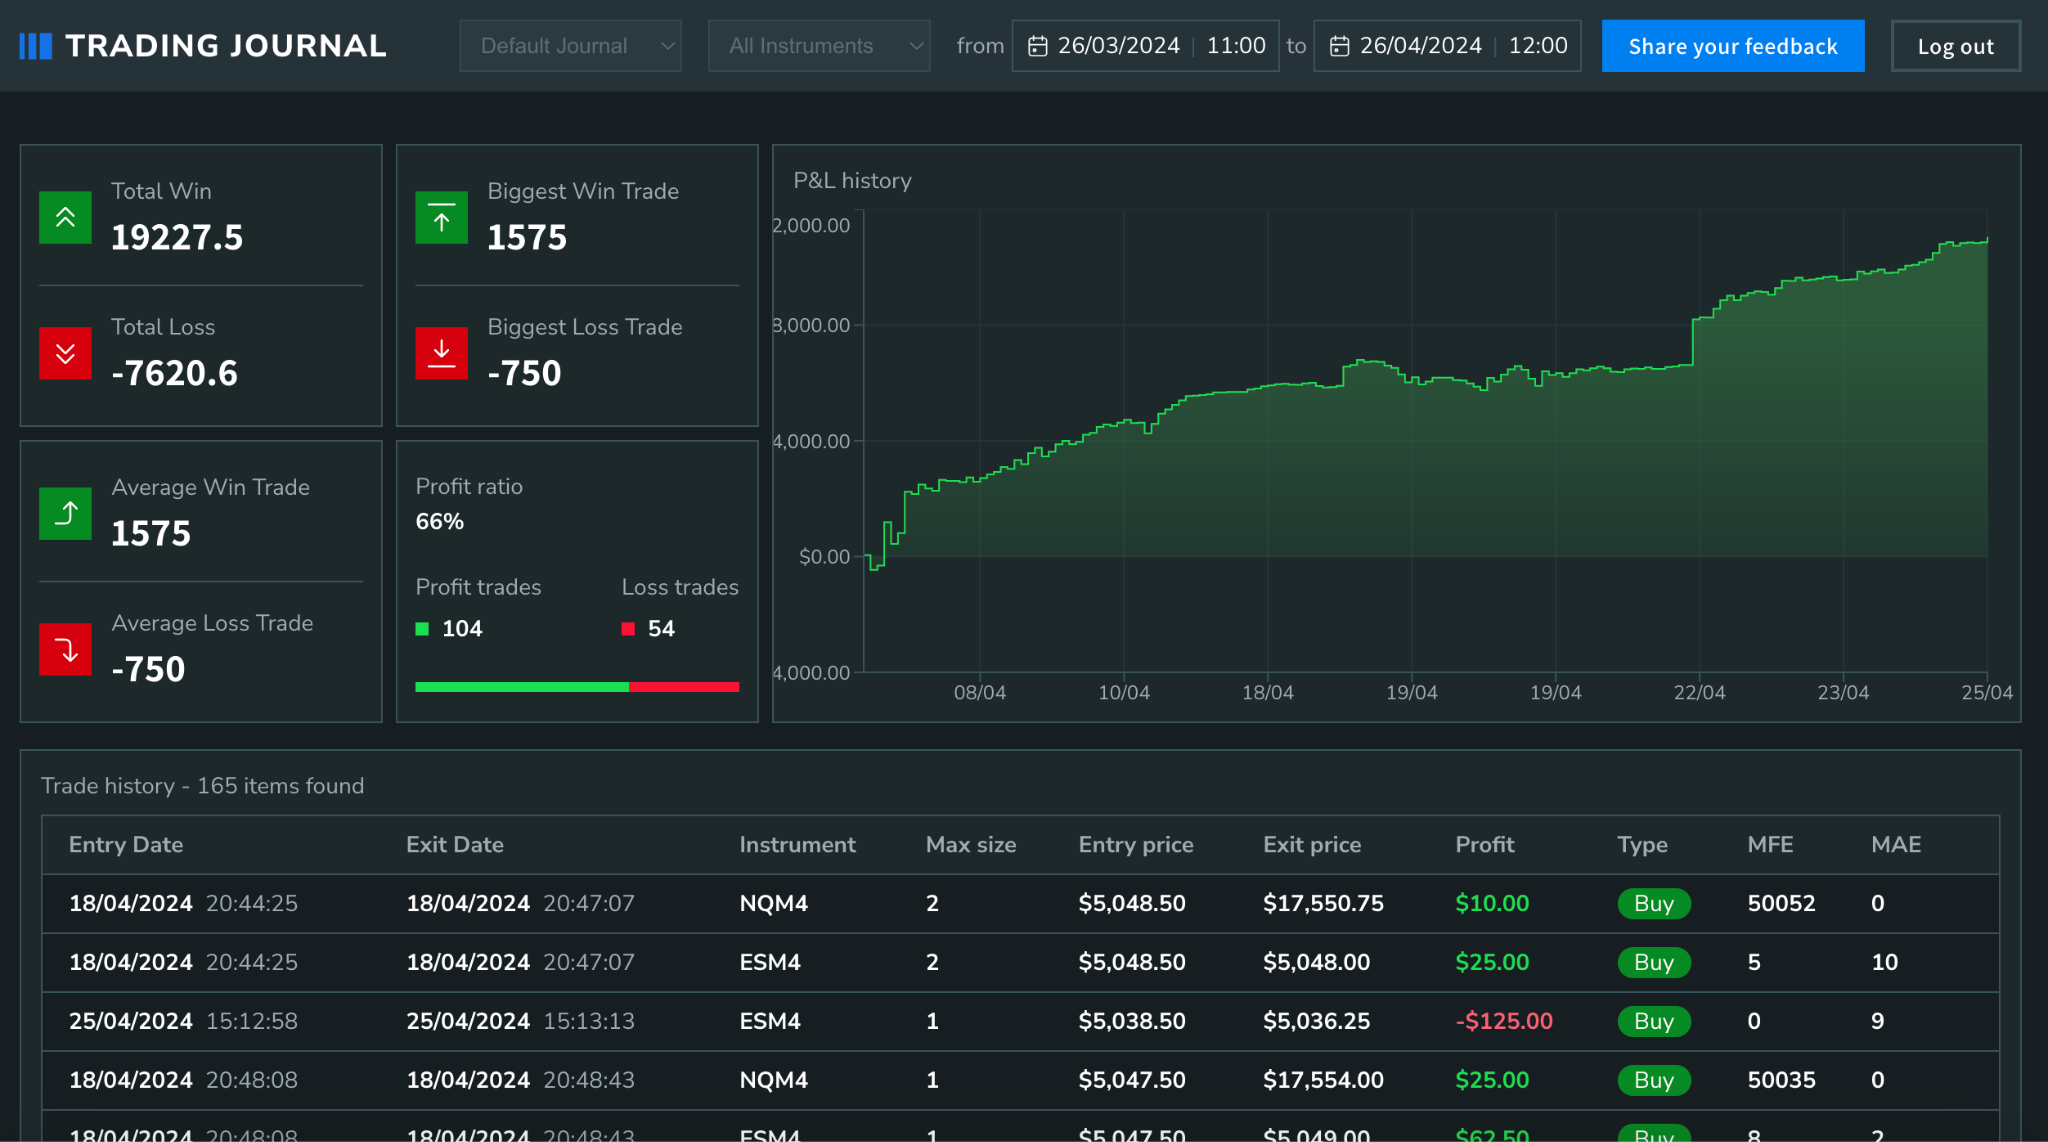
Most of these stats will be sent to the web server that will store all the trades you completed while the trading statistics add-on was active. Below you can find the guide on how to configure your add-on, so your statistics correctly upload to a web server.
When you successfully set up the add-on, you can open journal.bookmap.com, log in or register with your Bookmap license key and see your trades from your browser.

Columns and collected data
-
Global Data:
- Pnl: total calculated PNL of all closed position PID trades
- Open PnL: total ongoing hypothetical PnL of the current open position.
- Max PnL: Maximum positive PnL reached during the session (realized PnL plus open PnL).
- Ticks: total ongoing hypothetical ticks of the current open position. The add-on then displays the total once all positions are closed
- Commission: total commission paid. * Requires Breakeven Point integration - see below.
- Total: calculates the total closed trades on that symbol, regardless of contracts traded
- Volume: total number of transactions
- Buys: total buy long direction trades
- Sells: total sell short direction trades
- Wins: quantity of winning trades
- Win %: percentage of winning trades out of the total trades
- Losses: quantity of losing trades
- Loss %: percentage of losing trades out of the total trades
- Scratch: trade’s exit price was the same as the fill price (trade profit was 0)
- Orders Cancelled: total orders that were submitted and then pulled without being filled
-
Position Data:
- PID (Position ID): position/trade number calculated from when the position 0 first changes to when that specific position is closed, regardless of if the trade’s position changed and had executions that were added/scale in or exited/scale out.
- Symbol: instrument name
- Avg Price: calculates all entries added/scaled in against all exits exited/scale outs . When connected to the Breakeven Point add-on this value will be the Breakeven Price.
- LTP: Last Traded Price
- Entry Time: Time when the trade position 0 changed using the fill time from CME as reported from Rithmic/CQG
- Exit Time: Time when the trade position returned to 0 using the fill time from CME as reported from Rithmic/CQG
- Total Time: calculates total time of the trade from when the position was not 0 and returned to 0
- Max Price: highest price the particular symbol’s price reached after a fill was confirmed
- Min Price: lowest price the particular symbol’s price reached after a fill was confirmed
- Max Size: maximum size of the position of the particular trade
- Fills: total fills achieved, calculated by accumulating all entries and all exits
- Last Bid: last bid price traded
- Last Ask: last ask price traded
- PnL: calculates the current open trade’s profit (unrealized PnL). Then displays the trade’s actual PnL once the position is closed.
- Running PnL: calculates the current running PnL which is the PnL from the position start plus the open PnL.
- Commission: total commission paid in the position. * Requires Breakeven Point integration - see below.
- Ticks: calculates the current open trade’s live hypothetical tick value, should the exit order fill at the Last Bid or Last Ask. Then displays the trade’s actual resulting tick value once the trade position is closed.
- Type: calculates the trade’s direction based on the net difference between the number of buy trades (on the ask) and sell trades (on the bid) executed
- MAE: Maximum Adverse Excursion - measures the maximum potential loss incurred during a trade before the trade is closed (the difference between the entry price and the lowest/highest market price during the trade)
- MFE: Maximum Favourable Excursion - measures the maximum potential profit gained during a trade before the trade is closed
- MAE Post: Maximum Adverse Excursion hypothetically achieved, had the position not been closed until a specified time after it was closed.
- MFE Post: Maximum Favourable Excursion hypothetically achieved, had the position not been closed until a specified time after it was opened.
- LTP Post: Last traded price achieved at the post-trade exit time
- Notes: a column to add small notes related to the trade. Maximum of 15 characters.
- Mode: Displays the particular Bookmap trading Mode: Live/Simulation/Playback.
How do the post trade columns work?
Post trade columns record your post trade exit execution time, and calculate a hypothetical or potential post exit maximum gain and maximum loss (subject to certain rules), all on a per-trade basis.
Though this can be used just to calculate a theoretical profit and loss exit analysis on a per-trade basis, it also has a variety of other helpful applications.
With user-defined time settings that trigger after the trade position is closed, the add-on begins to record at various user-defined time intervals an extremely useful “what if” maximum favourable and maximum adverse excursion against the last trade price. With this feature, traders can perform a quick, on the fly analysis, giving them an edge intrading and execution live while trading.
This can also be implemented at the end of day after trading with an Excel csv for further in-depth and detailed analysis using machine learning tools, soon to be widely available to traders of all levels and experience. This can significantly accelerate a trader’s learning curve and rapidly enhance their research capability.
Synopsis: Using one of your setups (enter the setup name in the notes column), so long as you can consistently execute manually or use algorithmically generated orders, once the setups/trades are exited you are provided with a live post-trade MAE/MFE result in ticks.
This allows you to analyse the timing efficiency of the exit criteria as well as make timing or awareness adjustments, improving exits both to potentially improve profit, or to decrease losses on following trade setups.
Example A: A trade is exited and the market continues to move in a favourable direction. In the majority of trades the trader may notice that they are consistently leaving too many potential ticks on the table. This can reveal that a trader is not following their exit rules or system. Thus, with a quick execution or parameter adjustment to the setup, the trader can potentially improve the results in subsequent trades.
Example B: A trade is exited and the market continues to move against the position after the exit. In some of or possibly the majority of the trades, once exited either for profit or at a loss, they notice that after X seconds/minutes the market consistently moves in the opposite direction. This can reveal either that the trader is consistently trading in the wrong direction, or that there is a more favourable excursion in the opposite trade direction. In this case the trader can make adjustments to their trade direction realisation, or reverse the direction on the stop loss instead of simply exiting.
This can greatly improve the realisation of how traders can optimise the precision of their trade decisions, trade setups, or automated execution system parameters, potentially revealing greater advantages using real data instead of simple “gut feeling”.
How Do I Configure the Trading Statistics Add-on?
Web Trading Journal
After registration on https://journal.bookmap.com/ you may go back to your add-on and check the “Synchronise data to Web Journal” checkbox. After a small delay you should have the same window as shown below.
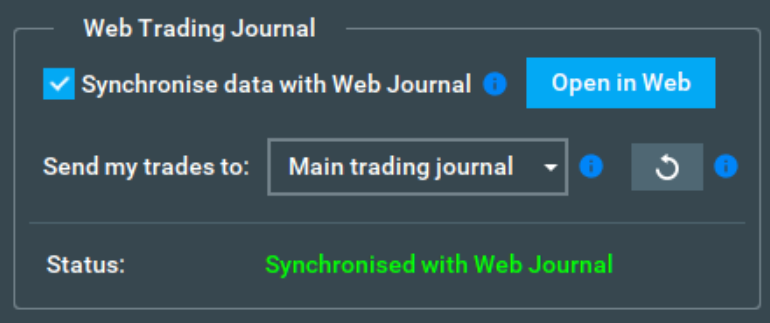
You can configure the add-on to send your data to a specific journal by specifying it from the “Send my trades to:” dropdown. The default journal is named “My first journal”. You can modify, delete or create new journals on the journal web page.
You can access your journals via https://journal.bookmap.com/, or simply click on the “Open in Web” button in the add-on’s configuration.
Also, in the Web Trading Journal, you can sort your statistics by one or multiple instruments, as well as by one or multiple journals. You just need to check those you want to see from the corresponding dropdowns that are located at the top of the page.
Main Settings
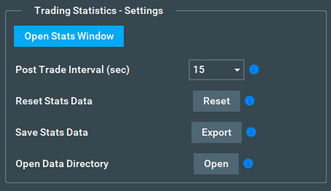
- Open Stats Window: Shows the trading statistics window
- Post Trade Interval(sec): Sets the interval with which the post position tracker will run, and once done it will update the MFE/MAE and LTP post position.
- Reset Data: Reset the table/collected data.
- Save Stats Data: Exports the current statistics data to a .csv file.
- Open Data Directory: Opens the default location where the add-on stores its data (.csv and .json).
Visual Settings
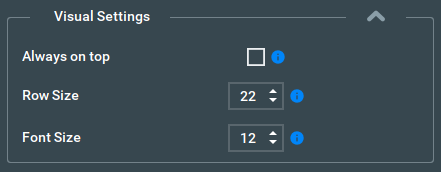
- Always On Top: Toggles the Stats window to always stay on top of all other open windows.
- Row Size: Adjust the table row height.
- Font Size: Adjust the Stats font size.
Column Settings
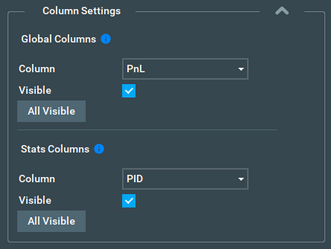
- Use this panel to show/hide a specific column. The upper side of the panel can be used to show/hide any of the Global Columns, and the bottom part is used in the same way for the Position Stats Table.
- To Show/Hide a column simply select the column name from the Column box drop-down menu, and then toggle the “Visible” check box.
- The “All Visible” button will show all columns, resetting them all to be visible.
Breakeven Point Integration

Starting from version 2.0.4, Trading Statistitcs can connect to the Breakeven Point v1.8.3 add-on to receive position breakeven average price and commissions. When the Breakeven add-on is loaded the connection will be established and the status will change to Connected. To use data from Breakeven Point please check the Use breakeven Point data checkbox as shown below:

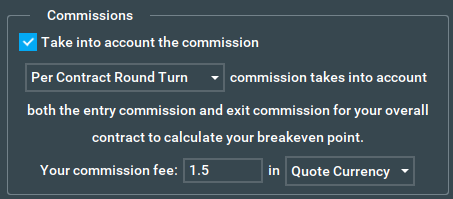
With the checkbox selected, when a position starts the add-on will receive data from Breakeven point and will update the avg price column with the breakeven price. Once the position is closed the commission column will be updated with the total commission paid in $ for the trade(s) in the position, e.g:

Breakeven add-on commission example setting:
Trading Statistics add-on FAQ
Where is the data exported?
The Add-on will export the data to the Bookmap Config directory (.csv and .json).:
(Windows)
csv: C:\Bookmap\Config\Trading Stats\trades
json: C:\Bookmap\Config\Trading Stats\data
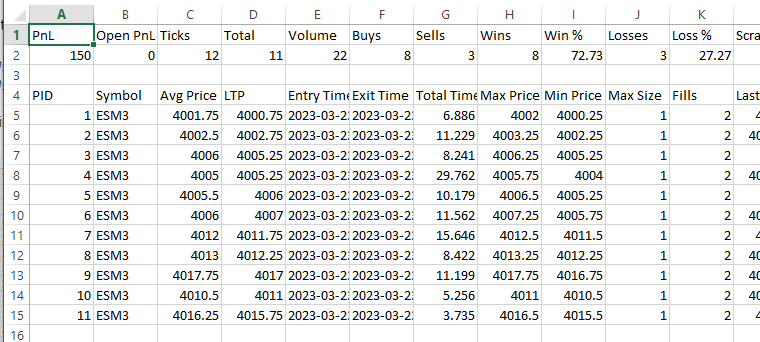
These data files can be used for offline analysis. Microsoft Excel can be used to load the .csv files:
How do I hide a column?
To hide a column you need to select the column by name in the Column settings panel, and then toggle the “Visible” checkbox. Once this is done you can check the add-on window, and the column will be disabled (Even if the column is disabled it will still save any data it receives).
What platforms/connections are supported by the add-on?
Futures, Crypto and Stocks are all supported by the Trading Statistics add-on.
How to install the Trading Statistics add-on
Please note that the Trading Statistics add-on is only compatible with the latest version of Bookmap (7.4).
Additionally, this add-on takes advantage of the new Add-ons Manager feature, which simplifies both the installation and updating process. If you'd like to learn more about the Add-ons Manager and how it can benefit your experience, please visit the following page.
Versions changelog
2.0.4
- Added support to Crosstrading
- Added support to Web Journal
- Added connectivity to Breakeven Point add-on (Avg Price and Commissions)
- Added Max PnL Column
- Added Running PnL Column
1.9.6 (2023-09-11)
- Add support to NinjaTrader adapter
- Add Running PnL column
1.9.5 (2023-08-07)
- Add support to Tradovate adapter.
1.9.4 (2023-06-14)
- Performance improvements.
1.9.3 (2023-06-14)
-
Fix rounding issue with Pnl calculation.
-
Fix timestamps on position start and end.
1.9.0 (2023-05-24)
- Fix Crypto ticks calculation.