Liquidity Tracker
What Is the Liquidity Tracker Add-On?
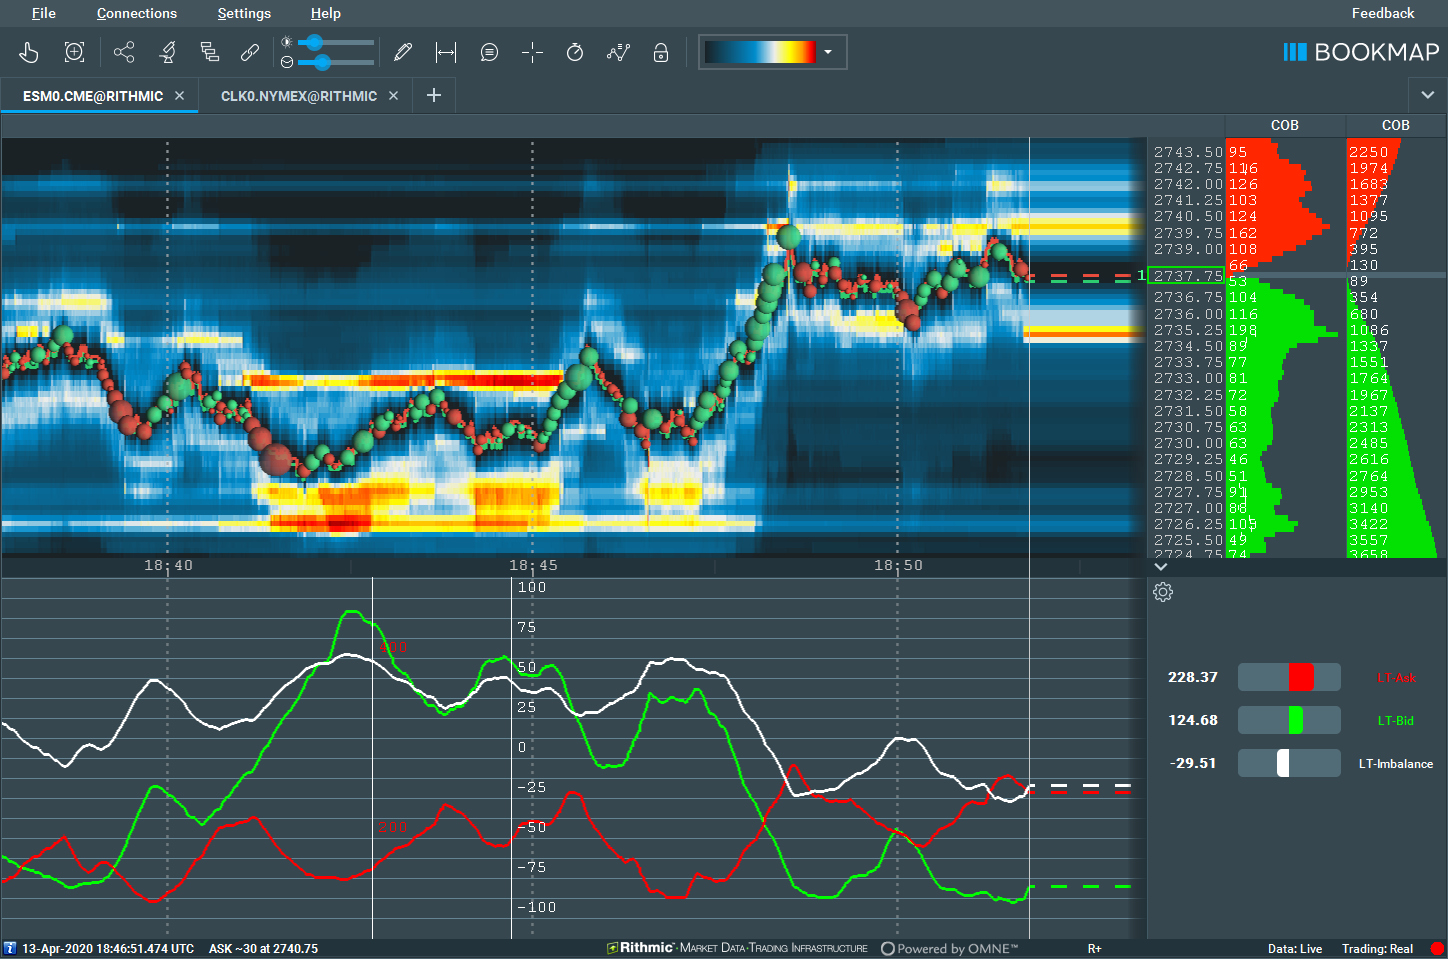
The Liquidity tracker (LT) add-on gives traders all the information needed to keep track of an asset’s liquidity, primarily displaying both the current state and historical view of the Bid and Ask liquidity, across the entire market depth (of limit orders).
Traders using the Liquidity tracker will also be able to filter the orders by their size, can instantly recompute the data on the instrument, as well access many other features to get a better understanding of liquidity.
How it Works
The Liquidity tracker (LT) add-on is a tool for traders to adjust their strategy by studying market liquidity and its evolution over time. There are several key features that allow traders to do this.
Representing Bid & Ask Liquidity
The LT add-on brings smooth representation of the Bid and Ask liquidity in its entire market depth, giving traders the detail needed to analyse markets effectively.
On the heatmap, greater weighting (larger representative bubbles) is assigned to closer, more recent price levels, helping traders easily identify areas of greater liquidity imbalance.
This is done by computing the entire market depth, which is then weighted with configurable exponentially decaying weights. This feature can help traders focus on the most recent liquidity changes, while still viewing the overall market history.
Traders can also filter the market depth orders by their size. This allows you to distinguish larger, individual orders from the rest of the liquidity, which typically consists of lots of smaller orders.
This feature of filtering orders by size can be used as an effective tool for filtering out smaller orders that are cluttering your heatmap, focusing on “whale” orders, or singling out a specific level of trade volume while analysing the liquidity.
Performance
There is no lag. The Liquidity Tracker add-on uses Instant computation to display each update on the heatmap exactly as it occurs (no bars, etc), ensuring there is no lag in information. This keeps traders as up-to-date with the market as possible.
Liquidity Tracker also can also use quick historical re-computation. When settings are adjusted by the user, it will display the results of all data collected since the instrument’s subscription.
High performance is a key element of Bookmap and the Liquidity Tracker add-on, and LT processes millions of market data events per second on a regular laptop. This allows Bookmap to recompute the indicator instantly whenever you want to change your settings.
How to configure the Liquidity Tracker
Filter By Order Size
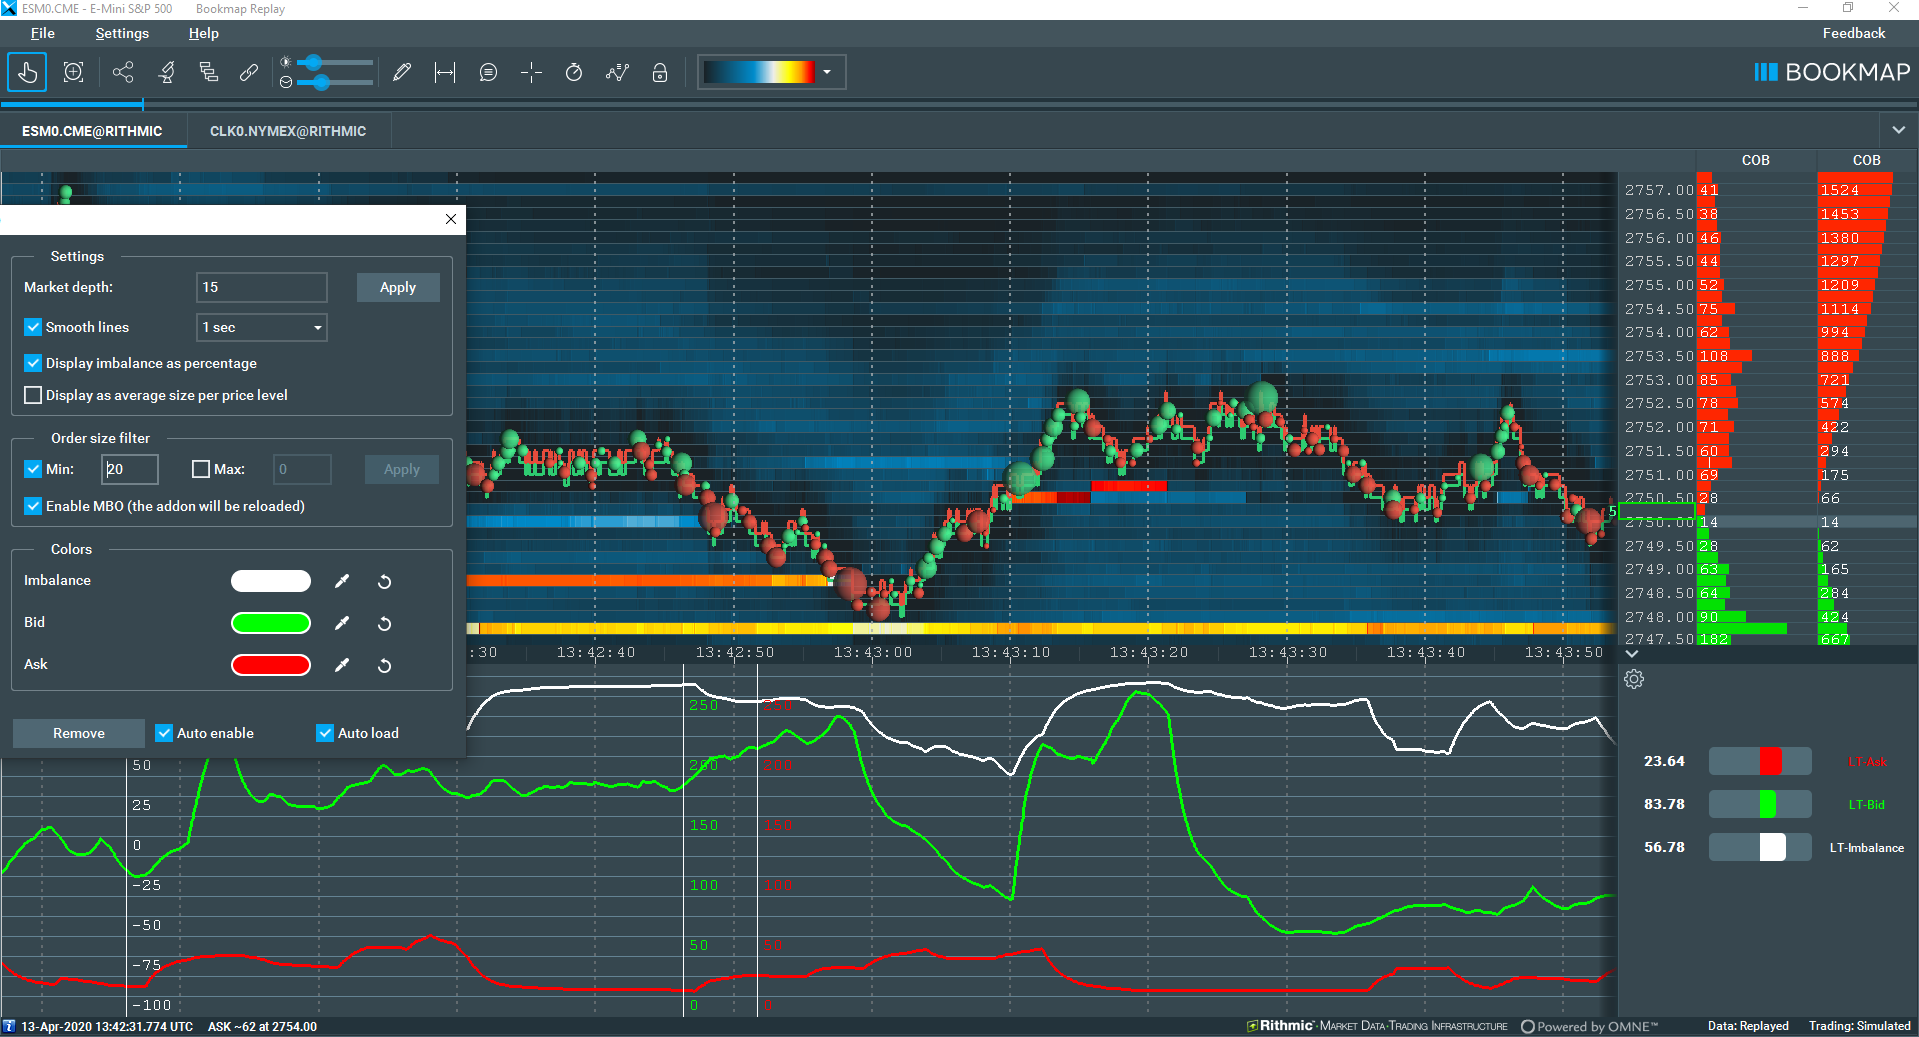
To declutter your chart, focus on smaller orders, or single out a specific price range, the Liquidity Tracker add-on allows you to filter all Bid & Ask orders by size, which will of course affect the displayed liquidity markers.
With this filter you can set a minimum and maximum order size to be displayed, filtering out any order outside this range. For example, if your maximum order size is 10, and your minimum order size is 5, then orders smaller than 5 and larger than 10 will not be displayed, and not affect the liquidity markers on your heatmap.
Market depth
The market depth value is completely configurable by traders, and determines how quickly each order loses its weighting by half. This feature helps prioritize newer market events on the heatmap and is essentially the half-life of each trade.
Traders should input a larger value if they wish to focus on historical data more, as this will give older market events more weight on the graph, while traders who wish to focus more on recent market movements should set a lower value.
We recommend experimenting with this feature to find what works best for you, and it is often the case that a different market depth value is needed for different market conditions.
Enable MBO
This enables the use of MBO data if said data is supported by the instrument that the Liquidity Tracker add-on is attached to. Enabling MBO data provides you with more in-depth information of the orders on the instrument, and is recommended where possible.
Since some exchanges do not provide MBO data, MBO data cannot be enabled for this add-on.
Visual configurations
Smooth lines
This algorithm is designed to minimize the effect of minor fluctuations or spikes in the subchart line, thereby enhancing readability. However, it's important to note that while this results in smoother transitions, it may not provide precise values at specific points.
Colors
The display colors of the imbalance line, Ask line, and Bid line on the sub-chart and heatmap are all fully customizable. You can either select a preset color option or use the color picker to select any color on your screen for the line.
The maths behind the magic
Many of our users have requested to see the formula of liquidity computed by the Liquidity Tracker add-on, (thanks, Jayme). So, here is the maths behind how Liquidity Tracker works
- Let's denote the price levels of market depth pi, and the sum order sizes on it: qi. Note that the following 'halflife' parameter appears in the add-on's UI as 'market depth' (for simplicity). The best bid and best ask are considered to be at zero price level, and appear in the formulas as p0. The liquidity computed by LT on each side of the order book (the two lines called LT-Bid and LT-Ask) is:

- If the checkbox 'compute in money units' is selected, LT multiplies the quantities by their price, depending on the price level. This may be useful when looking at a very wide range of prices because it neutralizes the distortion caused by the fact that [almost] anyone can place a Buy order of size of 1M BTC at a price of 0.001, but few can place such a large Sell order.

- If the checkbox 'average per price level' is selected, LT will normalize the result by the sum of weights (as if all price levels have a size of exactly 1). Note that in this case, it's important that such the denominator runs only over non-empty price levels.

- If both checkboxes above are selected, the formula is:

Additional Technical Information
The Half-life parameter is equal to the exponential decay rate. The weighting assigned to price levels is always 1 for the best price (because exp(0)=1), and it gradually drops by half every half-life price level.
Note that the distance between prices is in units of minimum price increment, thus it's always an integer. But decimal decay rates are valid, e.g. 3.5 or 1e7 (effectively, the latter would sum up the sizes of all price levels into integers).
In practice, the number of price levels on each side isn't infinite. It may be thousands, or billions (on some digital currency exchanges), or even limited to 10-20 levels by a data vendor (which is more typical for futures). Also, in practice, LT computes the formula dynamically, meaning there is just one computation for each data update anywhere in the order book. Otherwise, iterations over a high number of price levels would degrade performance.
Exponentially weighted liquidity also solves a typical problem with the uniform sum of N price levels.
Imagine a large order on the last Nth price level and the best price starts flickering by advancing and retreating by just 1 level (this happens all the time and at a high rate). The large order doesn't move, but the impact of it being added and removed (as it leaves and enters the scope of N levels) is identical to such an order being frequently added/removed at the best price or in front of it. But, for an observing trader, these two situations are very different.
Tips
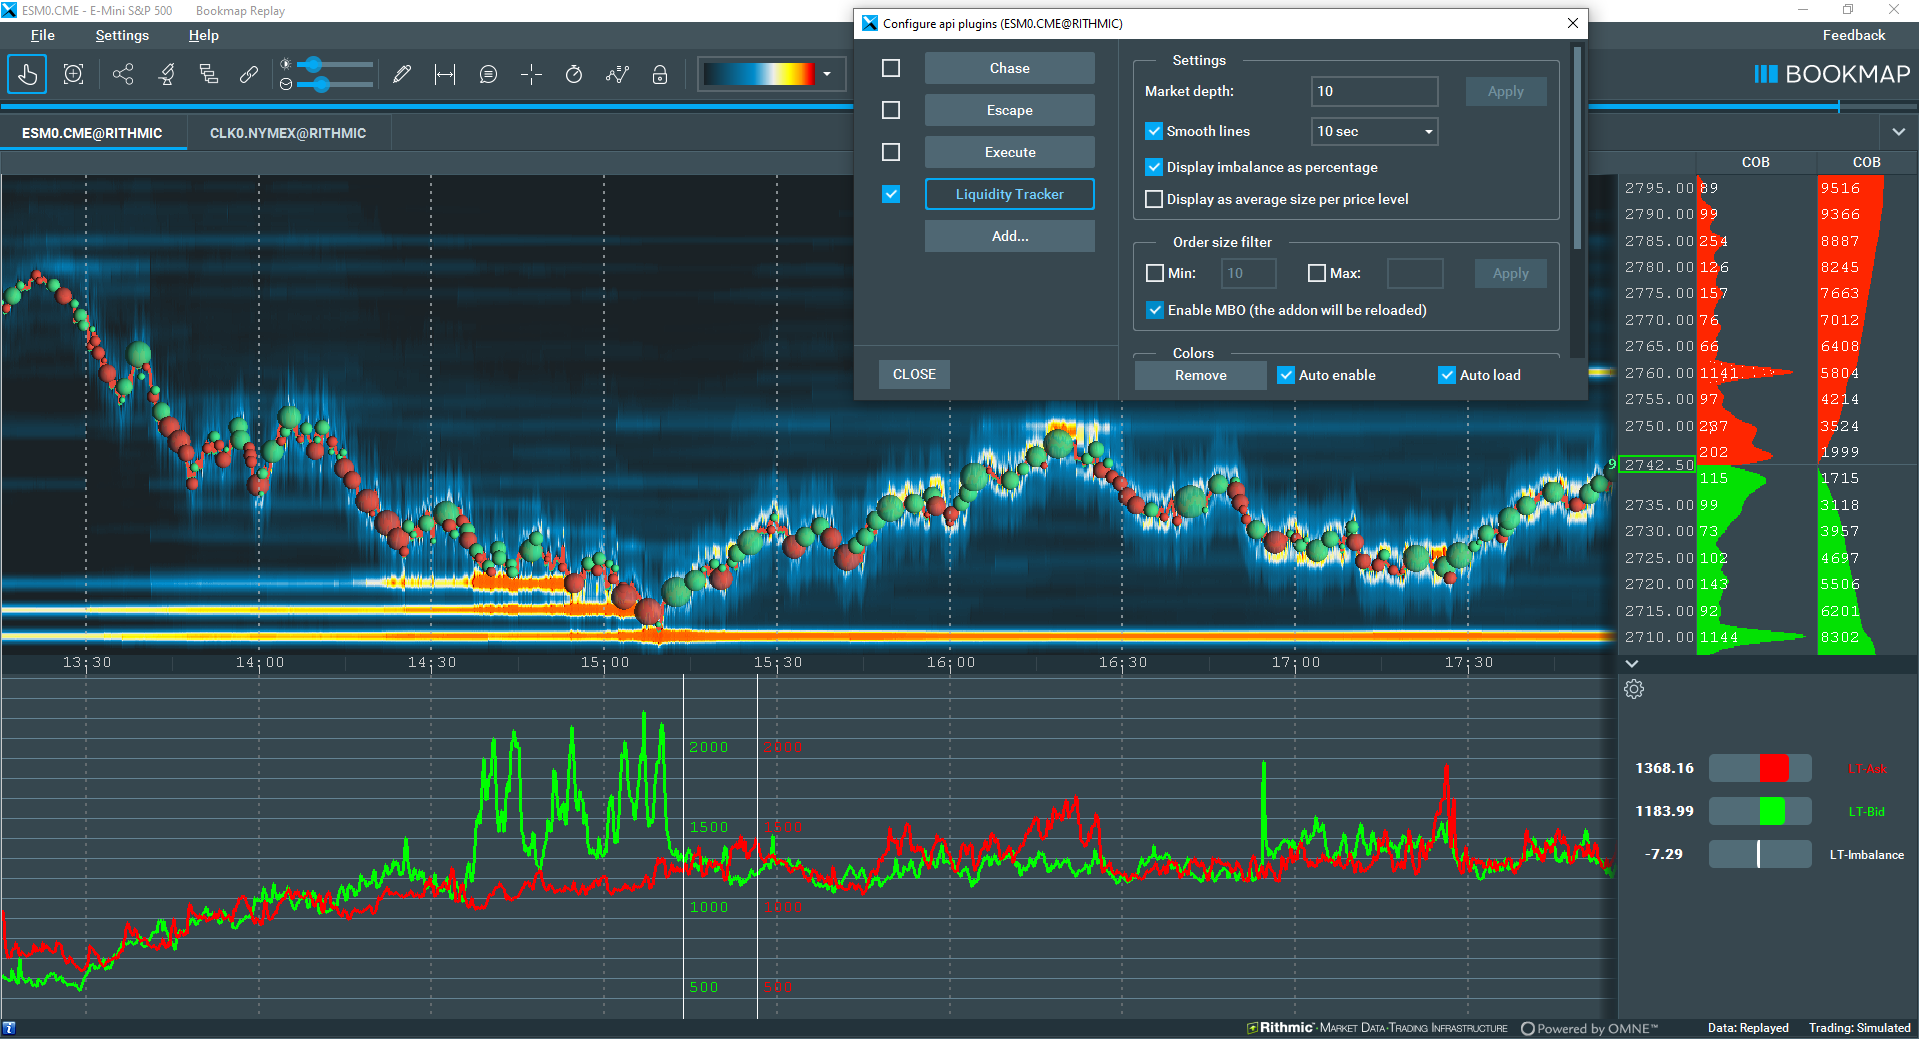
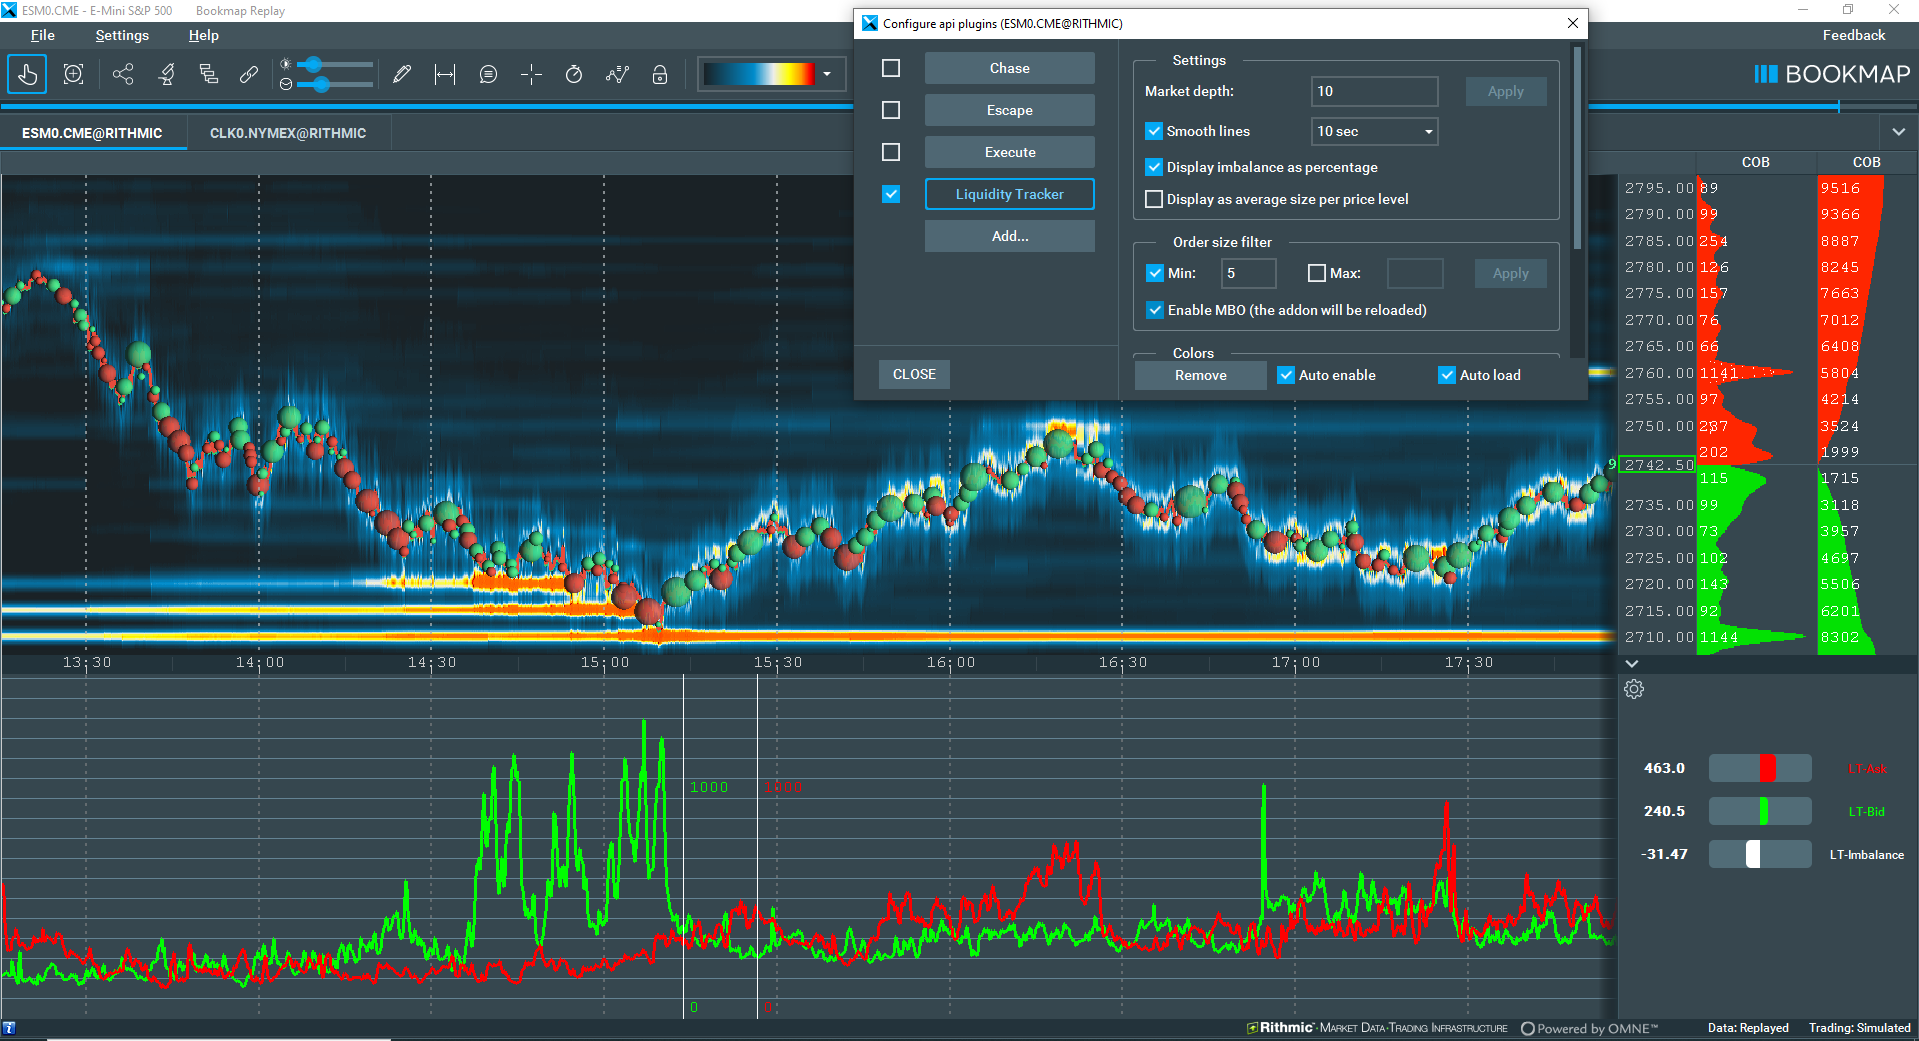
In many cases, while the general liquidity imbalance is flat, the imbalance between large orders is easily noticeable and may indicate a kind of 'alignment' of intentions of larger traders. Images LT-03 vs LT-04 and LT-05 (shown directly below) demonstrate such a case around the time 15:00.
Without the order size filter the bid size reaches x2 times of ask size. But after filtering out orders below size 5 or 10, this ratio becomes x10. This is a clear example of the uses of the LT, allowing traders to uncover crucial information that can inform their trading decisions. There are many other ways to use it not covered in this description, for instance:
-
You can use the min and max order size filter to account for only the orders of specific order size (e.g., perhaps these are your orders of a particular size 42)
-
You can set the market depth parameter to a high value, e.g. '1e6' (1 million), so that effectively all levels will be have a uniform weight of 1, allowing you to more easily see the total size of the entire market depth. Notice, however, that the result may be misleading because of two factors:
-
Most non-crypto exchanges set price range limits per instrument that determines where the orders are allowed to be sent, For instance, between 2000 and 4000. Therefore when the price moves up, the sum of all Sell (Ask) orders is expected to decrease and the sum of all Buy (Bid) orders should increase. This is expected if the order book on both sides is completely identical. In reality, it's not, but this effect adds up to the resulting view
-
The USD worth of orders at lower prices is lower than that of those at higher prices
-
Without order size filter
With order size filter at minimum 5 contracts
With order size filter at minimum 10 contracts

Limitations
Both LT Pro and LT Free support any instrument with MBP -- market-by-price depth data. Today, all connections including stocks and crypto provide MBP data. But the order size filtering feature (which is the only difference of LT Pro) works only with CME Futures with a Rithmic and CME Futures BookmapData connection. To clarify, this feature will NOT work with:
- Non-CME data by Rithmic or Non-CME data by BookmapData , e.g. Eurex futures
- CME data not by Rithmic and CME data not by BookmapData, e.g. CME futures by CQG
- Anything else except CME futures by Rithmic and CME futures by BookmapData
Installation
To install the Liquidity Tracker Add-On, simply get Bookmap 7.4 and install it from the Add-ons Manager.
This add-on takes advantage of the new Add-ons Manager feature, which simplifies both the installation and updating process. If you'd like to learn more about the Add-ons Manager and how it can benefit your experience, please visit the following page.
Versions changelog
3.2.1
Note: Some of the previous updates were dropping the previous settings, and we were alerted about the huge effort required to reconfigure it on all instruments. We will minimize such cases as much as possible in future. However, in this case, dropping previous settings was unavoidable in order to fix the problem
Published on 30-Oct-2020.
- Fix: a crash when loading add-on version 3.2.1 after using 3.1+.
2.2
Published on 26-May-2020.
- Fix: a false alarm about non-MBO data
- Fix: Negative values of Bid or Ask (due to computation error in special cases)
- Improvement: updates notification mechanism (see status in the settings panel)
2.3
Published on 01-Jun-2020.
- Fix numerical errors causing negative sizes when the order book is cleaned
- Performance improvement
2.5
Published on 04-Jun-2020.
- Fix: Another, solid fix for negative sizes
- Fix: Proper detection of the presence of MBO data. It caused false alarms about the absence of MBO data
- Minor improvements and refactoring
- A known bug: the state of the checkboxes near order size filters isn't preserved