Market Pulse Web | Market Pulse Web Login
What is the Market Pulse?
Market Pulse is a comprehensive monitoring system consisting of multiple widgets.
Each widget measures and displays events that are generated by different sources, for example: order flow, order book, options, liquidations, or other special events like stops or icebergs.
Market Pulse allows you to monitor multiple instruments and gain a better understanding of market behavior, all in one place.
Each widget measures and displays events that are generated by different sources, for example: order flow, order book, options, liquidations, or other special events like stops or icebergs.
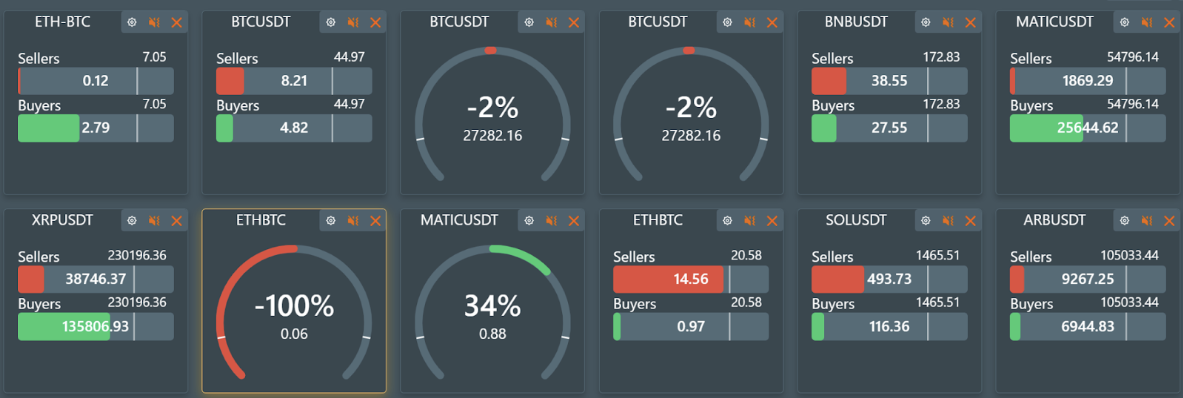
Each widget in Market Pulse contains a unique algorithm for processing data. They each follow a specific logic chain, and display their output on the widget in an easy-to-understand chart. Users can customize the widget to set up notifications for specific events, or for when a certain threshold is crossed.
To start using Market Pulse Web, simply follow this link: https://mpulse.bookmap.com/workspace.
Market Pulse Web VS Market Pulse add-on
In both versions, Market Pulse provides traders with an extensive number of instruments and algorithms to analyze the markets, allowing you to maximize your trading capability with either version.
There are, however, some key differences between Market Pulse Web and the full Market Pulse add-on for Bookmap. These are displayed below:
| Market Pulse Web | Market Pulse add-on for Bookmap | |
|---|---|---|
| Start using | Available by the link: https://mpulse.bookmap.com/workspace . Can be used on the desktop, mobile, or any other device with a browser. Read more. | Available only on desktop. To start the add-on you need to install and configure the Bookmap desktop app. Read more. |
| Embed | Widgets can be simply embedded into any website. | Embedding is not supported. |
| Save workspace | Supported. | Supported. |
| Data sources | Can be used with the most popular crypto instruments, multibook, and others. More data sources are being added frequently. | Can be used with any Bookmap-supported connection, including thousands of different instruments: crypto, stocks, and futures. Read more. |
| Historical data | Not available for now. | You can load any amount of historical data, restricted only by the Bookmap license. Read more. |
| Algorithms | 3 algorithms: Volume Pressure, Volume Pressure Imbalance, and Price Change. Read more. | 10 algorithms (with more to be released soon). Read more. |
| Algorithms customization | For each algorithm you can choose one of 3 presets. Read more. | Everything is fully customizable. You can accurately configure all parameters, which gives you a new edge in the tracking of special events. Read more. |
| Sound notifications | Sometimes restricted by the browser. Read more. | No restrictions, fully adjustable. Read more. |
| Detached widget | Can be detached. | Always detached. Read more. |
| API | Can be accessed via the websocket API. Custom algorithms can be loaded to the server. Read more. | Can be accessed via the Java API (Python API will be supported later). Custom algorithms can be loaded into the add-on. Read more. |
How to add widgets?
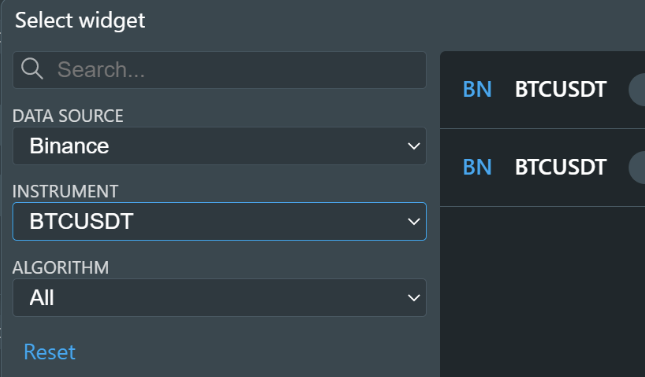
To open the "add widgets popup", click the button with the plus sign
From here, select the data source and algorithm, and then select the widget on the right side of the popup. After the selection, it will appear on your workspace page.
Control elements
Login & Sign in
You need to Log in to unlock the full potential of Market Pulse and to log in, you need to have a Bookmap account.
Bookmap account creation can only be done on bookmap.com. Click the link to create an account - simply follow the instructions on the website! You can select whichever Bookmap subscription you think suits your needs best. Don’t worry, the free subscription will also work for accessing Market Pulse.
There are a lot of advantages to being logged in:
- the ability to configure workspaces and save your configurations
- additional data sources (exchanges)
- additional algorithms
- live widgets
And since you can login for free to start with, there’s no reason not to! Just head to bookmap.com to get started, and unlock all those extra features.
Workspaces
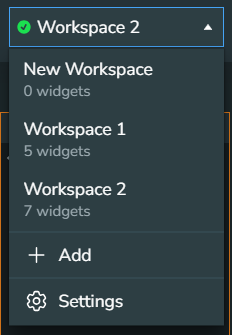
Workspaces allows you to save your favorite widget groups and use them across different devices. You can configure this on your laptop and use it on mobile devices, or vice versa. In the workspaces configuration menu, you have the power to create, rename, and delete workspaces.
Mute all
This option mutes all currently working widgets. It is much faster than muting widgets one by one, and is especially helpful if excess sound notifications are annoying you, or you want your device to be quiet for just a moment.
Reordering
You have the power to change the order of widgets, and all this takes is one click of the “Reorder” button:
Drag and drop widgets to change the order.
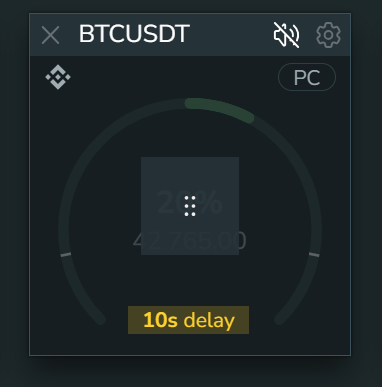
To disable the “reordering” mode and get back to normal trading views, click the tick to confirm the new order:
Widget settings
To open widget settings, click the cog icon in the top right of the widget title.
Workspaces

Workspaces allows you to save your favorite widget groups and use them across different devices. You can configure this on your laptop and use it on mobile devices, or vice versa. In the workspaces configuration menu, you have the power to create, rename, and delete workspaces.
Mute all
This option mutes all currently working widgets. It is much faster than muting widgets one by one, and is especially helpful if excess sound notifications are annoying you, or you want your device to be quiet for just a moment.
Reordering
You have the power to change the order of widgets, and all this takes is one click of the “Reorder” button:
Drag and drop widgets to change the order.

To disable the “reordering” mode and get back to normal trading views, click the tick to confirm the new order:
Widget settings
To open widget settings, click the cog icon in the top right of the widget title.
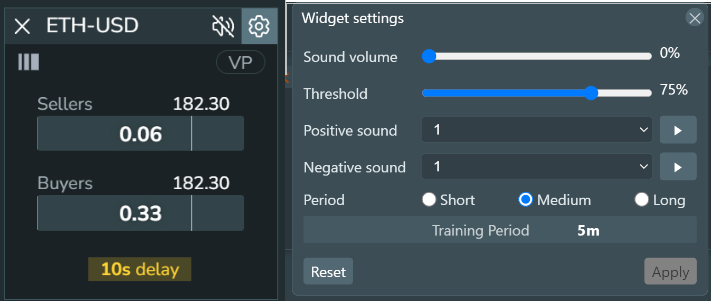
Choosing a time frame
Each algorithm tracks the deviation from the standard situation on the market. Thus, it can provide alerts when the market moves beyond the normal bounds. The thresholds for such “normal” movement can be defined by users by simply moving the “Threshold” bar. To identify which situation is normal, the algorithm should pick the historical interval for the comparison. In the widget configuration popup, you can select this period yourself:
Short: 5 minutes
Medium: 15-30 minutes
Long: 1 hour
Threshold
This slider defines the minimum threshold (or level) for a sound to be played as a percentage value. The higher this parameter, the fewer sound notifications that will be played.
Audio files
Audio files are used for sound notifications. Different sound files can be set for positive/negative values, such as being based on buyers/sellers. This allows you to set specific sounds, and easily identify the direction of the market based purely on sound notifications.
Volume
This slider controls the volume of the sound alerts for that specific widget. This allows you to prioritize more important widgets with a higher notification volume.
Algorithms
This section contains the algorithms’ descriptions and algorithm-specific control elements.
Volume Pressure
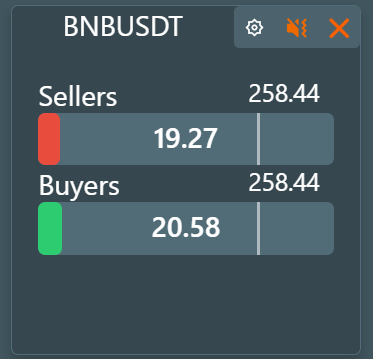
Volume Pressure is an order flow indicator that measures the total buyers and sellers Volume Pressures in the market. It calculates the deviation of the volume pressure from the average across an interval of time.
The percentage value shows how close the current deviation is to the max deviation that was detected on the interval.
All the values will be shown on the Double bar widget.
Price Change
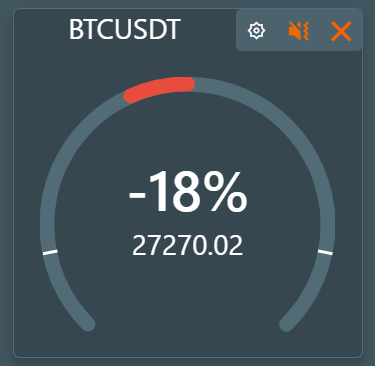
The Price Change calculates the deviation of the last trade price from the average across an interval of time. The percentage value shows how close the current deviation is to the max deviation that was detected on the interval.
All the values will be shown on the Circle widget.
Widget structure
Common elements
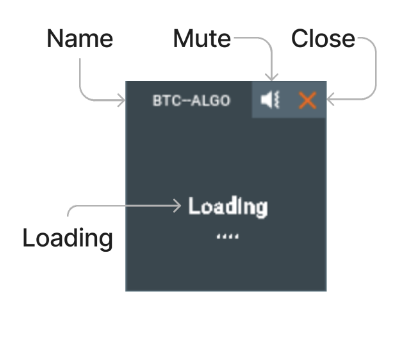
All the widgets have a:
- Widget name.
- Mute button: to mute/unmute the widget.
- Close button: to remove the widget.
- Loading state, which will appear when the data is being calculated, if there are no events to process, or there are connection errors.
Double bar widget
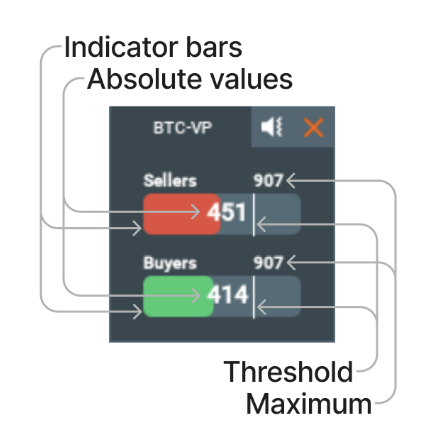
The Double bar widgets contain:
- The indicator bars with absolute values overlayed on top of them, which are split into two bars: buyers and sellers.
- The maximum value on the given period.
- The threshold line, so long as the widget is not muted, will play a sound whenever the threshold is crossed.
Circle widget
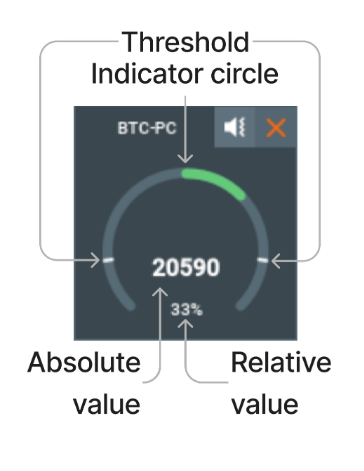
The Circle widgets contain:
- The absolute value of the asset, in the middle and in bold
- The relative value showing the deviation of the absolute value from the average during the given interval.
- The indicator circle as a visual representation of the relative value, color coded for the value increase and decrease.
- The threshold line, so long as the widget is not muted, will play a sound whenever the threshold is crossed.
Sound system
The Market Pulse sound system reacts to changes in the current value of any widget’s tracked asset. It has a configurable threshold, which when crossed causes a sound to be played.
Initially, we used Geiger counters and metal detectors as our reference for developing the Market Pulse sound system. The closer it is to uranium/metal, the higher the frequency and the speed of the sound.
This same concept is used for our algorithms - the frequency of the played sounds depends on the value above the threshold; the higher the threshold-crossing value, the more frequently the sound is played.
Example:
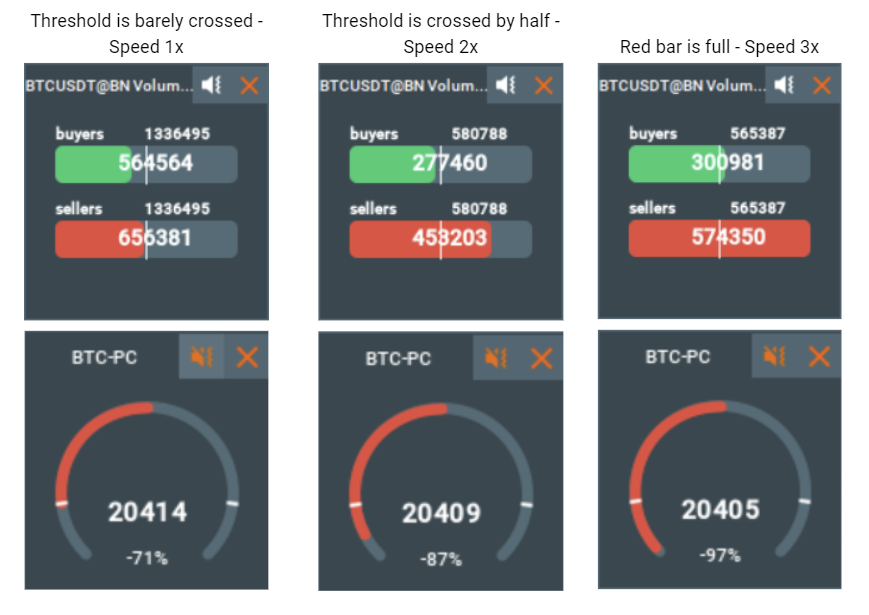
Sound notifications for different bars mean that the corresponding value of that bar in comparison to its previous values has been growing fast enough and has crossed a certain threshold, a threshold that the user can configure.
The more frequently sounds are played, the closer the current value is to the expected maximum value.
So the values can be compared by sound. Let’s look at the Volume Pressure widget:
Example #1: you hear the sound and over time the frequency of the notifications is increasing.
- This means the relative value is increasing; in other words something big that requires your attention is happening.
Example #2: you hear the sound and over time the frequency of the notifications is decreasing.
- That means the relative value is decreasing; in other words now the market is stabilizing.
Heatmap Widget (New)
Why do traders need Market Pulse?
With the complexity of global markets, monitoring changes in price, volume, and order flow events across multiple asset classes can be overwhelming, especially for an individual trader with limited screen space or tools. Market Pulse Web allows you to efficiently follow these movements in real-time on a single screen.
Market Pulse Web’s widgets provide a visual representation of market data in real time, allowing traders to grasp other instruments' changes at a glance. The use of colors helps quickly identify which assets are gaining or losing value and the use of sound alerts helps prevent missed trading opportunities.
Why Use the Market Pulse Heatmap Widget?
The heatmap widget enables traders to monitor multiple assets simultaneously, providing an at-a-glance view of overall market sentiment.
It’s particularly useful for tracking correlations. For instance, if you’re trading SPY, you can quickly identify leading stocks pushing the market higher and those holding it back.
Updated in real-time, the heatmap widget is crucial for active traders who need to stay ahead of market fluctuations, allowing for quicker, more informed trading decisions based on the most current data.
Configuration / More Details
The image above shows the heatmap widget from our Market Pulse Web product. This widget is often used to visualize price changes or volume pressure imbalances across multiple assets, such as stocks or cryptocurrencies, all within a single widget.
Currently, it supports two asset classes: the top 7 US stocks and the 2 largest cryptocurrencies:
1. US Stocks Supported:
- MSFT (Microsoft)
- GOOGL (Alphabet)
- NVDA (NVIDIA)
- AAPL (Apple)
- AMZN (Amazon)
- META (Meta)
- TSLA (Tesla)
2. Cryptocurrencies Supported:
- BTC (Bitcoin)
- ETH (Ethereum)
How it Works
-
Each block is color-coded: Green represents a positive price movement or gain. Red indicates a negative movement or loss.
-
The size of each block is proportionate to the stock's market cap, providing a visual hierarchy where larger blocks represent more prominent stocks.
- Each widget has a settings cog icon in the top right corner, allowing users to configure or adjust the settings of the widget.
- The "X" in the top left corner of each section enables users to close or remove the specific heatmap.
Supported Algorithms
Settings Cog
Choosing a Preset
-
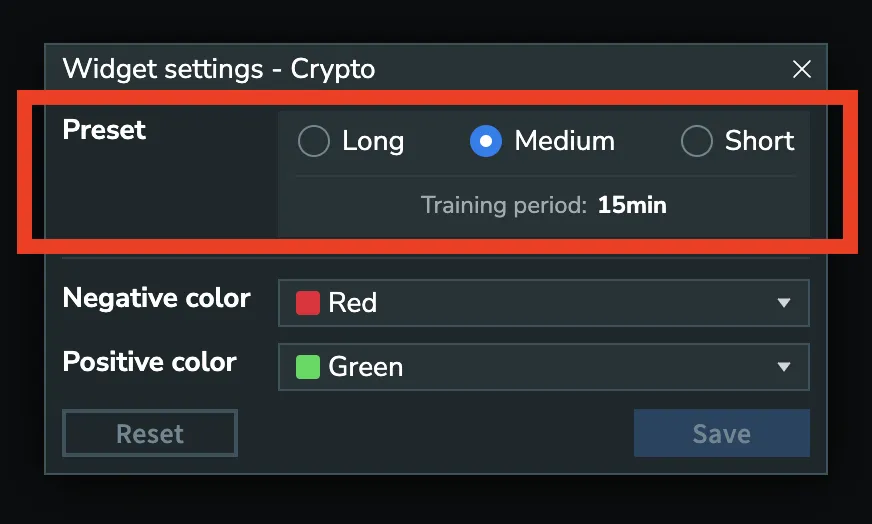
Each algorithm monitors deviations from typical market conditions and can send alerts when the market moves beyond normal boundaries.
-
Users can easily define what constitutes “normal” by selecting one of our three preset options.
-
To determine a normal market situation, the algorithm compares it against a historical interval. In the heatmap widget’s configuration settings, you have the option to choose this comparison period yourself:
- Short: 5 minutes
- Medium: 15-30 minutes
- Long: 1 hour
Choosing a Positive and Negative Color
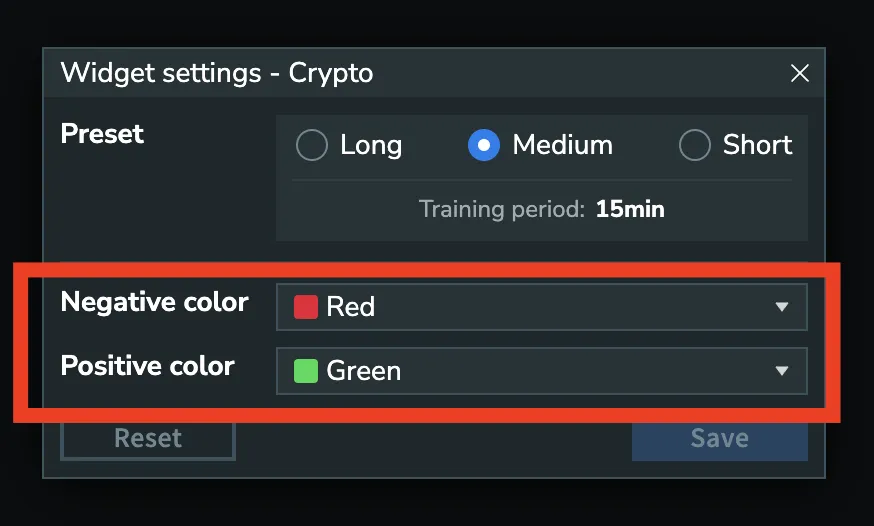
- The heatmap widget’s color scheme is fully customizable through the settings icon.
- By default, green indicates positive movement (gains) and red represents negative movement (losses), but users can easily adjust these colors to suit their preferences.
FAQ
Why do I see only delayed widgets? How can I access live widgets?
To get access to live widgets you need to log in.
- Widgets for some data sources like Binance and Kraken will be immediately live after logging in.
- To get access to BookmapData widgets (an aggregation of multiple crypto exchanges) you need to purchase the Market Pulse algorithms bundle for Crypto.
- To get access to TrueData (India) widgets you need to purchase the TrueData Pro package.
How do I set up the Market Pulse Web and Market Pulse add-on for Bookmap?
To start using Market Pulse Web, simply follow this link: https://mpulse.bookmap.com/workspace.
To start the Market Pulse add-on for Bookmap you need to:
- Install and activate Bookmap Read more.
- Configure the data source Read more.
- Subscribe to the instrument Read more.
- Install and configure the Market Pulse add-on Read more.
Why does the browser restrict the sound playing?
It depends on the browser, but most popular browsers optimize their performance where possible. This can sometimes mean they disable the scripts that play sound on the Bookmap page if it is not the page in focus.
That means that it is possible that the widget will stop playing sounds after a while if the Market Pulse Web workspace is not in focus.
How do I get access to the Market Pulse API?
We have many different types of API:
- Web Websocket API to get signals from the widgets
- Web Algos API to be able to write your own algorithm, place it on our server and use in the workspace, sell it to others, or to get signals via Websocket API.
- Desktop Java API to get signals from the widgets
- Desktop Java Algos API to be able to write your own algorithm, place on your computer locally, connect to Bookmap and use it in the Market Pulse add-on. You can also sell it on our marketplace to others or to get signals via Java API.
To get access to an API please fill the form.
How can I provide my feedback on Market Pulse Web?
Please feel free to fill out a quick survey.