Absorption Indicator
What Is the Absorption Indicator?
Absorption is an on-chart indicator that highlights areas with large volume traded over short time periods. Absorption is the result of aggressor buyers’ or sellers’ activity at key levels.
Essentially, it shows where large resting sell limit orders (sometimes iceberg orders) absorb large buying aggressors and vice versa, where large buy limit orders absorb large selling aggressors.
In many cases, the absorption indicates areas where price bounces and moves in a new direction.

Configuration
Traders can configure the Absorption Indicator settings separately for each instrument, helping you customize your Bookmap trading experience.
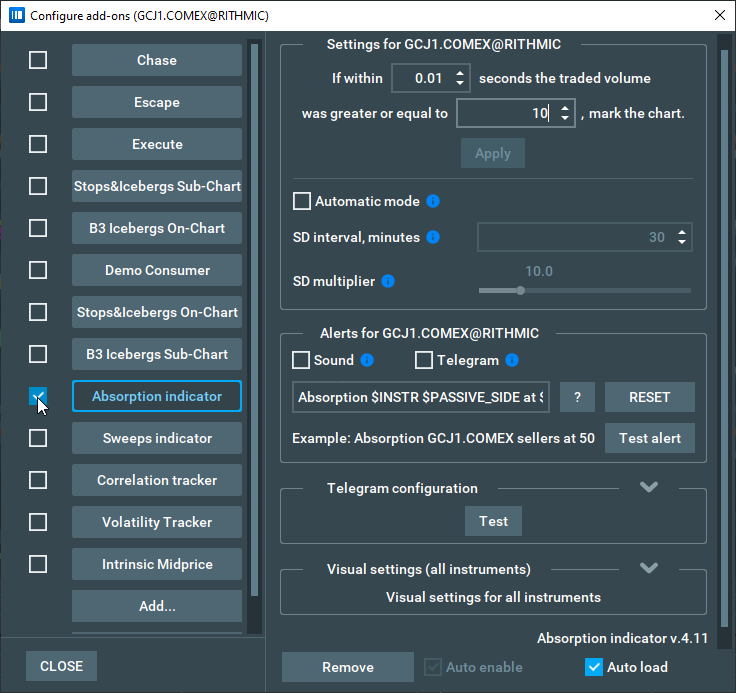
If within a configurable time period the instrument's traded volume for a certain price level was greater than a configurable size, the Absorption Indicator will add a mark to the chart.
Buys and sells are calculated separately, and traders can enter their own values into the “time” and “size” fields to customize their Absorption Indicator charts.
Automation Feature
Ticking the “Automatic mode” checkbox allows you to have the minimum size setting update automatically, although while automated it cannot be manually edited. This is updated based on a calculation of the standard deviation (SD) of traded volume for the last x minutes, where x is the value of the “SD interval” field which traders can configure.
The “SD multiplier” slider allows you to adjust the number of detections. The larger its value is - the fewer detections will be on the chart.
Customizable Alerts
If the “Sound alert” checkbox is ticked, you will get a sound notification every time a new group of indicator marks is added to the active chart, allowing you to keep a finger on the market whilst doing other things.
The “Telegram” checkbox enables text notifications in your Telegram application. The trigger rule and the text for these notifications is the same as for sound alerts, but you need to configure your Telegram notifications before enabling, see corresponding section of the manual below.
You can adjust the notification text according to your preferences by editing the corresponding text field. The “?” button will show you the list of possible templates, the “Reset” button will reset the notification text to a default one, and the “Test alert” button will play test sound notifications based on your current notification settings.
You can also customize sound alerts via the “File” -> “Alerts” -> “Sound alerts” window. This fully duplicates any functionality of the sound alerts panel of the add-on configuration, and allows you to manage alerts from different add-ons in one place.

Clicking the “Configure alerts” button will open the sound alerts configuration panel for the corresponding alert.

If you remove an alert from the list, you can add it back by enabling sound alerts in the Absorption indicator configuration. The “Add alert” button does not work for the Absorption indicator currently.
Telegram Notifications Guide
To start getting Telegram notifications from your add-on, you need to implement the following steps:
-
Getting Started
Install the Telegram Desktop application https://desktop.telegram.org/ and create an account.
You can also use either web or mobile versions of Telegram, but we recommend using the desktop version for a better user experience during the configuration process - this can then be linked to and used on the mobile version once configured.
-
Create a Telegram bot
Open the following link in your Telegram application: https://t.me/BotFather, and then follow these instructions.
- Send “/start” message to start working with the bots management bot.
- Send “/newbot” message to create a new bot.
- Choose a name for your bot by sending it as a new message.
- Choose a username for your bot by sending it as a new message. Username should be unique and must end in “bot”.
- When your bot is successfully created, you will get a message with an access token for this bot. Copy this access token to the Absorption indicator -> Telegram Configuration -> Token
-
Obtain the Chat ID where you want to get notifications
- Enter the Telegram account for which you want to get notifications.
- Open the following link inside of Telegram: https://t.me/get_id_bot.
- Send “/start” message to start working with the bot.
- Receive your chat ID via the bot's response.
- Copy this chat ID into Absorption indicator -> Telegram Configuration -> Chat ID
-
Start a conversation with your bot
Open the link https://t.me/your-bot?start=subscribe inside of Telegram. In this link “your-bot” is a placeholder for the username of your bot - make sure you change it accordingly! Next, Send “/start” message to start a conversation with your bot.
-
Run A Test
Click the “Test” button on the Telegram configuration panel inside Bookmap to make sure that everything is configured properly. You should receive a test notification message in Telegram from your bot if everything is OK, or an error message describing the problem otherwise.
-
Enable Telegram notifications
Finally, you must enable Telegram notifications by checking the “Telegram” checkbox on the add-on alerts configuration panel.
Visual settings
The visual settings of the Absorption Indicator are the same across all instruments it is added to.
The visual settings panel is collapsed by default, and you need to click [v] button to expand it.

The Absorption Indicator visual settings panel looks like this:

Checking the “Show icons” checkbox will show all absorption icons with some offset from where trade occured on the chart.
Checking the “Show volume” checkbox allows you to display absorbed volume numbers on the chart nearby to the absorption icons. If several icons of the same side (buys or sells) are close to each other, only one icon with an aggregated total volume for all of them will be shown on the chart.
The “Icons size” slider allows trader to select their preferred icon size in pixels.
Configuring the “Icons offset” slider selects how far away the icons will be displayed from their corresponding trade dots.
The “Offset line width” slider allows traders to set the width of the dotted offset lines which connect the indicator icons to trade dots.
Passive buyers and sellers color settings indicate the color with which the passive buyers and sellers absorptions are marked on the chart.
The “Icon color” shows the color of indicator icons, trade dots, and lines.
The “Text color” shows the color of the text on the icons.
The “Background” color allows you to choose the background color for the icons.
The “Horizontal aggregation” slider sets the minimal horizontal distance in pixels between the icons on which they start aggregating.
The “Vertical aggregation” slider sets the minimal vertical distance in pixels between the icons on which they start aggregating.
Disabling of both Horizontal and Vertical aggregations is possible. Please note that it may result in too many icons on the chart, which may make them unreadable and cause performance issues. For this reason we do not recommend disabling this feature, especially with large amounts of data.
Toggling the “Show trade dots” checkbox allows you to show/hide all trade dots created by the indicator.
The “Dots size” slider allows you to select the indicator's trade dots size in pixels.
The “Dots shape” drop-down menu allows you to choose the shape of the indicator’s trade dots, either round or rectangle.
Interaction with icons
Right-click on any Absorption Indicator icon anywhere on the chart to open the popup menu with the indicator configuration.

Traders can drag any Absorption indicator icon on the chart up or down with their left mouse button to change the vertical distance between ALL the indicator icons and the corresponding trade dots which the icons are representing (“Icons offset” parameter).

What It Looks Like
With all your settings customized, here is an example of Bookmap’s chart with the Absorption Indicator enabled:

On this chart, small green and magenta rectangles indicate the absorption levels.
Notes
-
The Absorption indicator supports all instruments/platforms, including futures, stocks, and crypto.
-
The backfill data that is provided by dxFeed (and some other connections) is aggregated. Therefore, the granularity for such instruments is insufficient to show Absorption correctly, meaning detections on backfill data may differ from real-time data.
-
The volume traded during a short time frame is different between instruments, and on the same instrument at different times. So if you adjust the threshold manually, you may need to update it.
-
Need help? Join our Discord channel, or contact us at support@bookmap.com.
Absorption FAQ
I do not see any dots. How can I check that the indicator works?
Absorptions are shown only when the traded volume is greater than the threshold you have set in your settings. If you see trades and still do not see any Absorption icons, go to your Absorption indicator configuration and set a smaller minimum size.
If this doesn’t work, disable all other addons and then go to the visual components and hide all chart elements. If this does not fix the problem, please contact us at support@bookmap.com or via our Discord channel.
What is the difference between the Absorption indicator and the current Volume Bubbles on the chart?
In Total volume mode, the volume bubble shows both buyers and sellers aggressors combined. It is not necessarily one-sided (aggressor buyers or aggressor sellers), and it is not necessarily on the same price nor over a short time frame.
Delta mode simply shows the difference between buyer and seller aggressors. The volume is not necessarily traded over a short time or at the same price.
In comparison, trade volume bubbles on the Absorption Indicator specifically highlight large volumes over short time periods, are always on the same price, and are displayed seperately, and so could always be one-sided.
What is the difference between the Absorption indicator and the Sweeps indicator?
The Absorption Indicator applies the traded size threshold to each price level separately, while the Sweeps Indicator applies the traded size threshold to all price levels as one. As well as this, the Sweeps Indicator displays marks on the chart only if trades happened on at least X different price levels.
Is the Absorption Indicator part of Bookmap, or will it be an additional purchase?
Absorption Indicator is available as part of the Bookmap Global+ package.
Known issues
- Absorption indicator "Sound alert" settings disappear when switching between add-ons in the "Configure alerts" window. If it happens, just close the window and open it back to restore the functionality.

- While you can remove Absorption indicator alerts from the list in the “Sound alerts” window, you can not add them back using the “Add alert” button. The only way to add a deleted alert back is to enable it again in the add-on configuration window or to restart the add-on.

We are going to fix the above issues in future, until then you may use the described workarounds.
Installation
The latest version of the Absorption Indicator requires the latest build of Bookmap 7.4 b11 or higher. Bookmap 7.4 has a new way of installing add-ons. For more information, please visit this page.
To install the Absorption Indicator, simply get Bookmap 7.4 and install it from the Add-ons Manager.