Market Mechanics
Market Mechanics describe what are orders, the microstructure, and the dynamics of order book/order flow inside exchanges (or trading venues). It shows how matching engines use various matching algorithms to process the orders, and how it is reflected in the market data that they generate. This article is a 'crash course' on Market Mechanics, brief, but intense. It doesn't require any background knowledge in trading and it doesn't assume a specific market, making it suitable for Futures, Stocks, Cryptocurrency, and so on.
Why should I read it?

There is a number of reasons why it's recommended to understand market mechanics before starting to trade or developing a trading strategy. Here are some of them.
Market Mechanics Trading Approach
Understanding market mechanics is more than theory. Traders can build strategies around how orders are placed, matched, and executed. This trading approach helps frame the market as a system of rules and actions, allowing traders to anticipate reactions rather than relying only on price charts.
The price is determined by orders of traders
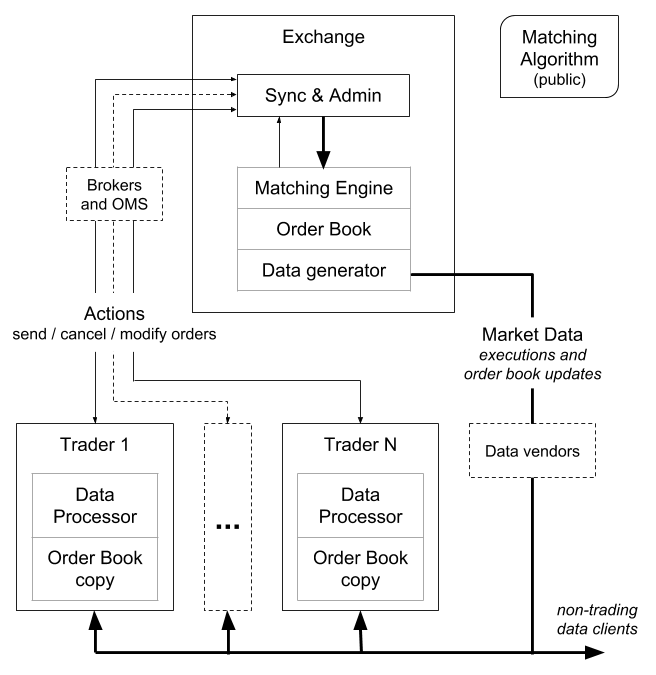
Price, traded volume, and all thousands of market-data-based indicators are all 100% determined by the actions of traders and nothing else. Once an action reaches the exchange and assuming that it is valid, it is processed by a matching engine using a predefined, public, and deterministic matching algorithm. The result of this process may or may not lead to an execution, but it must always lead to an update of the order book. Consequently, exchange generates corresponding market data, still in some deterministic way based on what happened. Therefore, any market data-based indicator including the price itself (in the form of best Bid/Ask, Last Trade, or anything else) is determined by the actions of traders.
Price modeling vs orders modeling
Many trading strategies and studies are based on mathematical modeling of price behavior, including the usage of random walk models. But since the price is a direct function of orders, modeling the behavior of orders can be more fruitful, including modeling a random market by using random orders which represent uninformed traders. This is because the same action, e.g. buy 1000 units at market price, can lead to different results depending on the current state of the order book, i.e. previously sent actions. As a bonus, such modeling of the market allows greater flexibility while still being simple.
Trading Strategy Based on Market Mechanics
A trading strategy grounded in market mechanics focuses on the order book, matching algorithms, and trader actions. For example, analyzing how aggressive orders consume liquidity can help in timing short-term trades.
- Scalpers may watch queue position and speed of execution.
- Swing traders may focus on how resting liquidity accumulates around key levels.
This bridges the theory of market microstructure with practical application.
Wars do not affect the market
..., i.e. not directly. Any events, whether scheduled or unscheduled, anywhere on Earth or outside can affect only the decisions of traders, their actions, and as a result -- the market. This is why observing via the market data the actions of those who are the first to respond, such as Market Makers and high-frequency traders (HFT) in general, is in a sense the fastest global news feed [1].
There are no 'macro' events in the market
... i.e. formally, any macro event is a cumulative effect of micro-events - the orders of traders, which are processed by exchanges typically in microseconds. Long-term investors may use monthly candlesticks to analyze the major price movements over the last decade. Understandably, they don't need to analyze terabytes of raw market data during that period. But it's useful to know that if they decide to process such data, they would calculate exactly the same monthly candlesticks. It's just that someone else already did it for them.
Put your money where your mouth is
This saying, although a little rude, has a basis. Market data is always a history. Traders watch it to make a prediction about the future. Even if they watch it to develop a trading strategy, the purpose is to be able to make a better prediction in the future. That includes all types of traders from long-term investors to HFT. But since market data is generated by the activity of traders, observing it is in a sense, an attempt to understand what other traders think about the future.
It’s reasonable and supported by pieces of evidence that when people bet on future events with real money, their biased views and wishful thinking have a lower impact on their decisions [2]. Such betting systems provide a more accurate prediction than polls even for hardly predictable political events or the results of football games. Observing these risk-taking votes allows even non-participants to understand better what do participants think about the future and to filter out potential bias or wishful thinking.
The analogy with markets is straightforward: these risk-taking voters are traders who actually place orders (unlike, for instance, educators and commentators who don't). But in regards to trading, this method of truth extraction is much more powerful because, unlike football fans, traders actually play and thus affect the price. Moreover, as shown above, traders are the only ones who affect it. That also includes manipulation and deception tactics by large traders. In fact, it's the reason why such tactics are being used -- exactly because they affect the market. But they affect it indirectly, through the actions of other traders who observe them. Unlike fake large orders, real orders affect the market directly.
Know the rules of the game
Trading is a multiplayer real-time game. Like in most such games, there are winners and losers, but that competitiveness is what makes such games interesting. In trading, the rules are determined by exchanges in the form of matching algorithms and sometimes different latency priorities. These rules may favor certain types of market participants such as registered Market Makers by offering them higher matching priorities or even by adding artificial speed bumps for other traders (scroll down for Latency). But these rules can be considered fair simply because they are public. Traders who know the rules of the game can adjust their trading strategy accordingly, or walk away to markets with better rules, or decide not to trade at all.
How to Trade Using Market Mechanics
Trading with market mechanics involves applying knowledge of exchange rules, order types, and latency. By knowing how the matching engine prioritizes orders, traders can decide whether to act as a market taker or a market maker. Understanding these mechanics gives traders an edge in execution and risk control.
Factors for success in trading
There is a number of factors that make trading more successful, such as:
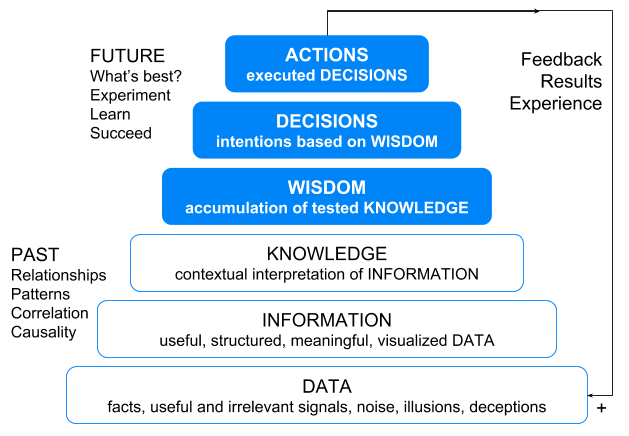
- Having an access to high-quality data
- Ability to convert available data into information and knowledge using strong infrastructure, analytical tools, and high-quality visualization
- Wisdom to develop effective tactics based on knowledge, the ability to predict future events (including one's own impact), and to manage the risks
- Speed of data processing and execution of actions, i.e. latency and infrastructure
- A brute force that can simply move the market in the desired direction
Together, these factors give an even stronger competitive advantage than a sum of them because they complement each other and depend on each other. For instance, fast execution of a wrong prediction of price direction leads to a worse execution price than slow execution of the same decision.
How to Analyze Market Mechanics
Analysis starts with observing how orders enter, rest, and get executed in the book. Key elements include:
- Matching algorithms (FIFO, Pro-Rata).
- Commission structures for makers vs takers.
- Latency effects during bursts of activity.
By breaking down these moving parts, traders learn how market dynamics unfold in real time.
Orders
Orders are the most basic elements in trading, but at the same time, as shown above, the only elements that affect the market. An order is a set of parameters defined by traders.
Market order is the most basic type of order and has just two parameters:
- Buy or Sell
- Size
All other types of orders inherit the definition of Market order and extend it with additional parameters.
Limit order, the most frequently used type of order, adds the price parameter:
- Price (this instructs the exchange that the order must not be executed at a worse price than specified)
Iceberg order adds another parameter:
- Maximum displayed size (The tip of the iceberg, instructs the exchange not to display more than specified of the total order size)
See also: Stops & Icebergs On-Chart Indicator and Stops & Icebergs Sub-Chart Indicator
Stop order is a conditional order. It adds a condition parameter:
- Stop price (instructs the exchange to publish/release the order only if a trade occurs at equal or worse than the specified price)
Examples of Market Mechanics Trading Strategies
Examples include:
- Fading liquidity when large resting orders are repeatedly tested but not consumed.
- Joining momentum when aggressive orders sweep multiple price levels quickly.
- Exploiting maker vs taker fee differences in high-volume markets.
There are many other types of either instant or conditional orders which use additional parameters including time-in-force (TiF) that tells the exchange when the order can be published/released, chains of orders, and so on. Exchanges may offer to traders additional types of orders with any level of customization. Intermediate parties such as brokers and order management systems (OMS) may offer even more flexibility while managing the orders in the exchange co-located facilities which allows sub-millisecond response time.
Actions of traders
The set of actions available to traders didn't change significantly over centuries and probably millenniums since the first sort of trading venue was established. What has changed significantly is the speed in which these actions can be delivered to the exchange and the speed at which exchanges process them and provide corresponding feedback. Also, market data has changed significantly, mainly because of improved technology & bandwidth. Market data today allow much greater market transparency.
The exact list of actions that are available to traders and their parameters is defined by exchanges, but typically there are just two or three of them. Assuming regular limit orders, it looks like this:

Actions can be rejected due to insufficient funds, invalid parameters, or if referenced order doesn't exist anymore (canceled or executed), etc. Additional responses of exchange include updates of orders' status such as partial or full execution, cancellation confirmation, and so on. Also, most exchanges but not all (e.g. not supported by GDAX exchange) allow order modification as follows:

Order modification is in a sense a redundant action because it can be replaced by canceling the order and sending a new one. But modify action allows to reduce the latency because both of its sub-actions are performed instantly in the exchange and allows to avoid the risk of undesired exposure due to the in-flight condition: for instance if trader sends a pair of actions to cancel/send when they reach the exchange the order may already be executed, but the new order can still be accepted. Also, if the requested modification only reduces the order size within the same price, the order keeps its position in the orders queue.
Order Book
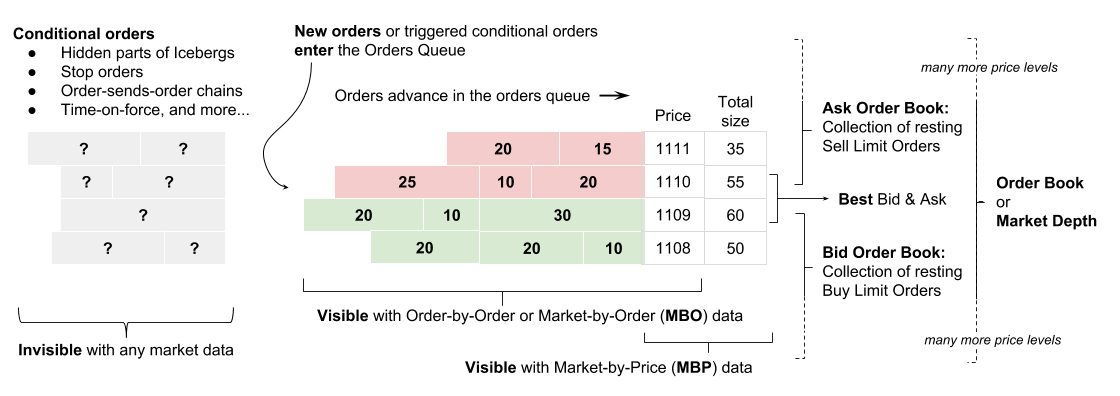
Order book is a collection of orders of traders, constructed by matching engines of exchanges. It consists of:
- Visible in market data collection of limit buy and sell orders (the order book). These orders are resting in the order book because their limit price didn't permit yet their match/execution
- Invisible in market data conditional orders. These orders have a certain trigger or condition to be published/released by the exchange and to become visible.
The collection of orders at the same price level is called an order queue. Orders can advance in the queue when other orders in front of them are canceled or executed/matched with new arriving orders. The arrangement of orders in the queue and the priority of their execution is determined by the matching algorithm as will be shown further.
Market Data types
The order book changes only when traders conduct new actions or if conditional orders are released according to their time-in-force settings. Consequently, exchanges generate market data and inform traders about what has changed. Today there are two main distinct types of market data.
Market by Price
Market-by-Price (MBP) describes a price-based data feed that provides the ability to view the total size of all orders at each price level. MBP can describe either full market depth or a limited number of nearest Bid and Ask price levels, e.g. 5, 10, or 20 price levels.
Market by Order
Market-by-Order (MBO) or Order-by-Order describes an order-based data feed that provides the ability to view individual orders and their evolution. The order's information contains its unique Order ID, limit price, size, and its location in the queue. MBO typically provides full market depth, describing orders at each price level. This is the more modern and more transparent type of market data.
Other types of market data
Candlestick charts are built by aggregation of initially limited market data of last trades only (Times & Sales) which consist around 5% of the market data (or information).
What Are the Key Principles of Market Mechanics in Trading?
The core principles are:
- Orders are the foundation of all price movement.
- Matching engines apply deterministic rules (FIFO, Pro-Rata, etc.).
- Market data reflects every trader action in real time.
- Latency and speed shape who captures opportunities first.
Comparison of quality of market data sources
Did you know? Bookmap allows users themselves to compare market data of 2 or more different data vendors. The time range can be either hours or milliseconds. Here is an example: [3]
Commissions
Commissions that exchanges charge for matching and execution between orders are the main source of their income. They aim to select a matching algorithm that attracts more traders and increases the liquidity of a particular market or asset.
Market maker vs Market taker
Each trade always occurs between two orders from opposite sides: Buy and Sell. one of the orders must always be a resting limit order while another is the newly arrived order, sometimes called aggressive order. The aggressive order is also called Market Taker while the resting order is called Market Maker, hence the name of a corresponding trading strategy called Market Making [4].
In order to increase liquidity and attract more traders, exchanges may define various commissions structures such as lower (up to negative) commissions for the market makers, and higher commissions for the market takers. Both matching algorithm and commissions structure affect the trading strategy of traders and thus the behavior of a particular market. For instance, the commissions for XBTUSD at BitMEX is -0.0250% (negative) for the market maker and 0.0750% for the market taker, which is ~5 points of its price 6735. To execute an order as a market taker, the trader needs to anticipate price movement of at least 5 points. As a result, it's noticeable that price typically moves in steps of 5 points or more:

Here is such a move in a higher resolution. The intensive attempts of traders to execute their orders as market makers and receive commissions instead of paying them are also noticeable.

Matching Algorithms
The exact algorithm of processing new actions of traders is defined by the Matching Algorithm which is a part of instrument/asset specification. There is a variety of matching algorithms, even within the same exchange. For instance, here is an overview of CME matching algorithms, followed by their detailed description. The most popular matching algorithm is FIFO, described in detail below. The next most popular matching algorithm is Pro-Rata, which matches orders according to their size and thus allows execution of orders at the end of the queue as well. In general, exchanges select the matching algorithm which satisfies best the traders of a particular market, thus increasing the liquidity of that product and traded volume, and thus the income from commissions.
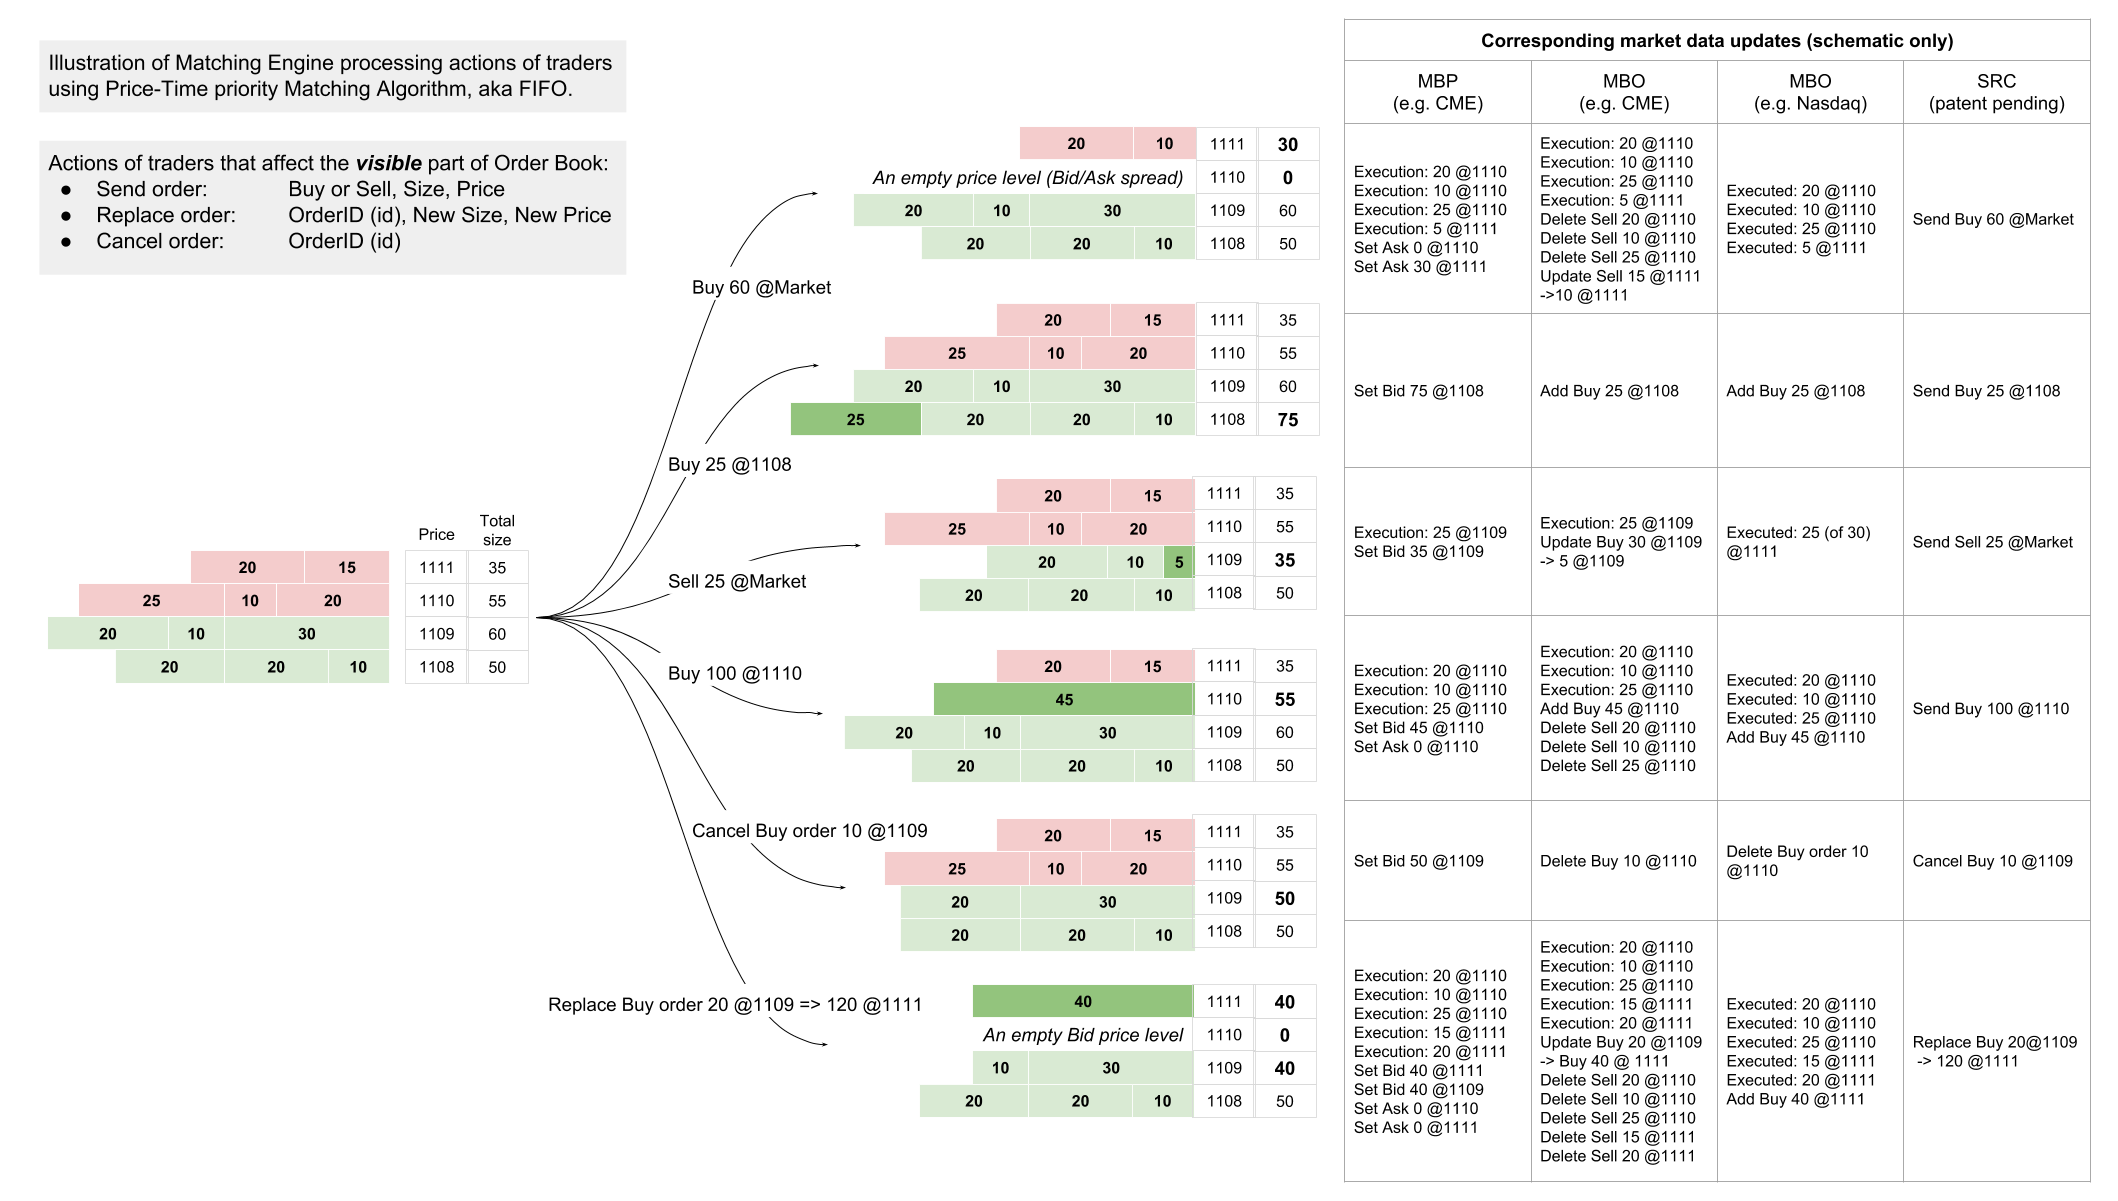
Standard Matching Algorithm: Price-Time priority
Price-Time priority (aka FIFO: First-in-First-out) is probably the most widely used matching algorithm, for instance, it is used by CME for E-mini S&P 500 (ES) futures.

Here is an illustration of this process:
Latency
As shown on the top diagram, latency comprises of three components:
- The speed of receiving market data
- The speed of processing market data taking into account trader's own status
- Round-trip-time (RTT) is the time period from sending an order (or cancellation or modification) until receiving corresponding feedback from the exchange. It comprises two ways latency and exchange processing time. Traders typically need to get a status update about their previous action before conducting a new one. Otherwise, they may encounter the risk of higher than desired exposure.
Why low latency is important
Traders aim to get the advantage of short-term trading opportunities such as arbitrage between correlated and dependent on each other markets, fundamental factors, the behavior of other traders, and so on. There is a large number of trading styles and motivations, well covered and structured by a zero-sum article from 1993 [5] (see tables at the end). Low latency allows getting the advantage of short-term trading opportunities earlier than other traders who noticed the same opportunity. If executed earlier, the other traders will move the price in the desired direction by their actions but may have worse execution prices, and vice versa [6].
Atomic Processing Of Orders
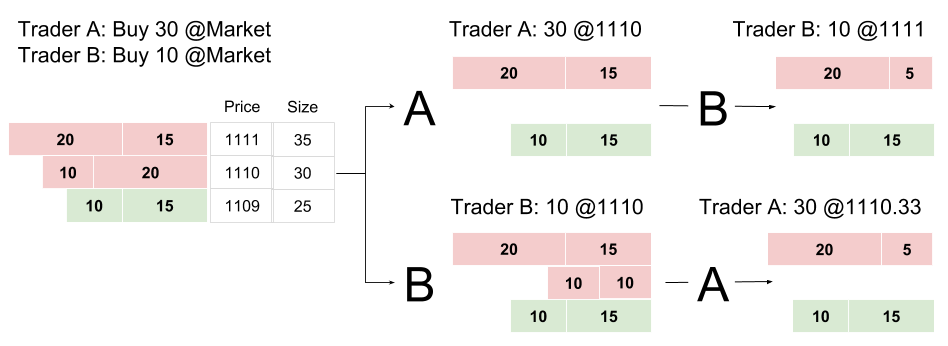
Traders send their actions asynchronously and may have different latency to the exchange due to geographical location or different infrastructure. These actions must be synchronized at the exchange because different orders of processing of any two actions may lead to different results as shown in this simple example. Typically actions are synchronized according to the order of their arrival (even if two actions arrive at the same nanosecond, there is still the first one). In practice, exchanges may use a smarter approach, allowing to process actions in parallel (e.g. two orders being canceled), but only if the result is the same as if they were processed in an atomic manner. As shown in the Latency section, exchanges may use artificial speed bumps and offer a highway for preferred market participants such as registered market makers. Still, there is an atomic synchronization that takes place at some level before Matching Engine, but it is done by a different logic.
Case Study: Artificial 'Speed Bumps'
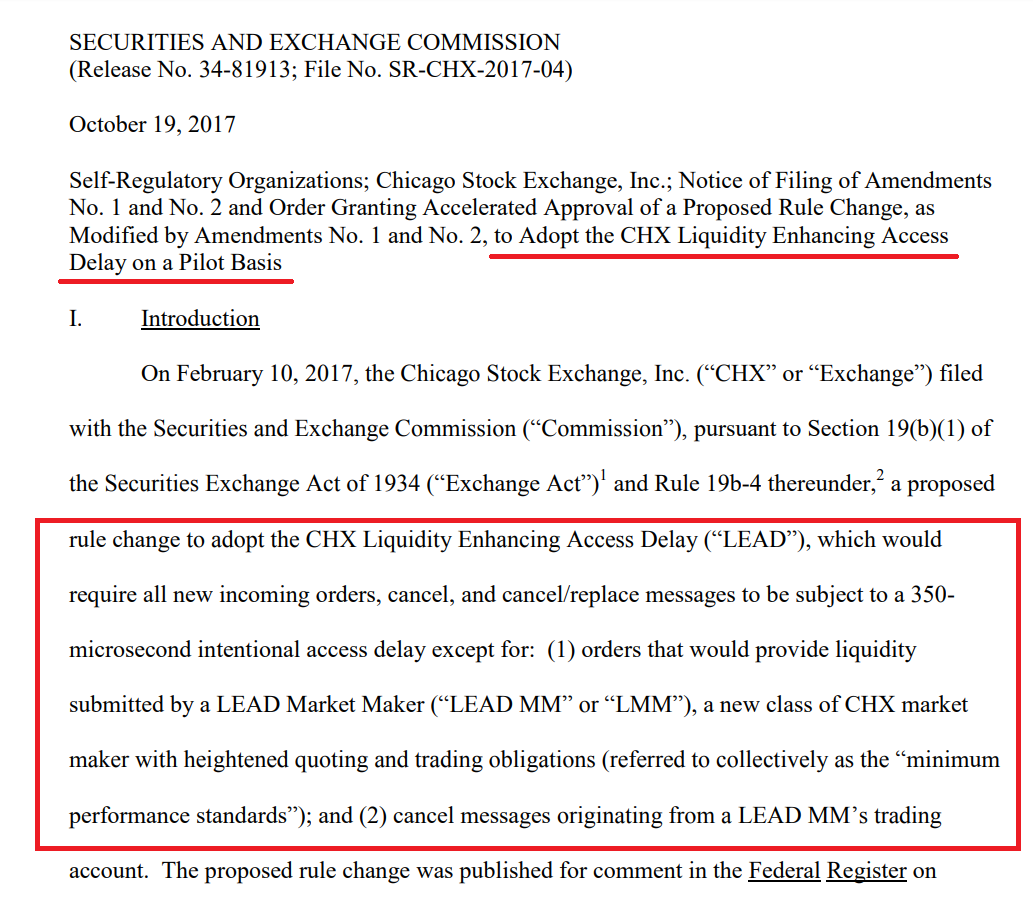
Chicago Stock Exchange (CHX) was the first to propose artificial Speed Bumps which should artificially delay incoming traders' actions by 350 microseconds except for the actions of particular market makers who are allowed to use the highway. At first, it was rejected as being discriminatory and because technically it can lead to the following situation: ...concern is that a delayed message might well be delayed for 351 microseconds, 500 microseconds, thousands of microseconds, or even until next Tuesday while the participant submitting that message waits for its message's disposition [7]. But later the proposal was approved not only for CHX but also for NYSE [8] and other stock exchanges including not only incoming messages but also outgoing messages. One of the arguments for the approval was that exchanges already give an advantage for registered market makers in various forms including, for instance, determining the position on the orders queue based on FIFO with LMM Matching Algorithm which is an enhanced FIFO algorithm that allows for LMM allocations prior to the FIFO allocations [9]. Artificial speed bumps in effect provide a very similar advantage for preferred by the exchange market participants.
This study case alone demonstrates the importance of latency and the importance of knowing the rules of the game prior to participating in it.
Latency vs decision quality
Low latency amplifies both good and bad decisions, leading to better or worse results accordingly. For instance, fast execution of a bad prediction of price direction leads to a worse execution price than slower execution of the same decision.
Some trading opportunities are very obvious. For instance, when a sharp move occurs at one of two highly correlative markets when this information reaches traders, it almost certainly will affect their decisions about the other market and thus affect its price. In such scenarios, speed is the crucial (and sometimes the only) component of successful arbitrage.
Market Mechanics Trading for Specific Markets
Market Mechanics Trading for Day Traders
Day traders can use microstructure to time entries and exits with precision, especially during volatile events. Watching how aggressive orders consume liquidity offers clues about short-term direction.
Most typical mistakes in Quantitative analysis in trading
There is a number of counter-intuitive mistakes that can be made during the development and operation of an automated trading strategy. Here are just two of them, both are related to wrong assumptions about historical data during the development of a strategy. The only 'treatment' in both cases is real trading or trading in an equally competitive and interactive environment.
Algorithmic Trading with Market Mechanics
Algorithmic systems rely heavily on mechanics: queue position, latency management, and liquidity detection. Many algos are built to exploit these micro advantages systematically.
Emulation of latency
Here the mistake is an assumption of a constant uniform latency. In fact, the latency (RTT or especially latency of market data) has typically very fat-tailed distribution. For instance, the difference between exchange timestamps and timestamps measured by a co-located server is maybe 1 millisecond on average while only 0.01% of data updates have latency above 100 milliseconds. It would be a mistake to ignore these outliers in simulations. But it would be an almost identically bad mistake to assume that these outliers appear randomly by, for instance, using the historical fat-tailed distribution of latency and generating it randomly in simulations. These outliers are highly correlated with bursts of activity on the market and because the matching engine becomes overloaded. In other words, latency has a conditional distribution depending on bursts of activity in the market, which are typically hard to predict in advance. These bursts of activity indicate that many data-driven trading strategies simultaneously spot the same trading opportunity (or rush to cancel their orders), which means this market situation is pretty obvious to many of them. It's therefore expected for a reasonable pattern detection AI/ML algorithm to find the same opportunities in the historical data. Moreover, given a trade-off, it will sacrifice less obvious but potentially real patterns in favor of obvious but illusionary patterns. If during simulation it assumes the average latency, e.g. 1 ms, it will obviously demonstrate great results, which is an illusion. On the other hand, assuming much higher latency, e.g. 100 ms would significantly distort the simulation because the actual average latency is 1 ms. Also, there are always even farther outliers, e.g. 500 ms latency that occurs in 0.0001% of the data.
This problem is equally relevant for much lower frequency trading strategies including those that use daily data samples, e.g daily candlesticks.
Emulation of Own Impact
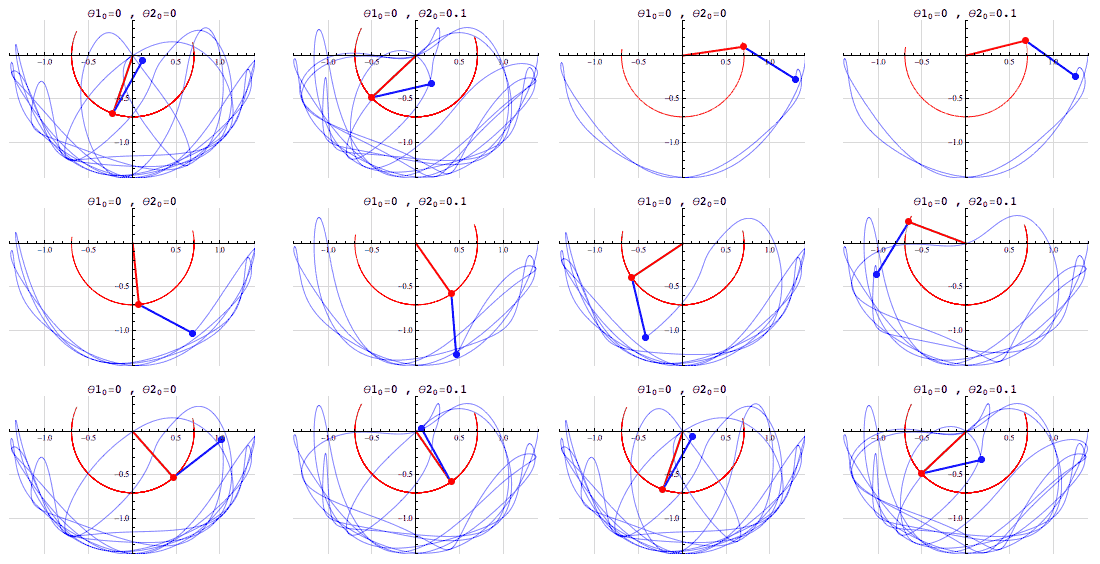
Here the mistake is an assumption of negligible impact of simulated on historical data strategy on market data and on other market participants. The market data wouldn't be the same because trading actions that don't affect the market simply don't exist. The only question is how much would it change the market. Because trading is an interactive process, even relatively small additional activities would impact the data and also trigger different reactions of other market participants, creating a cumulative effect much stronger than added activity. Such cumulative effect of tiny actions is similar to the behavior of a chaotic system, i.e. where infinitesimal differences in the starting conditions lead to drastically different results as the system evolves as shown in this animation.
Timestamps in Bookmap
Bookmap allows to zoom-in to nanoseconds, which is the resolution of its timestamps. This obviously isn't necessary for a chart trader. But whether you use milliseconds, microseconds, or nanoseconds, such timestamp requires a 64-bit Integer. Even seconds timestamp will require 64-bit in several years from now. So, there is no disadvantage of using nanoseconds timestamps in the application. The advantage however is that it is useful for HFT firms who use the Bookmap Quant solution to visualize data with timestamps recorded at exchange co-located servers where some firms may use GPS clock with 100 nanoseconds precision.
By default, Bookmap displays timestamps of receiving the data and orders updates on the client-side, using its computer clock. This is useful for traders regardless of their latency to the exchange because it shows where they could potentially act and where they actually acted. It takes into account potential packet loss during transmission or short-term disconnections, which also allows traders to be alerted in such cases. Displaying exchange timestamps during such cases or within high or non-uniform latency, in general, would mean changing the history from a trader perspective. This would not explain to the trader high slippage during correct decisions. Also, displaying the chart with data receiving timestamps guarantees that market data is stored in chronological order when connecting to low-quality data vendors who may, for instance, provide trades, BBO, and market depth asynchronously.
Implementations
It's easy to imagine that ancient traders were interested in faster ships and horses to reduce the latency. Today commercial firms invest hundreds of millions USD in layering cross-Atlantic cables under the ocean, reducing the latency by a number of milliseconds and being almost solely purposed for (and afforded by) HFT firms. Another direction being developed and already offered is radio communication, which allows communication almost at the speed of light 0.99c while cable communication speed is ~0.8c. It's possible that HFT firms in the future may use neutrino-based communication because neutrinos can travel at the speed of light 1c through the Earth's core instead of traveling around the Earth like radio waves do [10].
Market Mechanics FAQ
Are you looking for a specific market to trade?
Market mechanics apply to futures, stocks, and crypto. The principles are the same, though each market has different rules and venues.
Are you a beginner or an experienced trader?
Beginners can start by learning order types and how exchanges process them. Experienced traders often dive deeper into latency, matching algorithms, and fee structures.
Are you interested in a specific indicator for this strategy?
Bookmap offers tools like the Stops & Icebergs indicator and full depth heatmap, which translate market mechanics into clear visuals for traders.
Market Dynamics Trading Strategy
Market dynamics describe how orders, liquidity, and trader behavior interact. A trading strategy based on these dynamics blends market structure analysis with order flow, helping traders understand not just where price is, but why it is moving.
Useful links
--- Market Makers as a news feed
--- How to compare the data from different market data vendors
--- Practical use of Zero-Sum-Game principle in trading
--- Styles and Motivations of traders and relationship between them