See stock more clearly in real time.
Compare plans to access deeper market visibility for stock.
Stocks
October 22, 2024
Updated
SHARE
Top Stocks to Buy Now: Leveraging Market Data for Smart Investment Decisions

Recently, due to the ongoing uncertainty, the New York Federal Reserve’s model has suggested a 58.3% likelihood of a U.S. recession within the next 12 months. In 2024, many investors were expecting more modest gains and the S&P 500 even showed strong performance in the first half. The index was fueled by optimism that the Federal Reserve would manage to slow inflation without causing a recession (a “soft landing”).
Despite this, recent market conditions have become more volatile. They are indicating upcoming uncertainties about the economy’s future direction. In this unpredictable market environment, we have identified five top stocks that could be “strong buys.”
In this article, we’ll start by looking at the broader market trends and what’s currently driving stock performance. Next, we’ll focus on specific sectors that are outperforming, such as healthcare, renewable energy, and consumer spending. Additionally, you’ll learn about five top stocks to consider right now: Palo Alto Networks, Marathon Digital, Chevron, Dominion Energy, and Deere. Lastly, you’ll understand the usage of our advanced market analysis tool, Bookmap, and explore how it offers real-time market insights through its modern features. Let’s begin.
Current Market Overview: What’s Driving Stock Performance?

Firstly, understand that the stock market is shaped by several key trends. Commonly, these include:
- Economic indicators, like GDP growth rate, unemployment rate, and more.
- Interest rate changes.
- Sector-specific developments.
Recent data shows that the U.S. GDP growth rate was 3% in Q2 2024. This signals a stable economy and is boosting stock prices. The unemployment rate of 4.2% in August 2024 (reduced by 100 basis points from the previous 4.3%) reflects a strong labor market. Consumer spending is being driven by this factor, which is benefiting sectors such as retail and services.
Moreover, the technology sector continues to thrive. The NASDAQ Composite Index is up 15% year-to-date. This growth is fueled by ongoing investments in AI, cloud computing, and other digital innovations. However, the Federal Reserve’s interest rate is set at 5.50% as of September 2024. The increased borrowing costs are having a detrimental effect on interest-sensitive sectors like real estate and utilities.
Now, let’s check out some sectors that are currently outperforming in 2024:
| Healthcare | Renewable Energy | Consumer Spending |
|
|
|
Identifying High-Potential Stocks Using Market Data
To identify stocks with strong growth potential, traders use various market data points. See the graphic below:
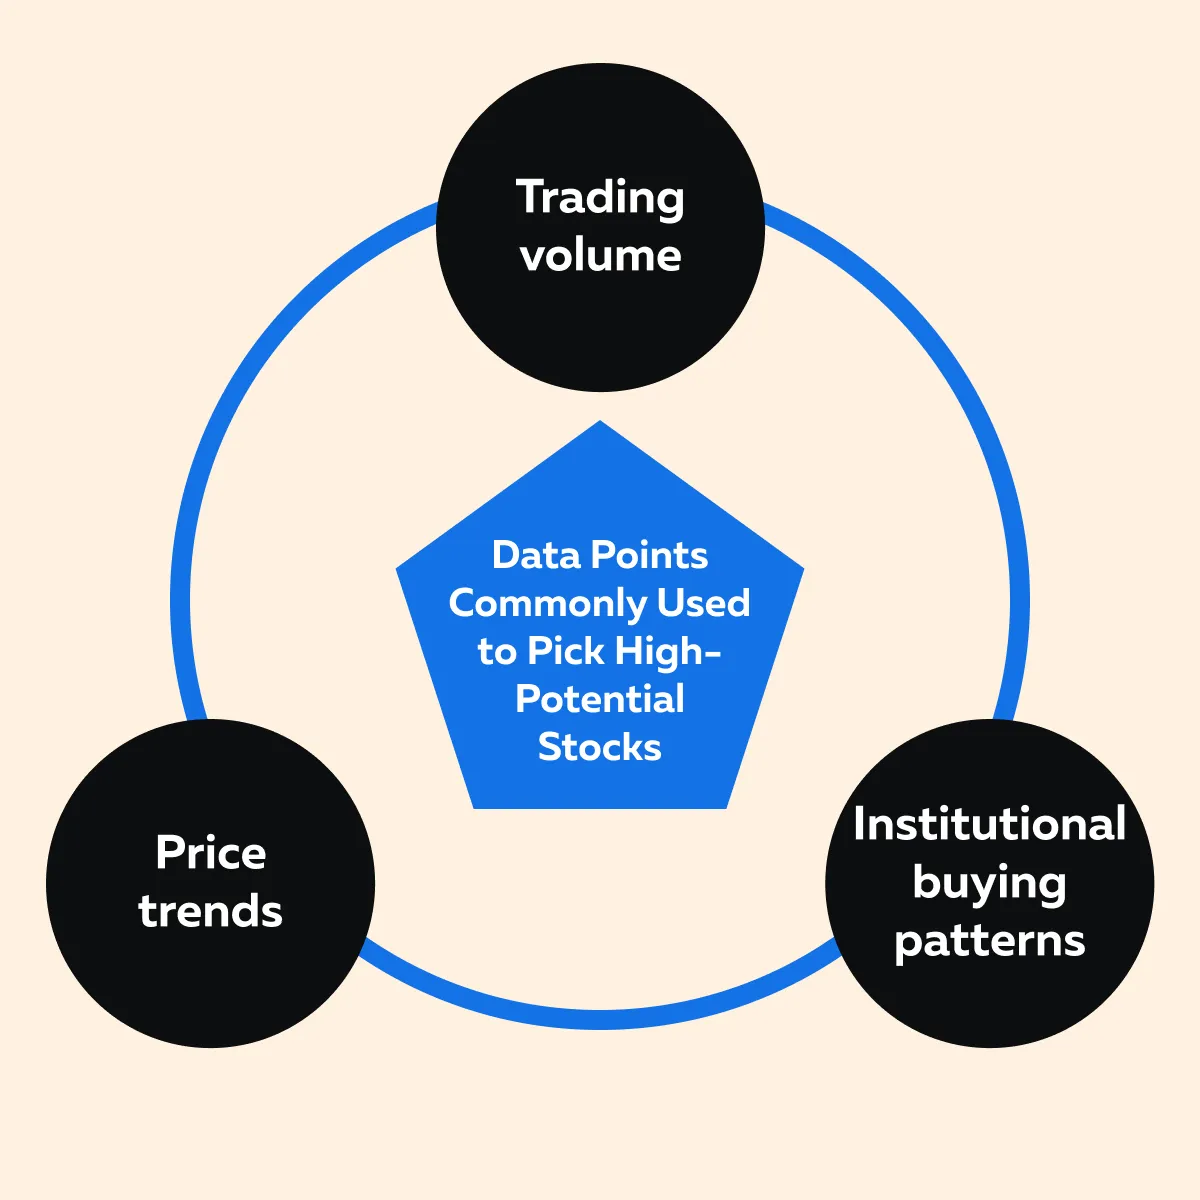
These data points provide insights into market sentiment and potential stock performance. Let’s understand them in detail:
- A) Trading Volume
Trading volume indicates the number of shares being traded over a specific period. Generally, high trading volume combined with price movement indicates an increased interest in a stock. For example,
- Say there is a spike in trading volume for a stock.
- This spike is paired with an upward price trend.
- This combination suggests that the stock is gaining momentum.
- It indicates a good buy opportunity as there is growing demand for the stock.
- B) Price Trends
Price trends provide a visual representation of a stock’s performance over time. Upward price movements (bullish trends) signal increasing investor confidence. By tracking long-term and short-term trends, traders can spot potential “inflection points” where the price may rise further.
- C) Institutional Buying Patterns
When large institutions (like hedge funds or mutual funds) buy a stock, it can be a strong indicator of confidence. Institutional activity often creates upward pressure on stock prices. This usually happens due to the sheer volume of shares involved in their purchases. By monitoring institutional buying patterns, traders can identify stocks that may be poised for growth.
Key Indicators for Identifying Stock Opportunities
Apart from data points, traders also rely on technical indicators to:
- Interpret market data,
and
- Spot buy or sell signals.
Read the table below to learn about some commonly used indicators and their usage:
| Relative Strength Index (RSI) | Moving Averages | Volume Weighted Average Price (VWAP) |
|
|
|
Enhance your stock picking with our advanced analytics. Join now!
Using Bookmap to Analyze Stock Opportunities
Bookmap is our advanced market analysis tool. It provides traders with detailed visualizations of market depth and order flow. By using it, traders can easily check where large orders are placed by understanding the real-time buying and selling pressure. Now, let’s have a look at some of its modern features:
Heatmap for Market Depth

Bookmap’s heatmap feature visually represents market depth. It shows the resting orders at different price levels. The heatmap also uses color intensity to indicate the size of the orders.
This allows traders to easily identify key price levels where substantial buying or selling interest exists. Moreover, traders can use the heatmap to spot areas with large buy or sell orders, which can act as support or resistance levels. Let’s understand better through an example:
- Say a trader is analyzing the heatmap for a particular stock.
- He notices a large “buy wall” forming at $50.
- This suggests that many buyers are willing to purchase stock at that price.
- This provides a strong level of support.
- If the stock price drops to $50, the trader views this as a good entry point.
- That’s because the buy wall indicates strong demand at that level.
- Also, it increases the likelihood of a price rebound.
Order Flow Analysis
In addition to the heatmap, Bookmap provides real-time order flow analysis. It shows the flow of buy and sell orders as they occur. By monitoring order flow, traders can check the buying and selling pressure behind a stock. This helps them make more confident trading decisions. Additionally, it also helps in confirming a bullish trend. Let’s see how:
-
- A trader notices a stock moving upward.
- They want to confirm whether this bullish trend has strong support.
- By analyzing Bookmap’s order flow data, the trader sees a series of large buy orders being executed at increasing prices.
- This indicates that buyers are pushing the stock higher.
- With this confirmation of strong buying pressure, the trader feels confident that the bullish trend is likely to continue.
- They decide to enter a long position.
5 Best Stocks to Consider Right Now

In September 2024, you can consider investing in these 5 stocks:
- Palo Alto Networks
- Marathon Digital
- Chevron
- Dominion Energy
- Deere
These companies are seen as strong investments due to their industry positions, growth potential, and financial stability. Let’s understand what makes them an attractive investment option:
#1. Palo Alto Networks
The company is performing well in the growing cybersecurity market. It is popular with investors because of the increasing need for online security. Also, Palo generates stable revenue through its subscription model.
In its fiscal 2024 fourth-quarter earnings report, the company showed 12% sales growth compared to last year. This was slightly slower than the 16% growth for the entire year. However, this was still better than expected and is purely driven by high demand for its advanced security platform.
Financially, Palo Alto Networks is even stronger. Its adjusted profit margin improved to 27%, and both sales and net income more than tripled. The company is strategically balancing growth and profitability. For fiscal 2025, management expects:
- More solid sales growth
- Further improvements in profit margins with an aim for a 30% margin
With these positive trends, the stock remains valuable. Many believe it will reach new highs and thus it is a good candidate for investors to consider.
#2. Marathon Digital
Marathon Digital is a Bitcoin mining company. It is in a strong position for future growth as experts predict Bitcoin’s price will rise, especially after a recent event called the “halving” (reduces the supply of new Bitcoin). This could lead to a significant increase in value through 2024 and 2025.
While some miners are struggling after the halving, Marathon Digital stands out due to its strong financials:
- $256 million in cash
- 25,000 Bitcoin (worth around $1.5 billion)
- Only $250 million in debt
The company is expanding its mining operations by buying more Bitcoin. Also, it is helping the Kenyan government with energy management. Despite Marathon’s solid position, its stock has only risen by 31% over the past year, lagging behind Bitcoin’s 127% increase.
Thus, it can be assumed that this company is undervalued and could benefit from Bitcoin’s future growth.
#3. Chevron
It is a major oil and gas company. Recently, it announced disappointing second-quarter results. This caused its stock to decline and approach its 52-week low. Despite this, the company remains a strong long-term investment opportunity. Chevron missed earnings expectations and faced challenges with a $60 billion acquisition of Hess. It was due to ExxonMobil’s attempts to block the deal over valuable oil assets in Guyana. However, Chevron’s future growth looks promising even without the Hess acquisition.
That’s because the company hit record production levels in the second quarter. Moreover, it expects its free cash flow (FCF) to grow by over 10% annually through 2027 (assuming oil prices stay at $60 per barrel). Chevron is also focused on increasing profitability. The company aims to achieve a return on capital employed (ROCE) of more than 12% by 2027.
Notably, it also has a history of rewarding shareholders with dividends, having raised its dividend for 37 consecutive years. Even if oil prices fall, Chevron’s dividend remains attractive, making it a worthwhile investment.
#4. Dominion Energy
It is a major utility company and is poised to benefit from potential interest rate cuts expected by the Federal Reserve in September. Be aware that rate cuts generally boost the stock market. Now, if we specifically, talk about utility stocks like Dominion, it can gain for two main reasons:
- Reason I: Lower rates make bonds less attractive. They encourage income investors to choose utility stocks, which often have higher dividends.
- Reason II: Utility companies, including Dominion, usually carry significant debt. Due to reduced interest rates, they can lower their borrowing costs.
Additionally, Dominion Energy has a solid forward dividend yield of around 4.8% and expects annual earnings-per-share growth of 5% to 7% through 2029. Also, its strategic location in Virginia (home to the world’s largest data center hub), makes it well-positioned for growth due to the high demand for electricity by data centers.
Given these factors, Dominion Energy is a smart investment choice if interest rates decline as expected. Spot the next big stock with our cutting-edge market data tools. Get started here!
#5. Deere
The company reported a 42% drop in net income for its fiscal third quarter of 2024. However, its stock still rose by 6.2% afterward. This is because investors had expected worse results and were relieved when the company confirmed its earlier projection of $7 billion in net income for the full year.
Investors must understand that Deere’s business is cyclical. Its performance fluctuates with economic conditions, like the:
- The crop prices of the agriculture industry,
and
- Borrowing costs.
Nowadays, although crop prices are down, and farm incomes are declining, Deere remains strong due to its leadership in manufacturing farming and construction equipment. The company also focuses on innovation and invests in technology to help farmers be more efficient.
Additionally, Deere continues to buy back stock and increase dividends. This makes it appealing to investors. With a relatively low price-to-earnings ratio of 15.3, many see it as a good long-term value investment.
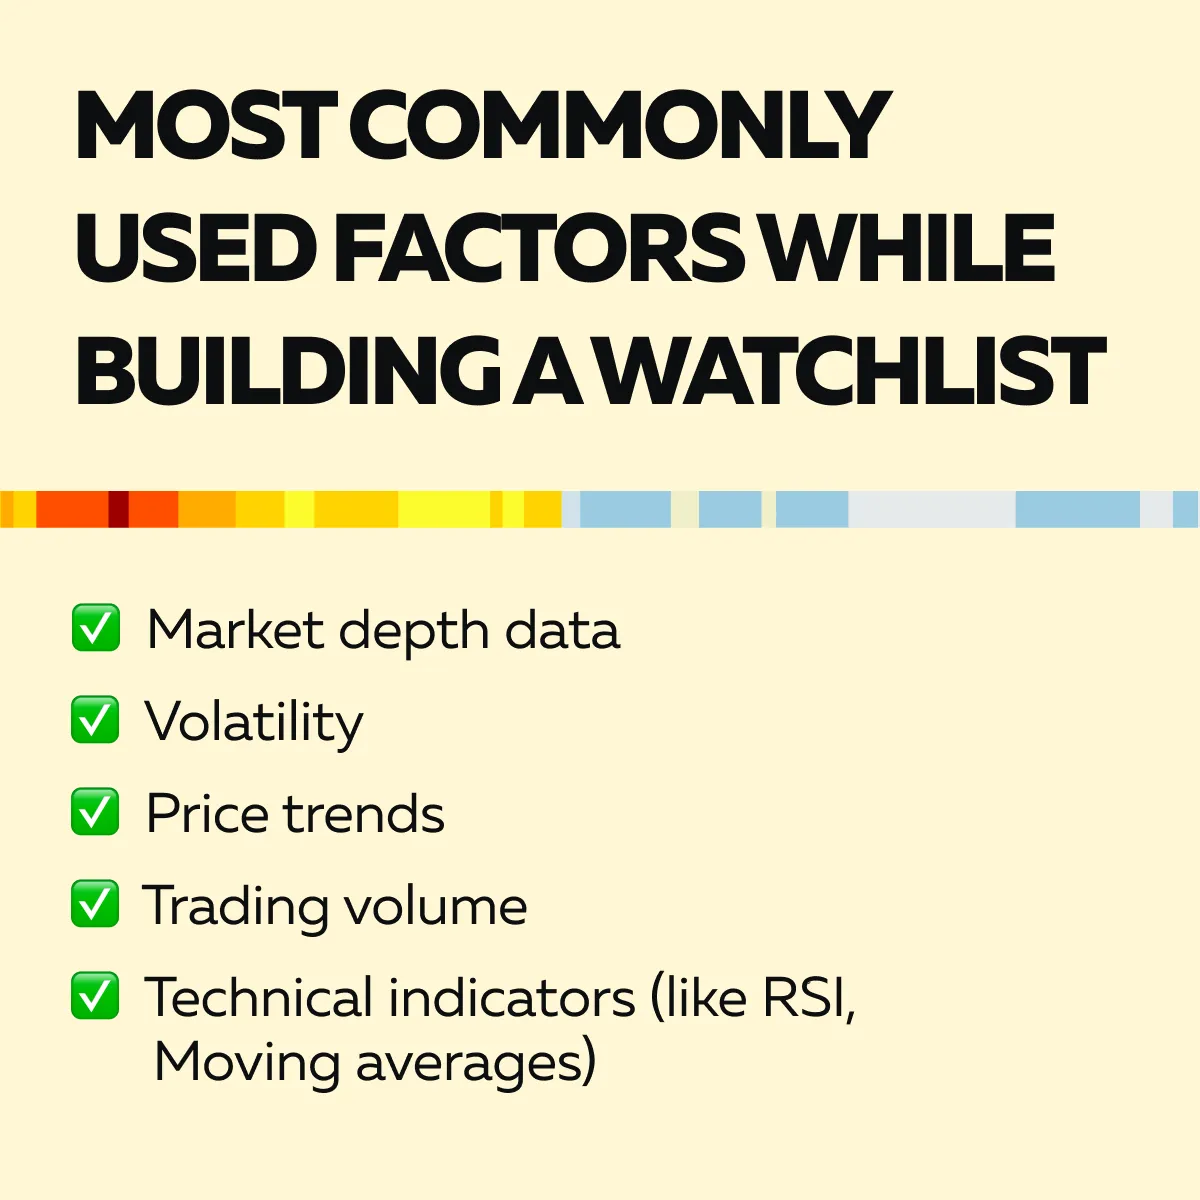
Building a Watchlist with Market Data
A watchlist allows traders to track and monitor potential stock opportunities based on:
- Key market data,
and
- Indicators.
By carefully selecting and updating a watchlist, traders can stay informed about market movements. Next, when building a watchlist, traders should focus on key data points and technical indicators. See the graphic below to learn about some commonly used factors:
Now, let’s see how you can create a watchlist using market data and indicators:
Step I: Select Stocks for the Watchlist
- Start by identifying stocks that show promising price trends or exhibit strong trading volume.
- Choose stocks that are near significant technical levels (e.g., approaching their 50-day moving average).
- Alternatively, you can also pick stocks that have experienced a spike in trading volume. These are usually good candidates for further monitoring.
Prefer using our market analysis tool, Bookmap. It can help you identify stocks where large orders are concentrated, or where the order flow suggests a potential breakout or reversal. Be aware that stocks with notable market depth activity are ideal candidates for inclusion on the watchlist.
Step II: Regular Updates with Bookmap and Other Tools
A watchlist should be regularly updated. It must reflect the most current opportunities in the market. By using our Bookmap, traders can monitor stocks for any significant changes in:
- Market depth,
- Order flow, or
- Price movement.
Moreover, Bookmap’s real-time data can reveal sudden shifts in buying or selling pressure. Usually, this prompts the addition of new stocks to the watchlist or the removal of stocks that no longer show potential. Identify top stock opportunities with our real-time data analysis. Sign up today!
How to Track Performance and Adjust Positions?
Once the watchlist is established, it’s important to continuously track the performance of each stock. Also, you will be required to adjust positions based on evolving market conditions. Let’s see how you can do so:
- Monitoring Key Indicators
Traders should regularly check key indicators (e.g., moving averages, RSI, VWAP) for stocks on their watchlist to identify entry and exit points. For example, if a stock on the watchlist crosses above its 50-day moving average with strong volume, it could signal an opportunity to buy. Whereas, if the RSI indicates overbought conditions, you can prefer taking profits or reducing exposure.
- Adjusting Positions
As the market evolves, traders must “rebalance their portfolios.” This can be done by adjusting their positions. Stocks on the watchlist that show signs of weakening (e.g., breaking below support levels or showing declining order flow) can be removed or placed on hold. On the other hand, stocks showing strength or breakout potential can be prioritized for trades.
How to Set Alerts for Key Levels?
To stay proactive and avoid missing opportunities, traders should set alerts for important price levels or indicator thresholds. Most traders prefer doing so in the following ways:
| Method I: Key Price Alerts | Method II: Indicator Alerts |
|
|
Conclusion
In the current market environment, with economic uncertainties and predictions of a U.S. recession, investors are focusing on stocks that can offer strong returns. Based on a strong fundamental and technical analysis, these are five stocks worth considering in September 2024: Palo Alto Networks, Marathon Digital, Chevron, Dominion Energy, and Deere. Each of these companies has solid growth potential and financial stability.
However, it is necessary to perform your own research and it can be done using market data such as trading volume, price trends, and institutional buying patterns. Also, certain key technical indicators can be used like the Relative Strength Index (RSI), Moving Averages, and the Volume Weighted Average Price (VWAP). They help spot buy or sell signals.
To gain a competitive edge, traders can also use our advanced market analysis tool “Bookmap.” It offers modern features like heatmaps and order flow analysis that allow traders to visualize market depth and track real-time buying and selling pressure.
By monitoring these indicators and using Bookmap, traders can even build and maintain a watchlist of promising stocks. We will help you to stay on top of potential opportunities. Join Bookmap today!
Sign Up Now