
How order flow analysis can enhance cryptocurrency trading?
According to Google trends, Cryptocurrency, Bitcoin, and blockchain are among the most popular search queries for the past two years. Comparing the charts of Google requests and Bitcoin price evolution during the same period, the high correlation between the two cannot be missed.
Higher Bitcoin prices were matched with higher levels of interest in cryptocurrency. Ultimately, the prices for main cryptocurrencies have fallen sharply, and 90% of traders have lost not only the interest but most of their capital.
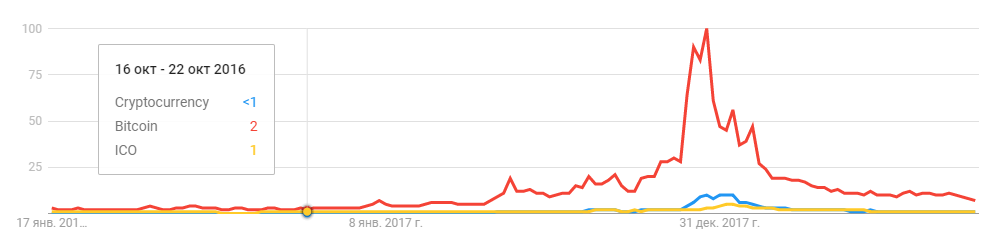
Comparison of the charts of Google requests and Bitcoin price
How can you avoid such mistakes and better evaluate if the market has reached a top? You need an analytical tool that will show important liquidity levels and will report in advance about the appearance of a major player.
So, what is cryptocurrency?
From a technical point of view, Cryptocurrency is a secure electronic record that is transmitted between two people and indicates that the money of one participant has been transferred to another. Each such transaction is recorded in the electronic public book, which is called “blockchain”. Since this public book is available to every member of the system, the recorded transactions can’t be changed or duplicated. Thus, it guarantees the uniqueness of each unit of currency and removes the risk of duplication.
Bitcoin is the most famous and the first cryptocurrency to be mined (generated) and then traded. In the world of cryptocurrency, Bitcoin has become analogous to a cryptomarket benchmark, against which the state of the entire cryptomarket is analyzed.
A trader has multiple ways to obtain Bitcoin:
- it can be purchased on a crypto exchange, using a traditional payment method
- it can be transferred to you from another person
- a trader can earn Bitcoin as a miner
Before you make the first or next cryptocurrency deal, let’s look at the pros and cons of crypto assets trading.
The main aspects to consider while trading cryptocurrency
It is important to understand what digital assets have in common with equity or futures markets, as well as their differences. There can be more factors, but we have tried to identify the important ones.
Attractive returns
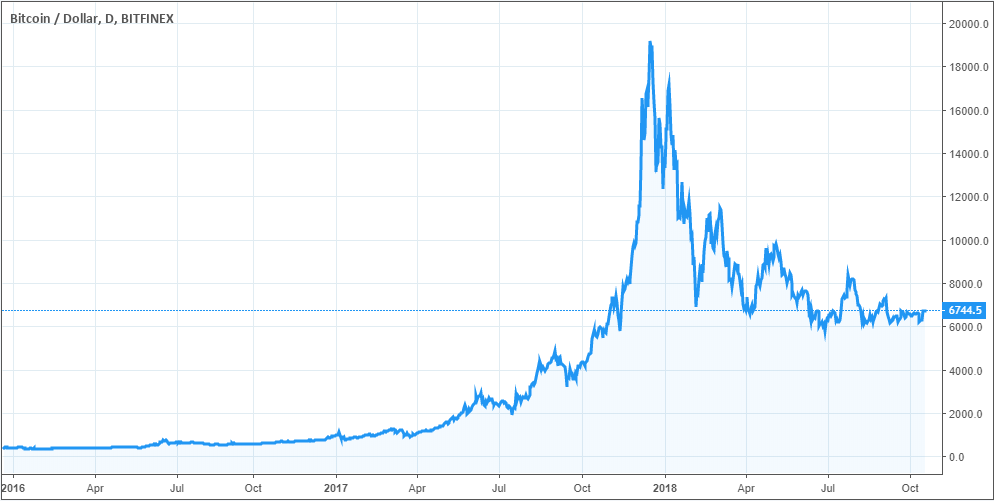
Look at the chart of the Bitcoin price. During 2017 it rose from $900 to $19,300 (a more than 2050% price change). The same yield could have been achieved trading stocks.
A good example is the Indian company Agri-Teck (India) Ltd, which saw a %2000 price increase in 1.5 years when its price rose from 9 to 180 rupees.
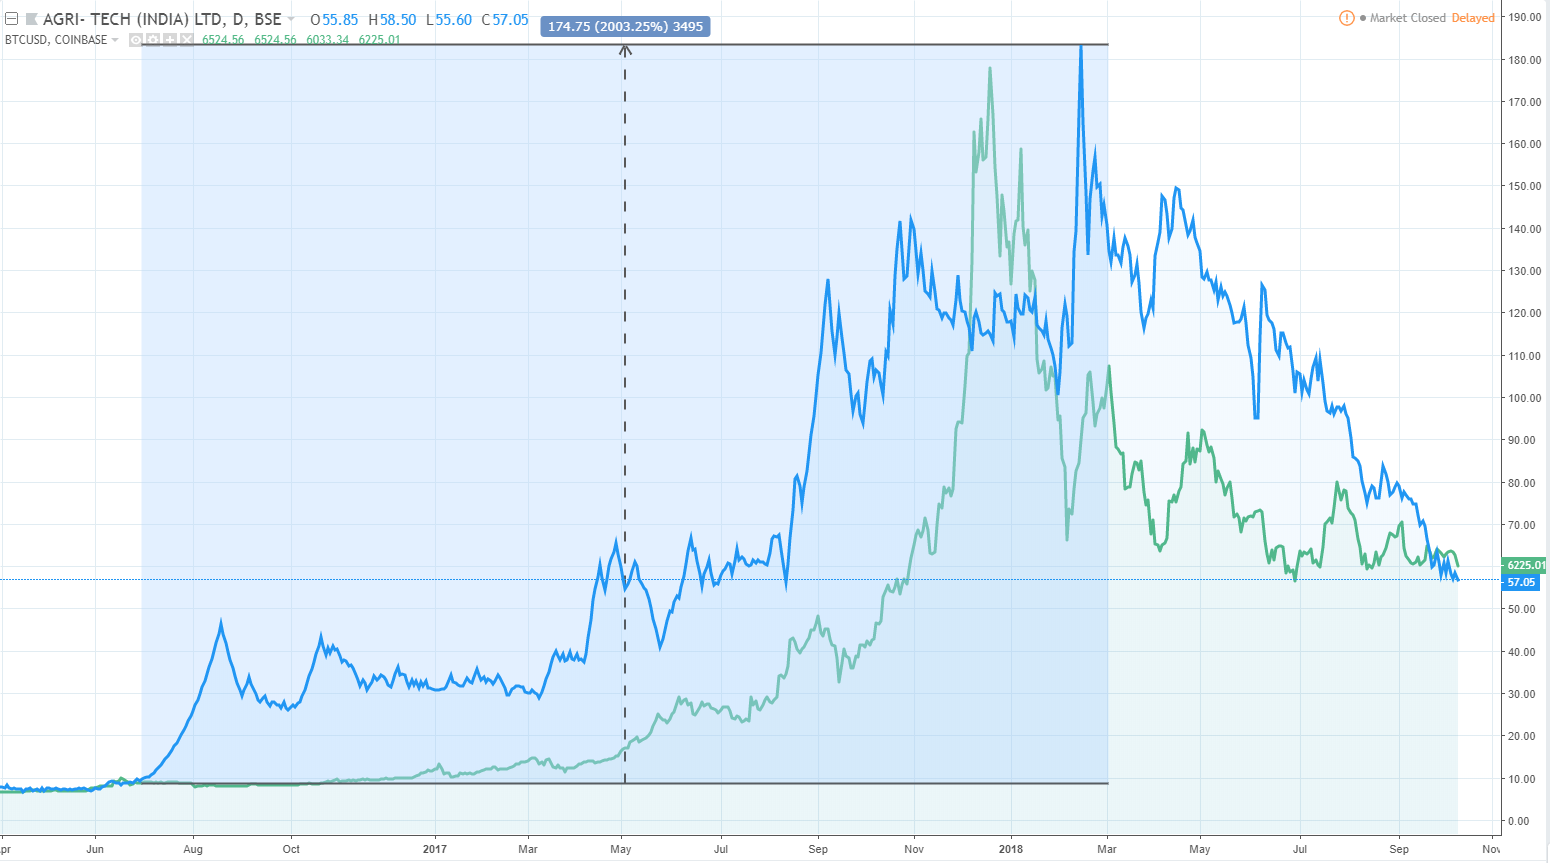
The stock price of Agri-Teck (India) Ltd (blue line) has grown by 2000%. Bitcoin price (green line) has increased by 2050%.The stock price of Agri-Teck (India) Ltd (blue line) has grown by 2000%. Bitcoin price (green line) has increased by 2050%.
Extreme volatility
It is important to remember that high returns are always associated with high volatility and risk, which not everyone is willing to accept. It is difficult to remain emotionally calm when daily changes in an open position reach or exceed +/- 20% of the initial capital.
The number of scams
ICO, or the initial coin offering, is aimed at attracting capital, fueling anticipation of further business reach and development. Unfortunately, many companies issue tokens with the aim of raising funds with no idea or intention of further development.
To avoid scams, carefully study what the company does, what its’ roadmap is like, and who are its’ key investors. For example, the popular forums Cryptocompare and BitcoinTalk can be a source of information and advice.
Used as investment mean
Investing in crypto assets, such as Bitcoin, can be considered a long-term investment, based on potential capital yield. Given the fact that CME Group launched Bitcoin futures trading at the end of 2017, we are able to be more confident about the cryptocurrency future as a long-term investment asset.
Lack of regulation
Regulators in cooperation with large investment banks are trying to create standard rules that will reduce the risks for investors and prevent fraud by unfair practices. Such attempts show the desire of institutional traders to enter the market with serious intentions, and with new tools based on crypto assets.
Crypto-assets as an emerging market
This may sound like a con, but trading in emerging markets provides a large number of short-term trading opportunities. For example, you can use the strategy of triangular arbitrage between different cryptocurrencies or different crypto exchanges. In mature markets, such strategies are usually available to HFT companies.
Cryptocurrencies vs Futures and Stock Markets. What do they have in common?
Futures and stocks markets operate according to definitive rules. Regulators, who guarantee the trading transparency are responsible for compliance with these rules. As a result of the activities of professional participants, markets became more efficient. But it creates a limit for individual traders to find and use profitable trades.
In turn, most crypto exchanges provide free market data and trading platforms with basic analytical and trading functionality.
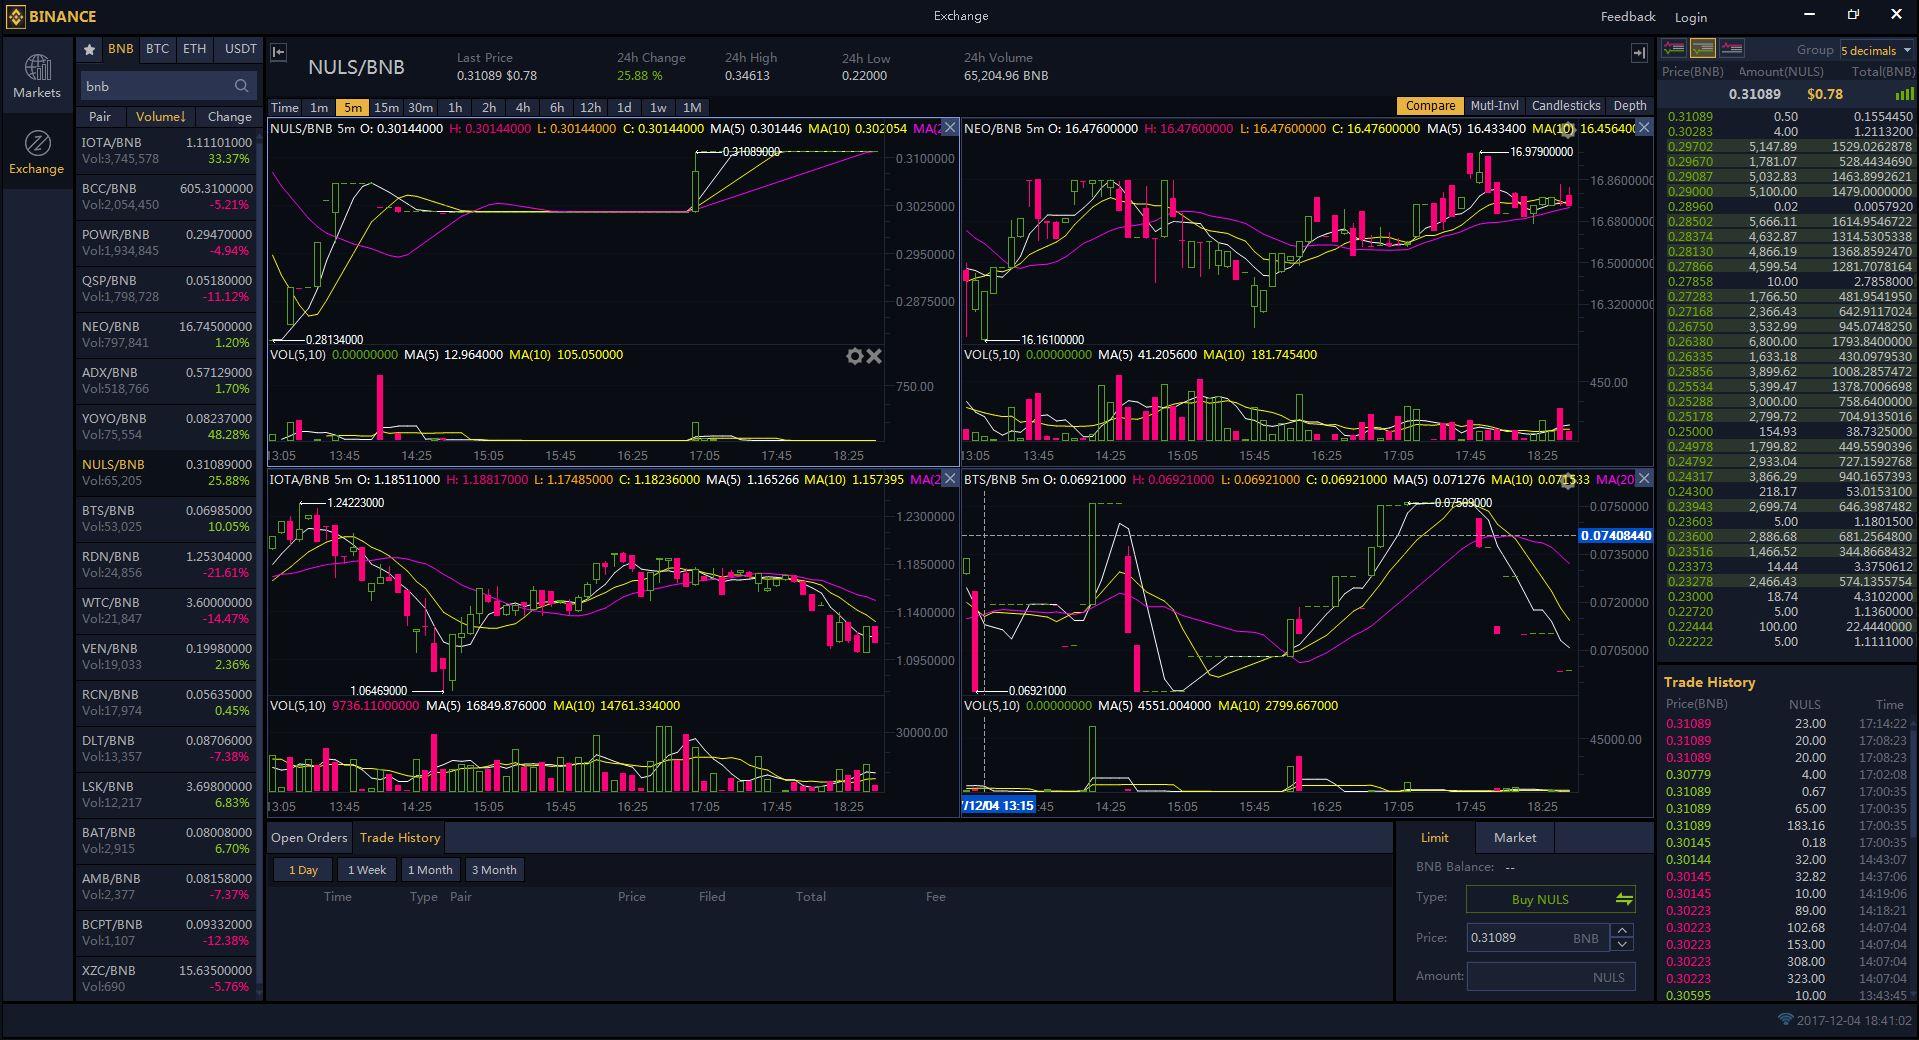
Most platforms for crypto-trading have basic analytical and trading functionality
As a result of the lack of a clear market view, traders on popular crypto exchanges resort to technical analysis as an exclusive tool and are therefore prone to lose money from their trading activities.
Order Book Heatmap is the key to a clear understanding of the crypto market
With the help of Bookmap traders can observe the actions of all market participants, which are formed into a clear and easily readable picture. The main functionality of the platform – Order Flow Heatmap – visualizes the changes of all limit orders at each price level. This allows them to see the real support and resistance levels that will affect the price.
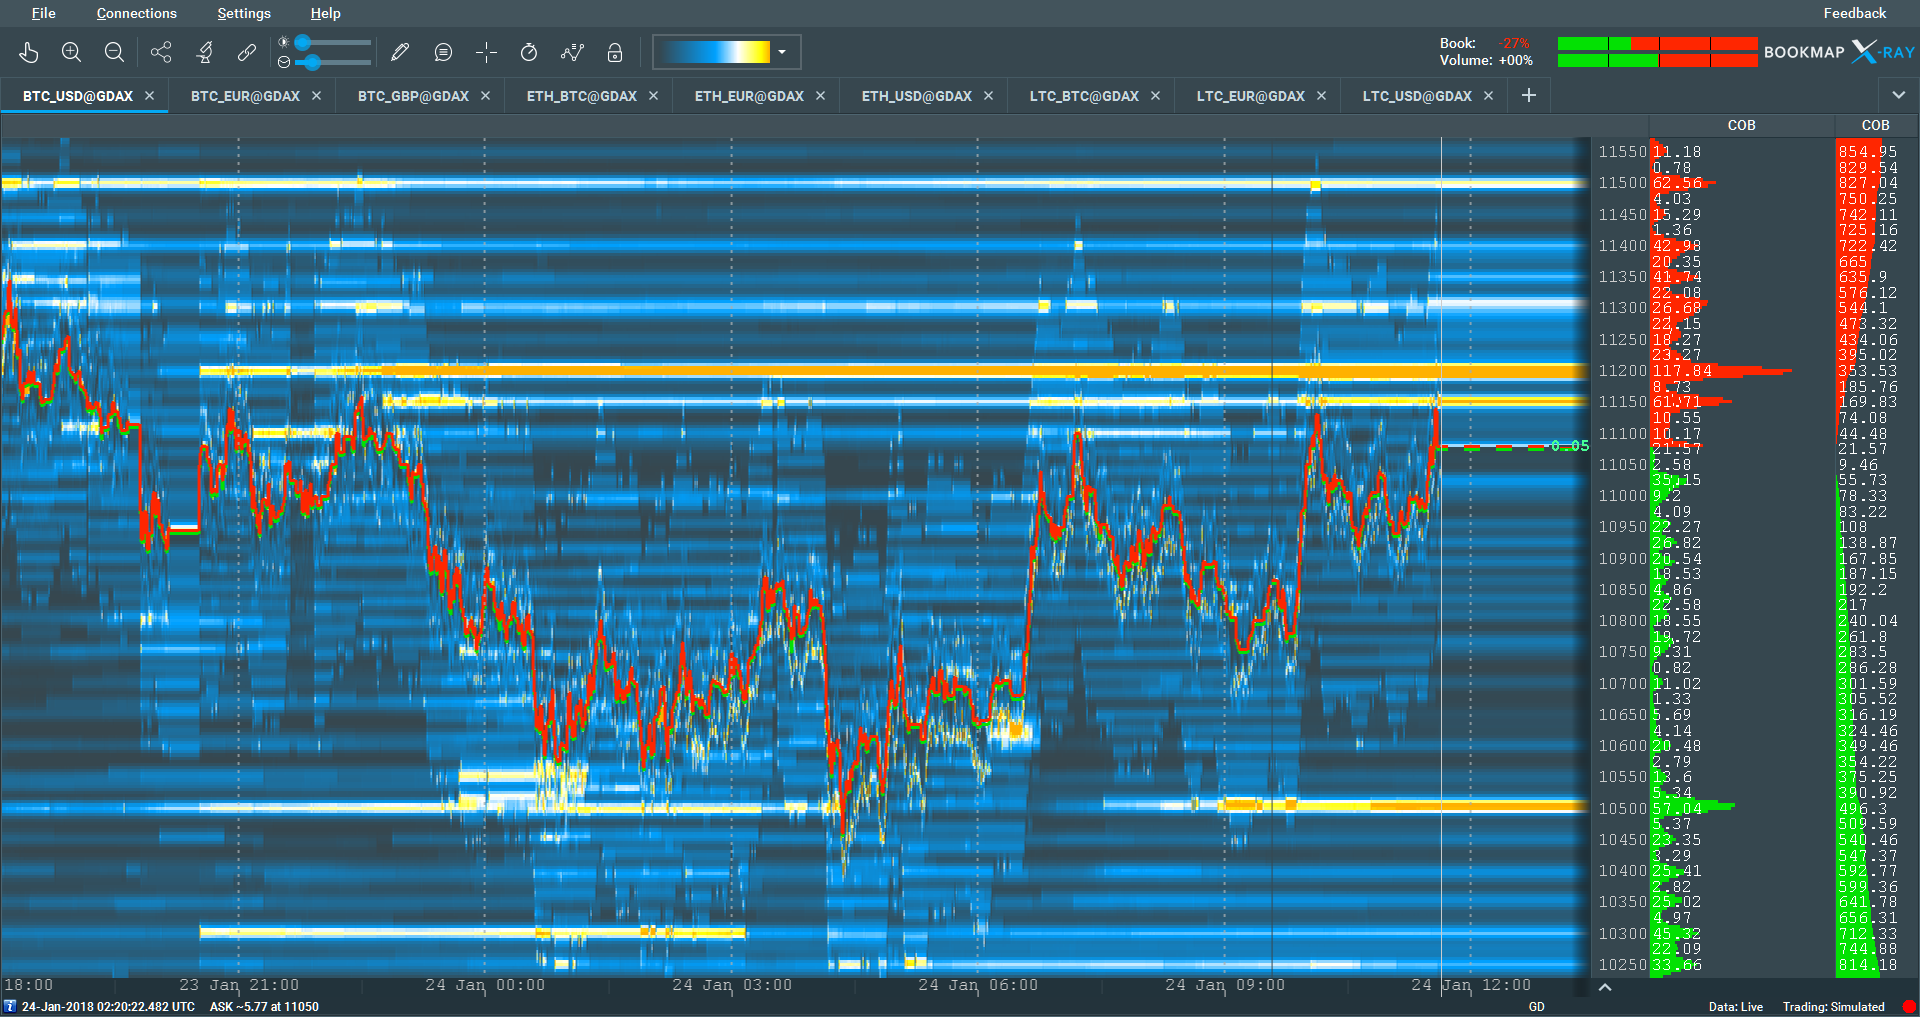
Order Flow Heatmap shows strong liquidity levels which are support/resistance levels
In addition to the Heatmap tool, the platform implements Volume Dots functionality. It shows the volume of executed trades in a specific period. The size of Volume Dots depends on the number of executed contracts, i.e., the larger the circle, the higher volume was traded. The division of the circle into the red and green sections indicates how much of the total amount refers to buy or sell aggressive trades. Thus, traders receive important information about who controlled the market situation.
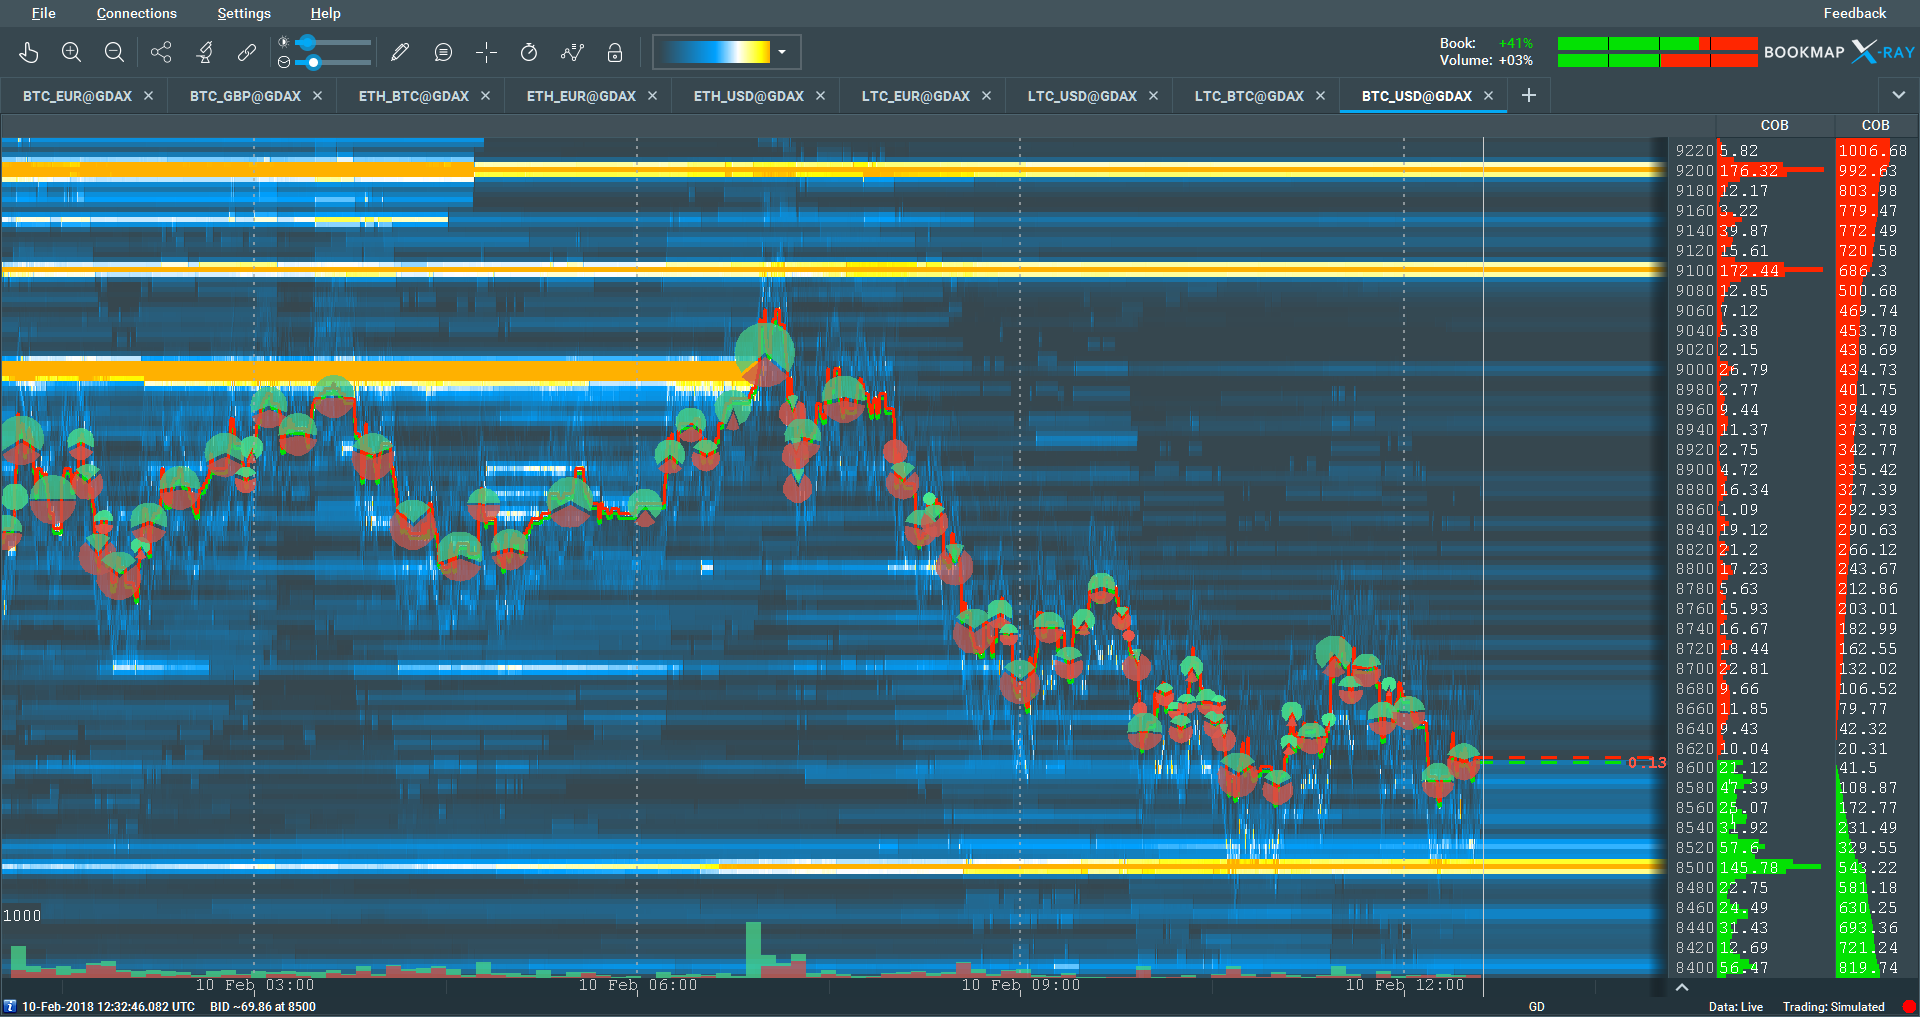
Bookmap displays the aggregate volume of executed trades using the volume dots tool
Detailed view on the market activity
Most platforms display data as a candlestick chart with a specific time step. This allows seeing the price evolution per day, week or month. Using Bookmap, a trader can scale the chart to the milliseconds level and analyze every executed trade.
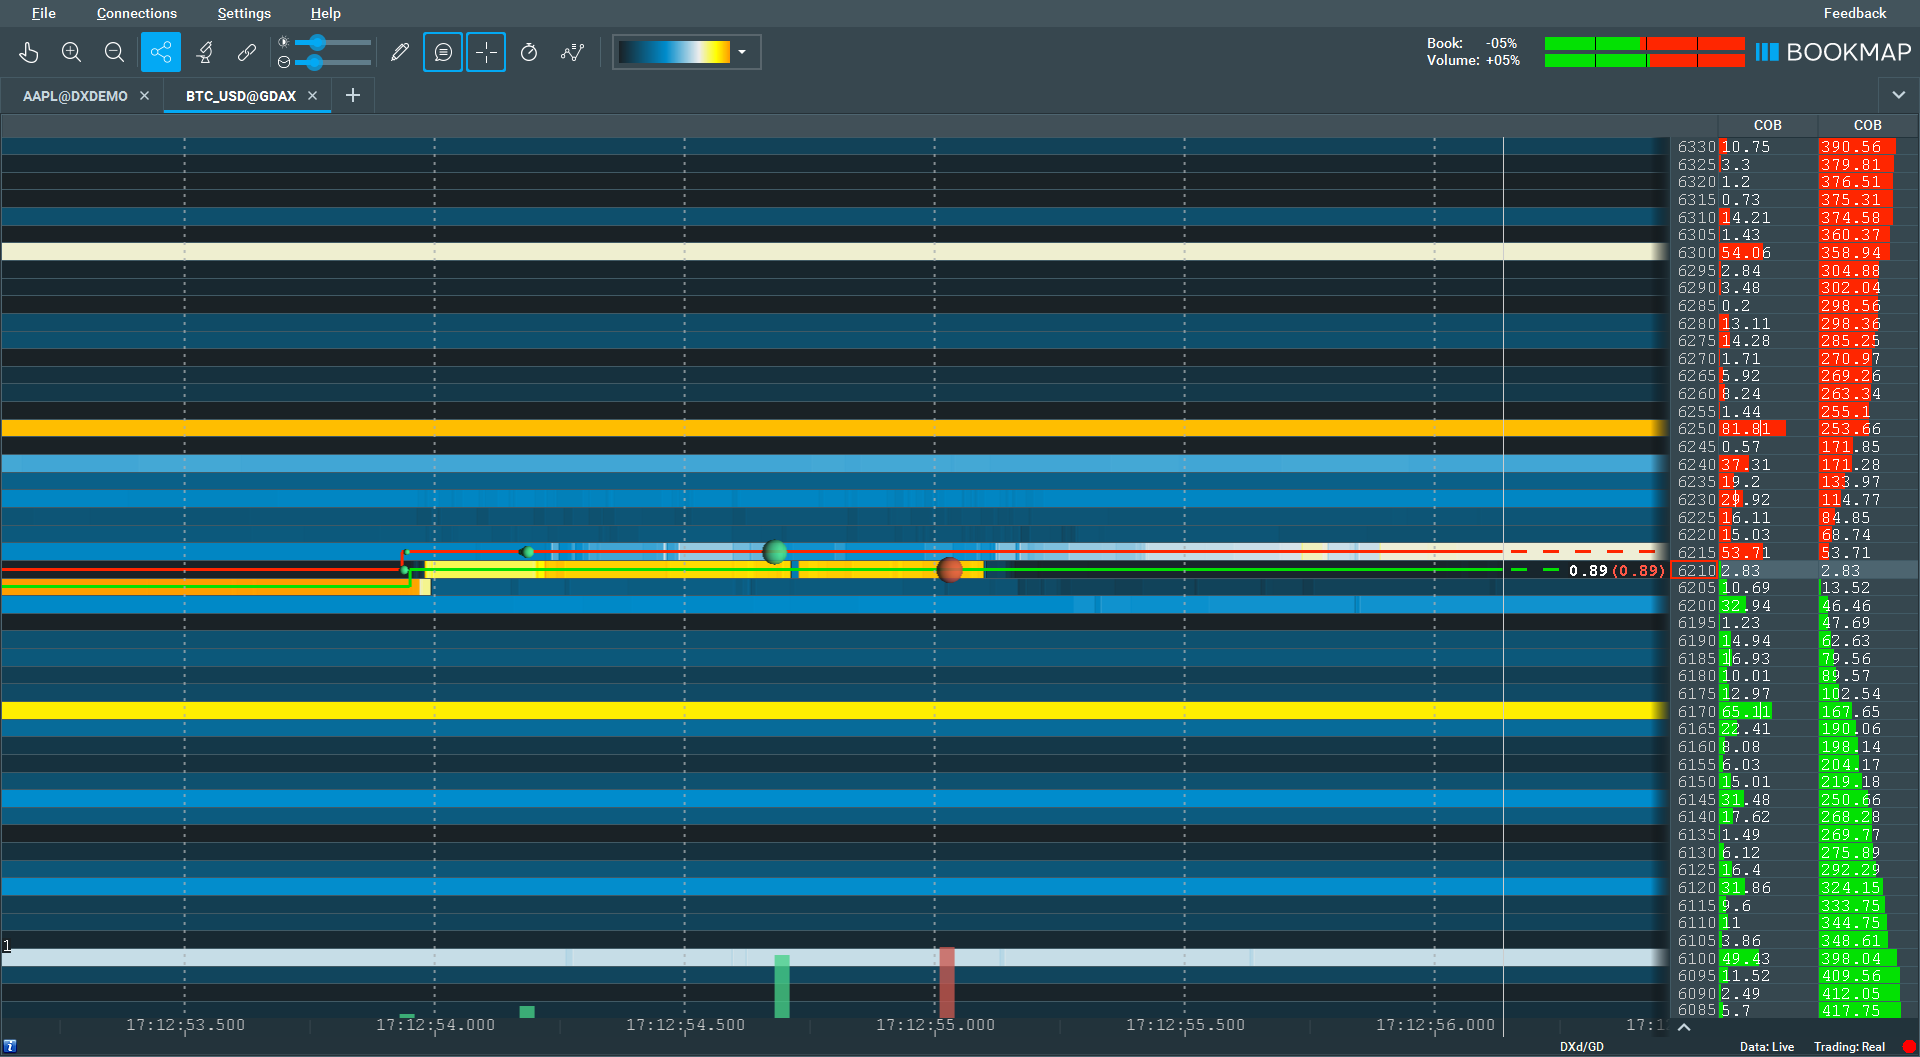
Bookmap allows you to scale the chart to the milliseconds level
Traders can select various types of columns in the platform that show volume data in the form of histograms. For example, Volume profiles show volumes at each price level for the current trading session or the visible part of the chart. Flexible settings allow customization of data appearance, as well as the number of columns for making informed trading decisions.
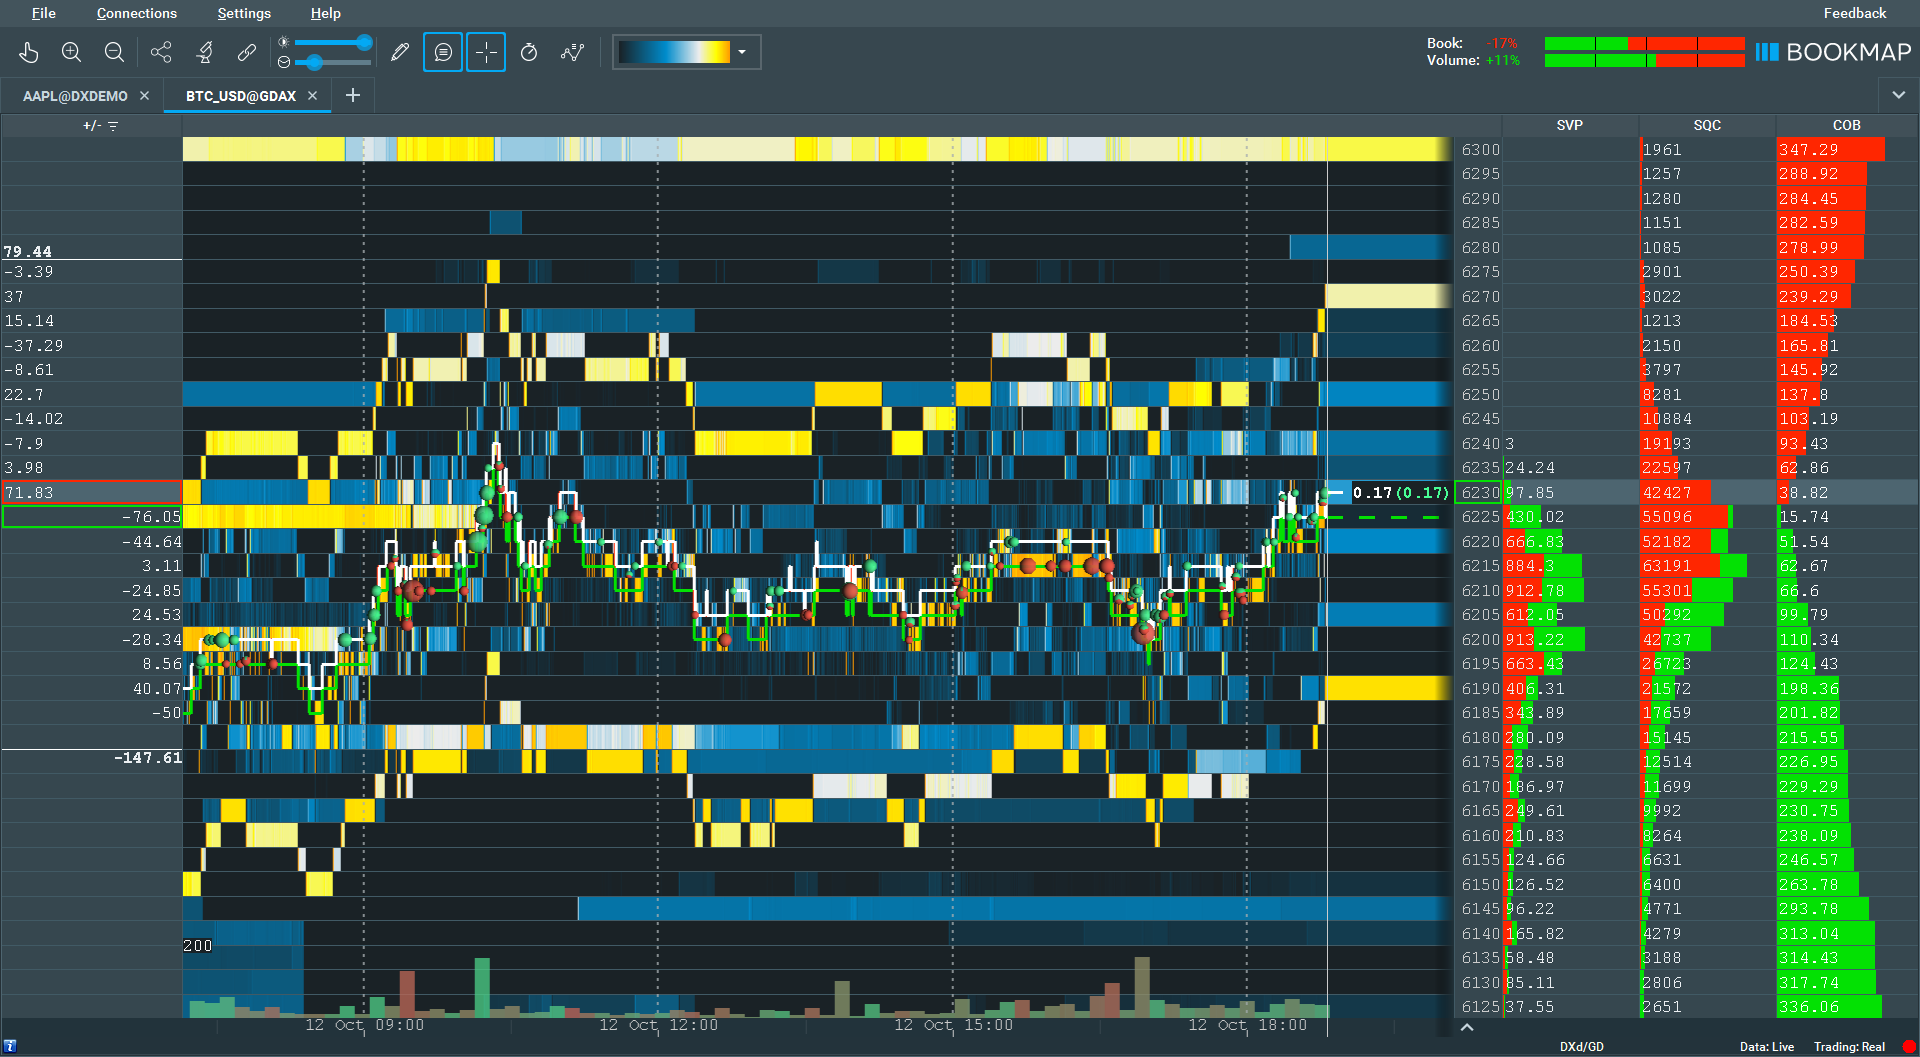
Various types of columns that show volume data in the form of histograms
It is worth noting about Imbalance indicators that are placed on the right upper corner:
- Order Book Imbalance shows the ratio between an average size of buying and selling resting orders. This will allow assessing which side of the order book is trying to influence the price. For example, if the indicator shows + 50%, this indicates the interest of buyers to raise the price higher. On the other hand, this may indicate the intention of sellers to push price higher to facilitate their short positions.
- Volume Imbalance shows the ratio between aggressive buying and selling trades. If the indicator value is in the positive zone, it will tell about the overbalance of buy market orders and vice versa.
Using the Bookmap platform, a trader will get a clear view of the market, that will allow him to make confident, and most importantly, profitable trades. Analyzing the Order Flow, you will see the intentions of large participants, their traps, as well as understand how liquidity affects the future price movement.
See how to start using Bookmap Digital version:
Get Bookmap Digital for free and start your confident trading!
 Twitter
 Facebook