See quarter end more clearly in real time.
Compare plans to access deeper market visibility for quarter end.
Futures
May 15, 2025
SHARE
How to Read Q2 Futures Flow: Spotting Large Player Position Unwinding

For most traders, quarter-end in futures trading isn’t loud or obvious, but it can move markets significantly. During this time, institutions usually rebalance, unwind, or roll their positions. Their actions often create sharp price movements, liquidity gaps, and volume spikes without a single headline in sight.
Will chasing chart patterns work during these times? No, you, as a smart trader, must do institutional tape reading and try to spot the subtle footprints of big money. You may use our advanced market analysis tool, Bookamap, for this. Some real clues you should look for are hidden iceberg orders, disappearing liquidity, or late-day volume clusters.
Want to learn how? In this article, we will learn how large players behave at quarter-end and how you, as a trader, can track, understand, and stay in sync with these market moves.
Why Quarter-End Matters in Futures Trading?
Quarter-end marks the close of a financial reporting period. This is particularly true for the second quarter (Q2), which sits right in the middle of the year. It is often considered a checkpoint for performance reviews.
At this time, large institutional players, such as hedge funds, asset managers, and pension funds, adjust their portfolios. Let’s see how:
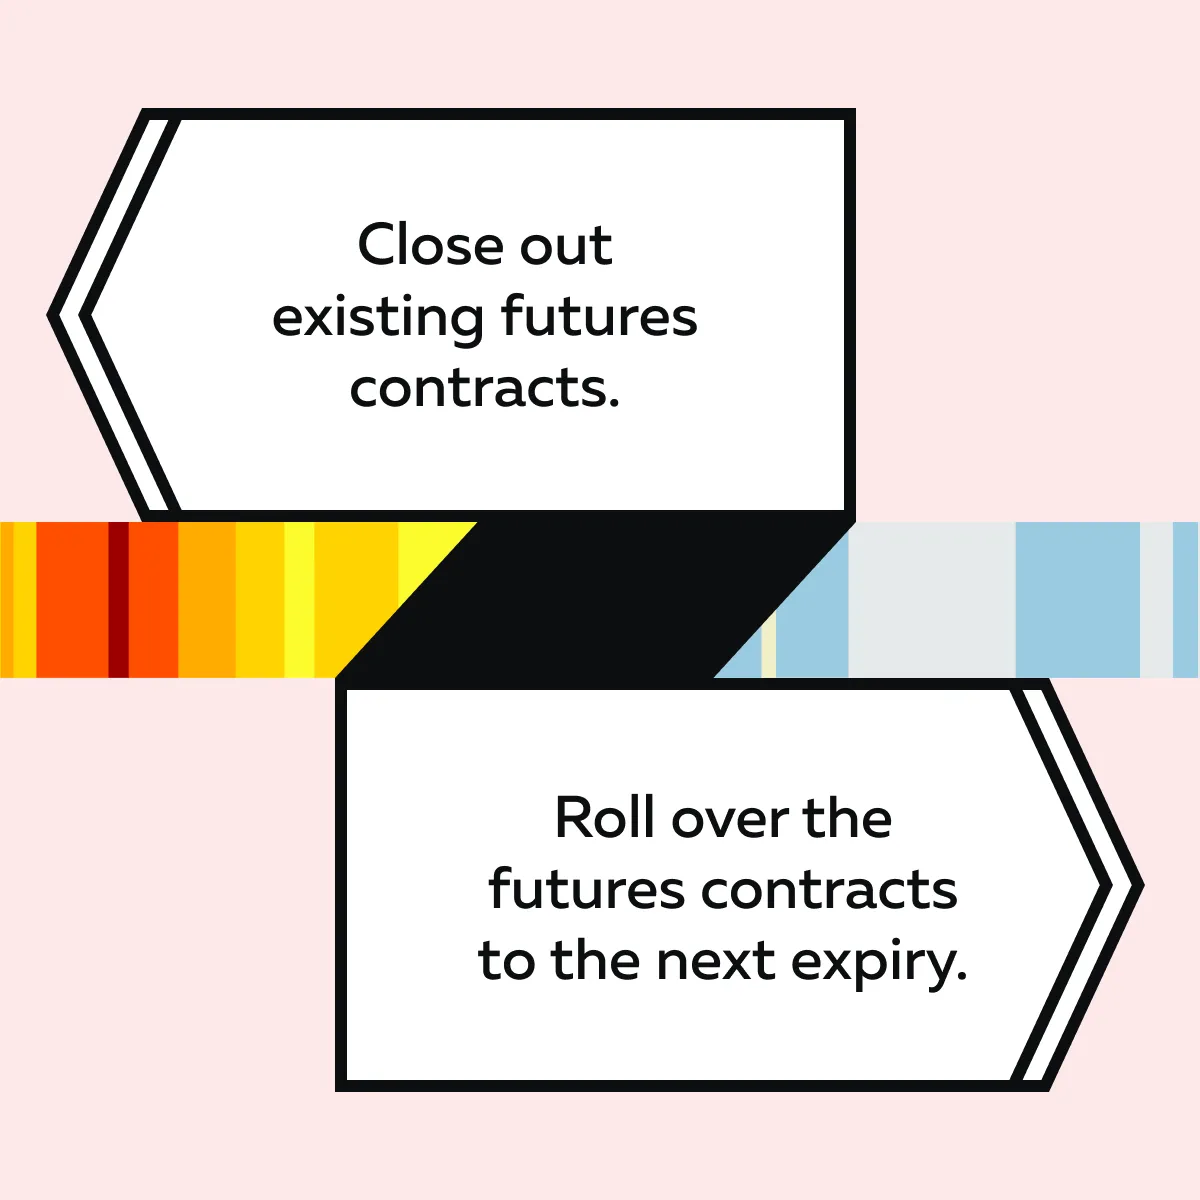
This process is part of what’s known as position unwinding. In it, traders exit trades to:
- Lock in profits,
- Limit losses, and
- Rebalance their exposure.
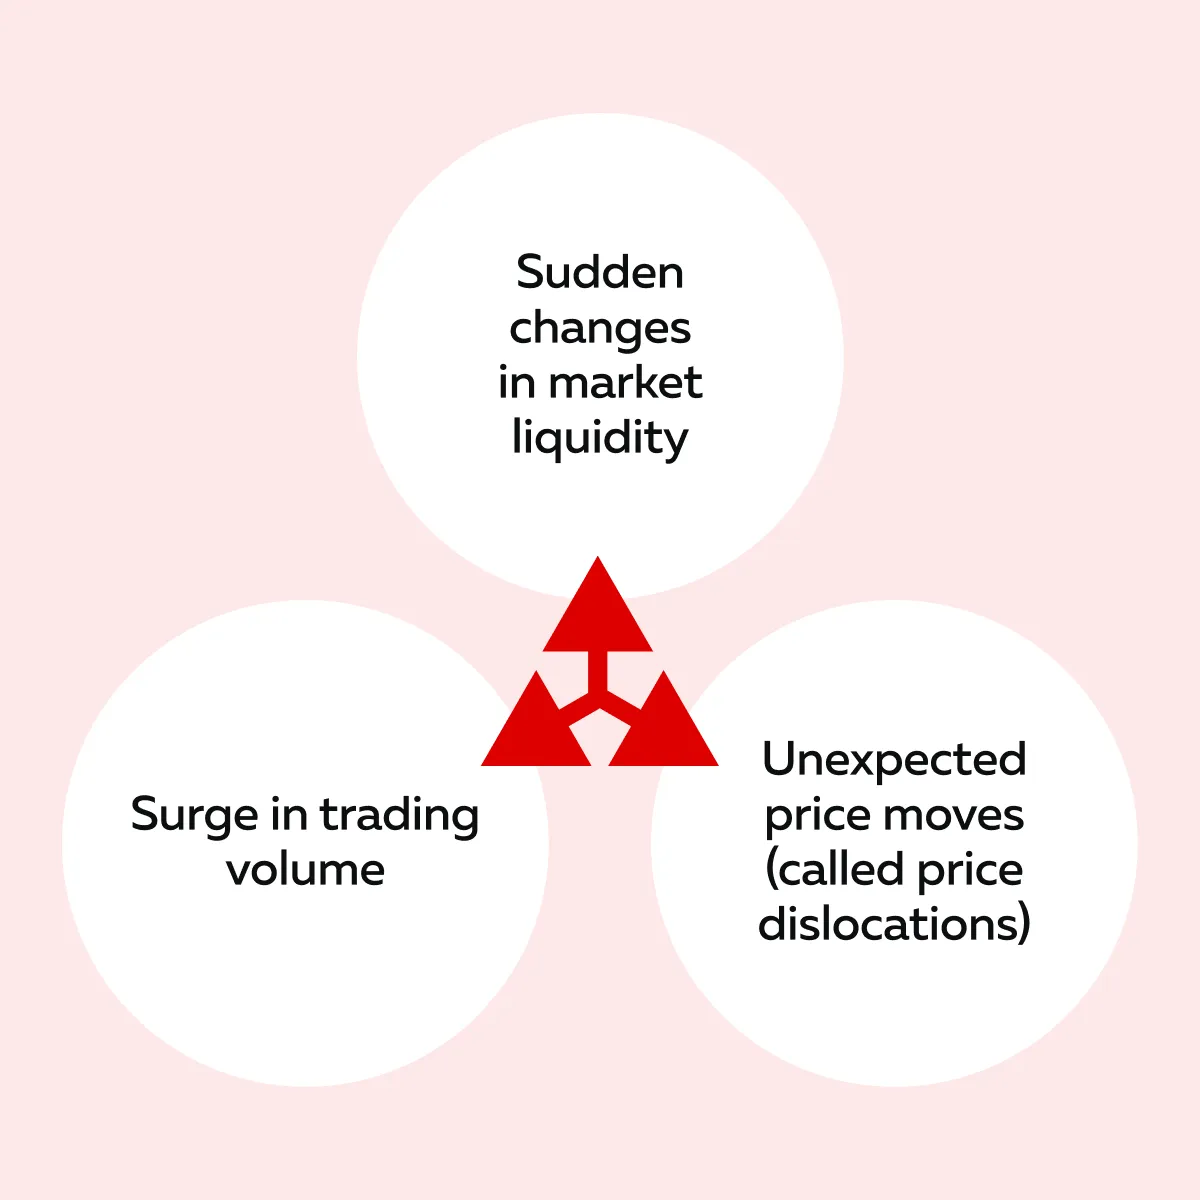
Be aware that these shifts don’t always happen due to headlines or news! Instead, they come from institutional tape reading. It means closely watching the flow of big-money trades to anticipate moves. Usually, the quarter-end futures flow becomes a reflection of the following:
- Institutional priorities
and
- Risk management strategies.
Let’s learn through the graphic below what all of these combined factors lead to:
How Large Players Unwind Positions at Quarter-End?
During quarter-end,particularly at the close of Q2, institutional traders adjust or close their positions. They do so to meet reporting and risk targets. This process is called position unwinding. Usually, these moves aren’t random! Instead, they follow patterns that can be tracked by experienced traders using institutional tape reading.
Below are some of the common ways these large players unwind positions:
Heavy Liquidity Removal and Rapid Tape Shifts
Big players often pull large resting orders from the order book when unwinding positions. This makes the book “thinner,” i.e., there’s less depth to absorb trades. As a result, prices move quickly and sharply with even moderate-sized orders.
For example,
-
- Say institutions aggressively unwind S&P futures (ES).
- Now, you might see key price levels lose their support or resistance instantly.
- These sudden drops in liquidity create “air pockets”.
- In these pockets, prices free-fall or spike without much resistance.
- This is an important signal in institutional tape reading.
Iceberg Order Sweeps
An iceberg order is when only a small portion of a trader’s full order is visible on the screen, while the rest is hidden. During position unwinding, large players usually use iceberg orders. They do so to avoid tipping off the market to their full size.
However, these large players often start sweeping visible liquidity, buying or selling chunks rapidly in succession. Consequently, even though their full order is hidden (like an iceberg), the market sees a series of large trades hitting the tape one after another, which can alert others to significant market activity.
Please note that recognizing these sweeps is a key skill in reading the quarter-end futures flow.
Volume Clusters at Key Timeframes
Volume clusters usually spike at the end of the trading day or the end of the quarter. These volume clusters often form around important price levels like:
- VWAP (Volume-Weighted Average Price)
or
- Major swing highs/ lows
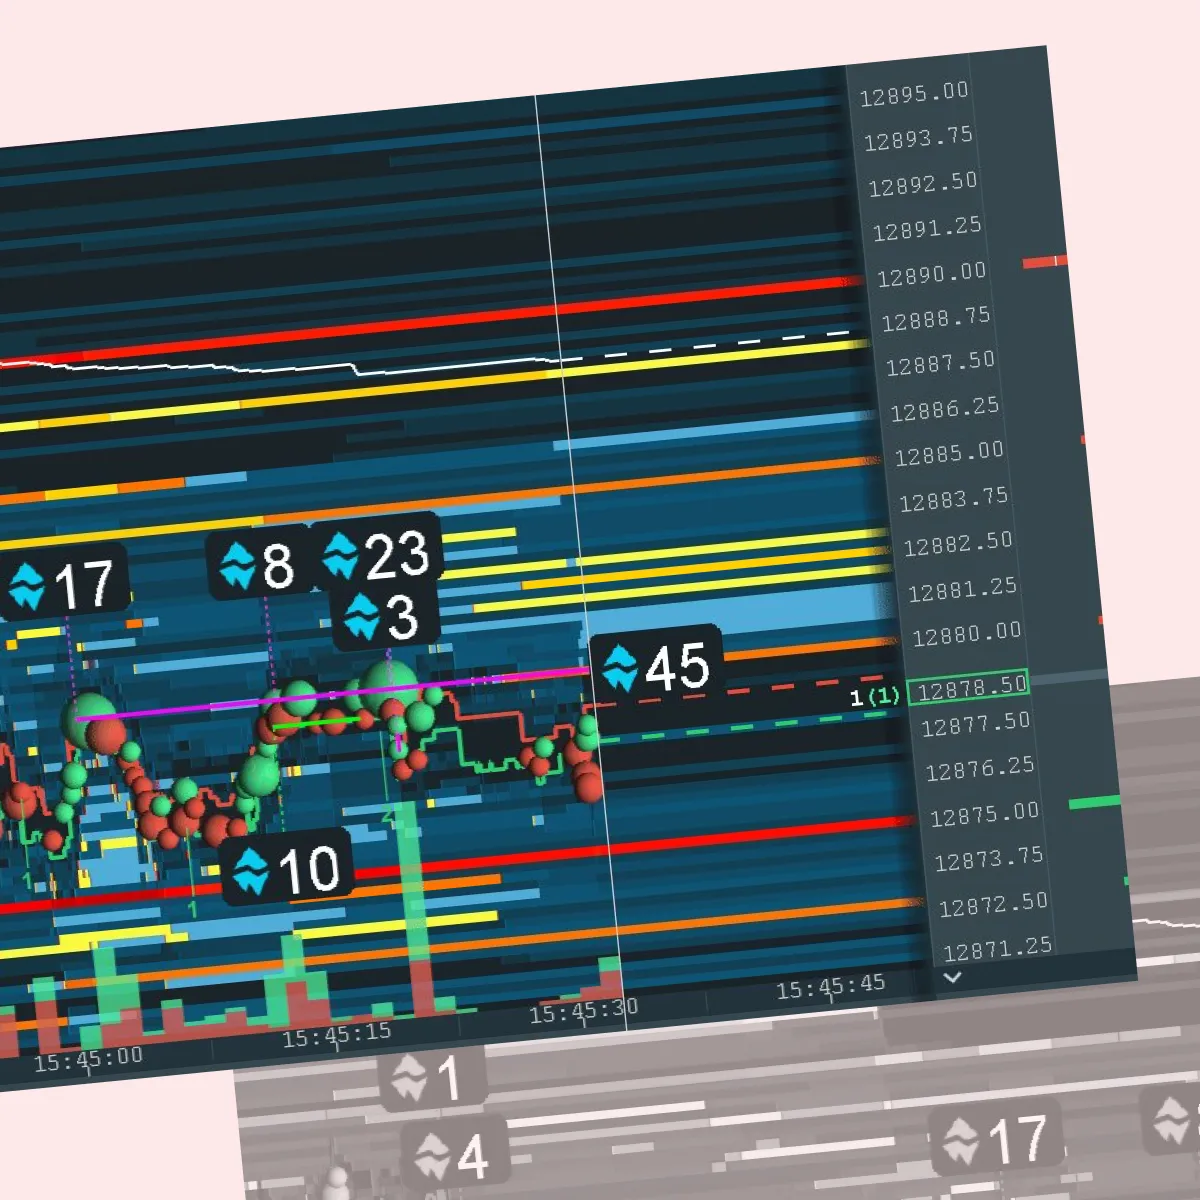
When institutions rebalance, they mostly prefer to trade passively near these levels. This results in dense trade activity. You can clearly see this activity on our modern market analysis tool, Bookmap. These high-volume “dots” signal that position unwinding is happening quietly, but in size.
Practical Techniques for Spotting Quarter-End Flows
Want to trade profitably near the end of a quarter? You must observe the market behavior. That’s because, during these times, large institutions make big adjustments to their portfolios quietly (without any public announcement).
But even silent moves leave clues! If you know what to watch for, you can detect the quarter-end futures flow before it entirely plays out. Follow these simple steps to spot quarter-end flows:
Step 1: Watch the Heatmap for Liquidity Withdrawal
One of the most evident signs of quarter-end futures flow is when large players start pulling their resting orders from the order book. They do this quietly:
- During slower periods
or
- Near important price levels.
That’s because they don’t want to reveal their intentions. This is a classic form of institutional tape reading! In this, you watch how liquidity behaves and not just the price.
Now, be aware that when those resting orders disappear, it creates an “air pocket,” a gap in liquidity. Due to this gap, even minor buy or sell orders suddenly move the market. For some traders, this might look like a breakout. Instead, it is a vacuum where price jumps due to thin volume.
Let’s understand this better through an example:
- Say S&P futures (ES) have had strong sell-side liquidity at 5350 all day.
- Then, just 10 minutes before the market closes, that liquidity vanishes.
- Suddenly, the price shoots up 10–15 handles.
- This surge happened not because of the news but because someone pulled size.
- That’s likely a position unwinding by a big player.
The takeaway? When you see liquidity disappear like that, particularly at the end of a quarter, don’t try to fight the move. It is a sign that institutional players are making quiet adjustments. Thus, step back, observe, and let the quarter-end futures flow play out.
Step 2: Monitor for Repeated Iceberg Executions
When institutions unwind positions at quarter-end, they rarely do it all at once! Instead, they use smart execution strategies to stay under the radar.
One common tactic is placing iceberg orders (where only a small part of a large order is visible to the market). This lets them avoid moving the price too much.
Now, as a trader, if you are watching the tape or our Bookmap, you will notice:
- The price doesn’t move much
but
- Heavy volume keeps printing at the same level
These repeated trades are a tell-tale sign of iceberg execution, where big size is being hidden and released gradually. It’s a form of quiet position unwinding or accumulation.
For example,
- Say you are exploring our tool, Bookmap, and you see dozens of medium-sized trades hitting the bid or offer in rapid succession.
- However, still, the price stays flat.
- Now, that’s not noise!
- It is often an institution that uses controlled execution algorithms to manage quarter-end futures flow.
What can you, as a trader, do? You don’t need to know who’s behind the flow! But once you spot repeated iceberg behavior, it’s a signal that serious size is active. If you try to trade against that flow, you might get run over. Thus, instead, respect the footprint and adapt.
Step 3: Focus on Volume Clusters Near the Session Close
As mentioned before, most institutions often wait until the end of the trading day to make their biggest moves. But why? Check out the graphic below for possible reasons:
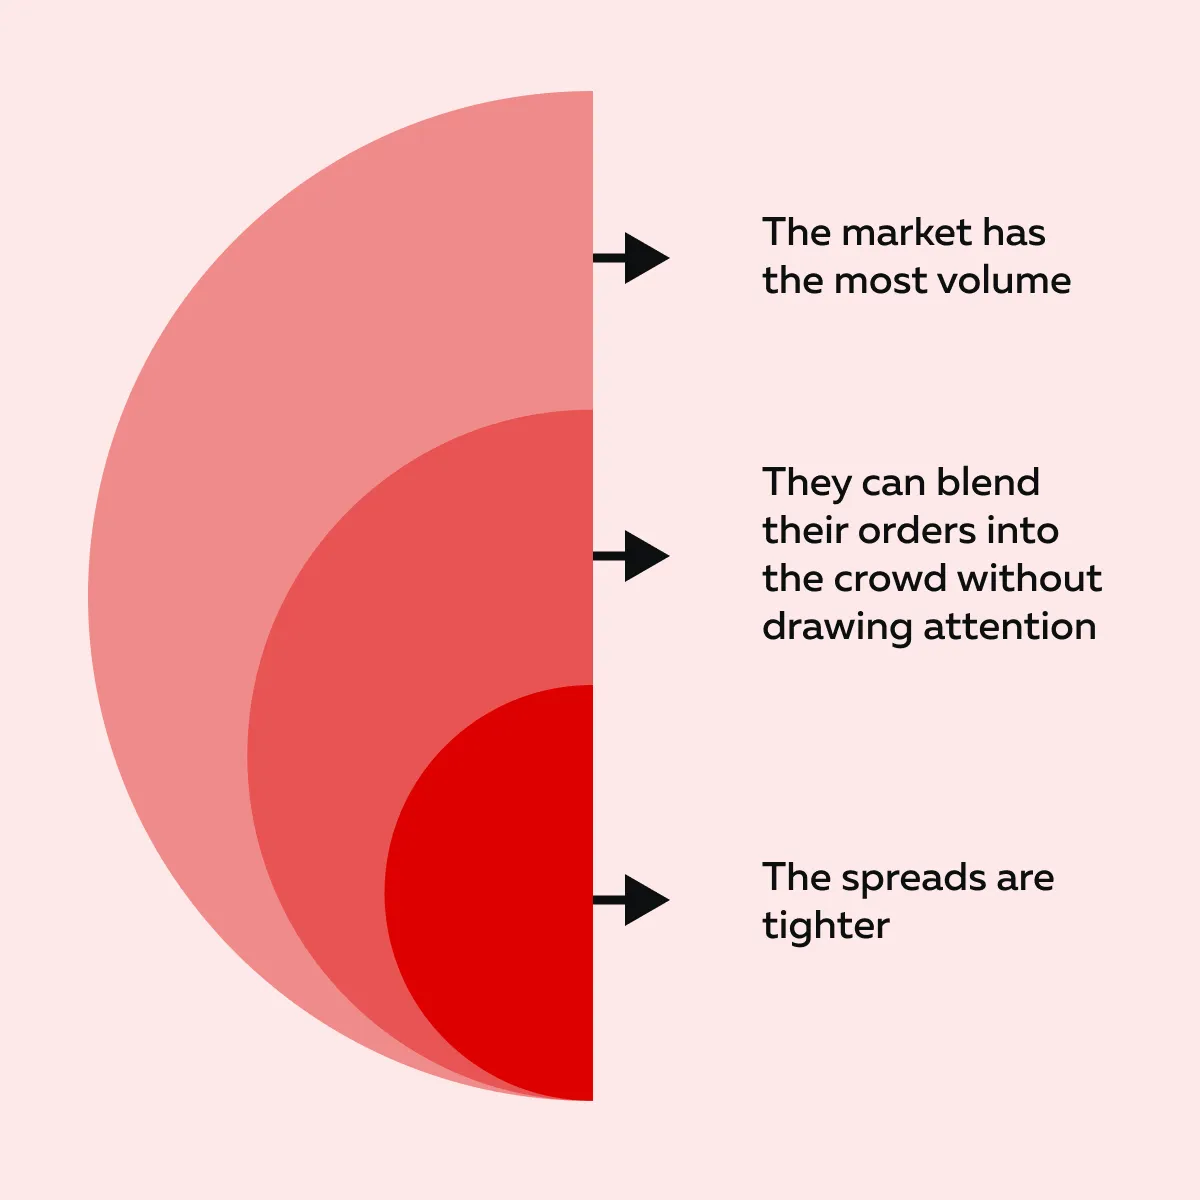
Now, one key sign to watch for is a volume cluster. It represents a sudden spike in trade volume during the last 15-30 minutes of the session, often without any news driving it. These late-day surges are a clear sign of institutional position unwinding or rebalancing.
To get a clearer signal, you can combine them with other clues, like:
- Liquidity stacking
or
- Iceberg order hits.
For example,
- Say futures are trading quietly all day.
- Then, they suddenly explode with volume in the last 20 minutes.
- This happens right near VWAP or a round number like 5400.
- That kind of move isn’t always due to emotion or trend.
- Instead, it’s often mechanical and is tied to end-of-day adjustments by large funds.
As a trader, this is where institutional tape reading can help you stay out of trouble. Say you are holding a position, and you see heavy volume flooding in late with price stalling or chopping. Now, this might not be a real breakout or breakdown. It could just be quarter-end flows!
By recognizing this early, you can quickly adjust and avoid fighting a move that isn’t about the charts but about the clock.
Common Mistakes Traders Make During Quarter-End
While trading during quarter-end futures, even experienced traders make mistakes. You must realize that institutional activity leaves clues, but not every move is a signal.
Below are some common errors you must avoid to read the tape better:
Mistaking Noise for Flow
Just because you see a liquidity shift or a sudden price move doesn’t mean an institution is behind it. Please realize that markets have lots of random movements, particularly during slower hours. If you assume every change is part of position unwinding, you might act too early.
Thus, while performing institutional tape reading, you should wait for confirmation, like:
- Volume spikes,
- Iceberg hits, and
- Liquidity stacking.
Don’t guess where large players are moving—see real-time futures flow with Bookmap.
Trading Too Early
A major mistake is jumping in too soon! Many traders expect quarter-end flows to appear in the morning or midday. However, large institutions often wait until late in the session (sometimes the final hour or even the final 15 minutes). That’s when they can unwind or roll positions quietly, with enough volume to hide their size.
Now, if you act early, it can leave you stuck in a choppy market with no real direction.
Ignoring Larger Timeframe Context
Quarter-end futures flow either go with the trend or cut against it. Largely, it depends on what institutions need to adjust. If you ignore the bigger picture, such as daily or weekly charts, you might be surprised by a sharp move that doesn’t fit your short-term setup.
Be aware that some of the most aggressive position unwinding happens against the prevailing trend (particularly if funds are locking in gains or cutting exposure).
Thus, as a trader, you must stay alert! Try to be patient and always consider the broader market context when trading around quarter-end.
Conclusion
Quarter-end trading isn’t just about chart patterns or indicators. You must understand how large institutions move their money. These big players often adjust or unwind positions quietly. However, their actions leave behind clear signs if you know where to look!
By using our avant-garde real-time market analysis tool, Bookmap, you can spot these shifts in real time. There, you can also observe volume clusters, liquidity changes, and institutional tape reading activity that would otherwise go unnoticed.
Remember, the key is not to guess! It is to observe and react with context. Are you serious about improving your edge during quarter-end futures flow? Spot Q2 position unwinding early by watching liquidity and volume shifts. Learn advanced techniques for reading institutional behavior—explore the Learning Center.
FAQ
1. What is quarter-end futures flow?
Quarter-end futures flow is when big institutions adjust their futures positions at the end of a quarter. Usually, they close, roll, or rebalance trades to match their goals for the next quarter. This activity creates sudden market moves even without news.
2. How do institutions unwind positions at quarter-end?
Institutions quietly change positions by pulling big orders from the order book. They do so by using hidden orders (like icebergs) and making large trades late in the day. This lets them avoid moving the prices too much.
3. What is an iceberg sweep in futures trading?
During an iceberg sweep, a trader quickly starts buying or selling by hitting several small and visible orders in the market. At first, it looks like just a few small trades! But together, it adds up to a very large trade.
This lets such traders operate without moving the market too much or alerting others to their true size.
4. How can Bookmap help spot quarter-end unwinding?
Our Bookmap shows live data on price, volume, and hidden liquidity. Using it, you can see:
- When did big orders vanish?
- When do iceberg trades happen?
- When does volume spike near the close?
These are common signs that institutions are adjusting their positions.
Sign Up Now