4th of July Sale
50% Off Bookmap Global+, Data & Add-Ons
Save on Global+, market data, and add-ons from July 3–13.
Education
January 27, 2026
SHARE
Hidden Liquidity in Large-Cap Stocks: How to Spot Iceberg Orders in 2026
Does the market play hide and seek with most participants? Well, in a way, it does! Institutional players often use strategies like iceberg orders to make significant trades without tipping their hands. These hidden orders cause price shifts and create challenges for retail traders.
However, at the same time, they even open up lucrative opportunities. But it’s only for those who know how to spot them. Want to know more? In this article, we will learn about hidden liquidity and its impact. You will see:
- How does iceberg order trading and large-cap stock liquidity affect market behavior?
and
- How can our market analysis tool, Bookmap, help you uncover these concealed orders?
We’ll also cover key strategies for trading around hidden liquidity, like, order flow analysis, heatmaps, and usage of advanced indicators. Let’s begin.
What Is Hidden Liquidity in Large-Cap Stocks?
Hidden liquidity in large-cap stocks represents buy or sell orders that are not fully visible in the public order book. Institutional investors and large traders use these hidden orders. Through these orders, investors can execute sizable trades without revealing their full intentions to the market. A common example of hidden liquidity is iceberg order trading. Here, only a small portion of the order is displayed while the majority remains hidden.
Large-cap stocks (such as Apple or Microsoft) are particularly attractive for this strategy. That’s because their high trading volumes provide a layer of anonymity. Institutional players often benefit from hidden liquidity to minimize market disruption. See what happens when the trader does not use hidden liquidity through the graphical representation below:
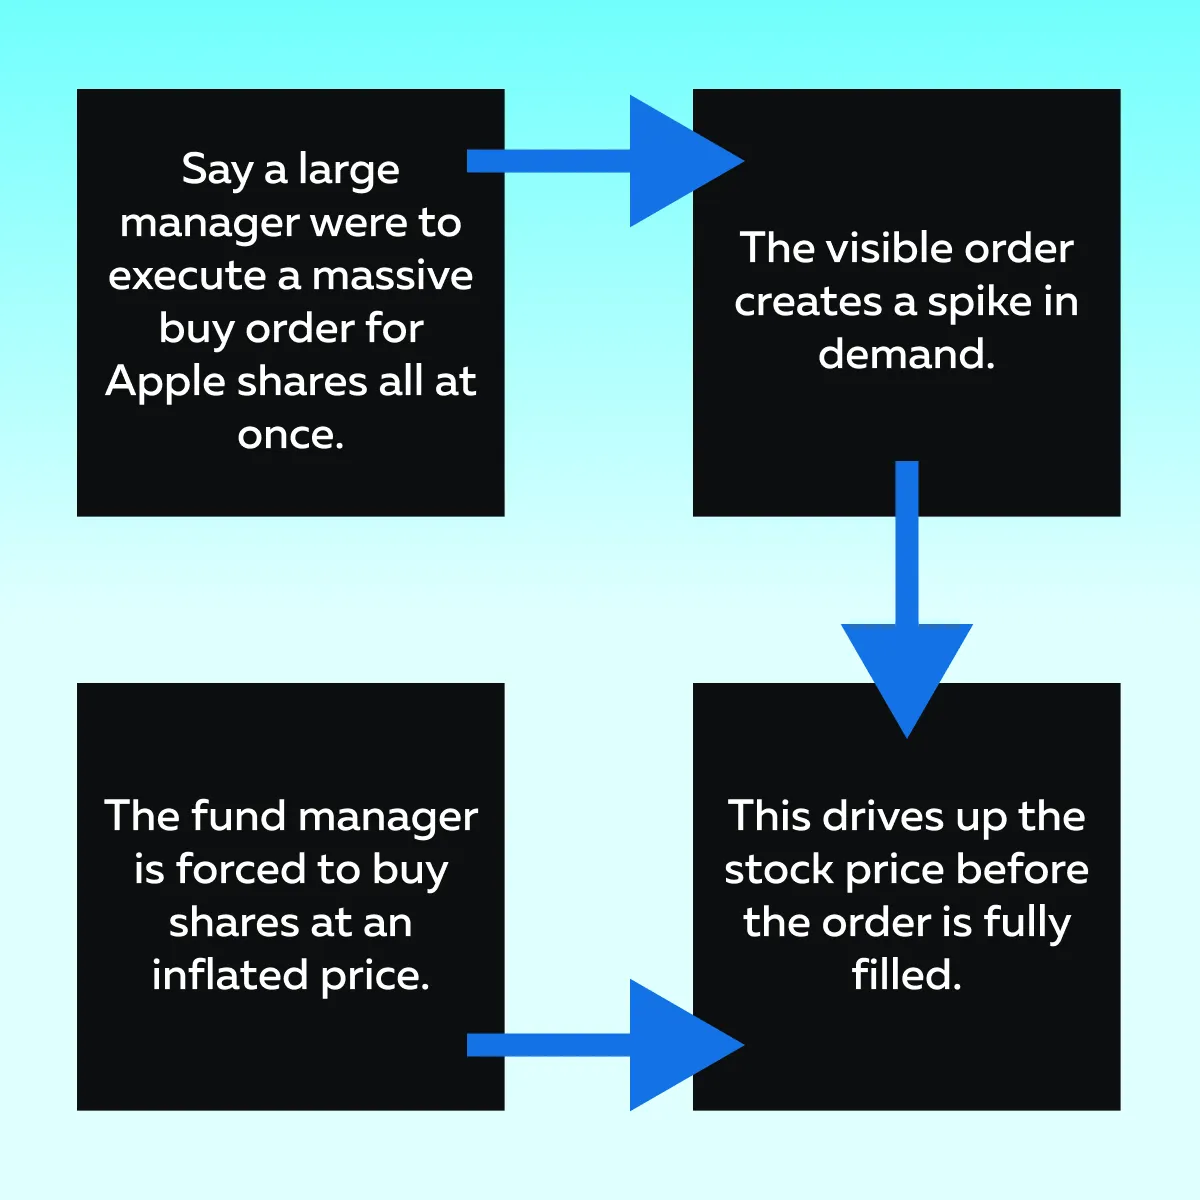
Now, to avoid this situation, usually fund managers use iceberg orders. Through it, they break the trade into smaller and concealed blocks. This ensures smoother execution while preserving large-cap stock liquidity.
How does Hidden Liquidity Impact Trading Dynamics?
Hidden liquidity in large-cap stocks influences:
- Market behavior,
- Price movements, and
- Trading strategies.
As discussed above, concealed orders (such as iceberg orders) allow institutional players to execute large trades without revealing their full size. This creates challenges for retail traders. Moreover, hidden liquidity affects supply, demand, and liquidity at key price levels. In this way, hidden liquidity introduces both volatility and complexity. Let’s understand in detail.
Price Manipulation Risks
Generally, hidden liquidity creates short-term price distortions. These orders are not fully visible in the standard order book. As a result, they absorb liquidity without alerting other market participants. Furthermore, this hidden activity leads to abrupt price movements, particularly in large-cap stocks like Tesla. Let’s understand how it happens through the given example:
- Suppose a large institutional buyer places an iceberg order for Tesla stock.
- The visible portion of the order is small.
- But the hidden portions are gradually executed.
- They start consuming sell-side liquidity.
- As a result, Tesla’s price spikes suddenly.
- This happens because it gives the appearance of increased demand.
However, this movement does not reflect genuine market sentiment. Instead, it merely shows the effects of uncovering hidden orders.
To detect iceberg orders trading and analyze large-cap stock liquidity, you need to use several advanced trading techniques in 2025. Commonly, this includes the use of algorithmic tools.
Challenges for Retail Traders
Hidden liquidity in large-cap stocks is not visible on standard trading platforms. This creates significant challenges for retail traders. Their only option is to rely on the displayed order book to make decisions. The drawback here is that by doing so, they often miss critical liquidity levels where iceberg orders trading or other hidden orders are present. This lack of visibility mostly leads to costly mistakes.
Let’s see how through the given scenario:
- Say a retail trader is attempting to buy Tesla stock.
- The trader sees minimal resistance on the visible order book.
- They expect the price to rise smoothly.
- However, a large institutional seller has placed an iceberg order at a critical price level.
- Now, the hidden portion of the order could act as a wall.
- It can absorb buy-side liquidity.
- Retail traders might find themselves facing unexpected price resistance.
- This can reduce profitability or even lead to a loss.
Through the above example, you can clearly understand the importance of large-cap stock liquidity. By using certain advanced trading techniques in 2025, you can easily detect and analyze hidden liquidity in large-cap stocks. Spot iceberg orders in real-time to refine your trading strategy—try Bookmap today.
Detecting Iceberg Orders in Large-Cap Stocks
To identify hidden liquidity in large-cap stocks (such as Tesla or Amazon), you need to use certain specialized tools and techniques. That’s because iceberg orders and other concealed trades are not visible on standard trading platforms. Let’s see some methods of how you can uncover hidden orders and analyze large-cap stock liquidity:
Method I: Order Flow Analysis
Order flow analysis is one of the most effective techniques for detecting hidden liquidity. See the graphic below to learn what you can do using it:
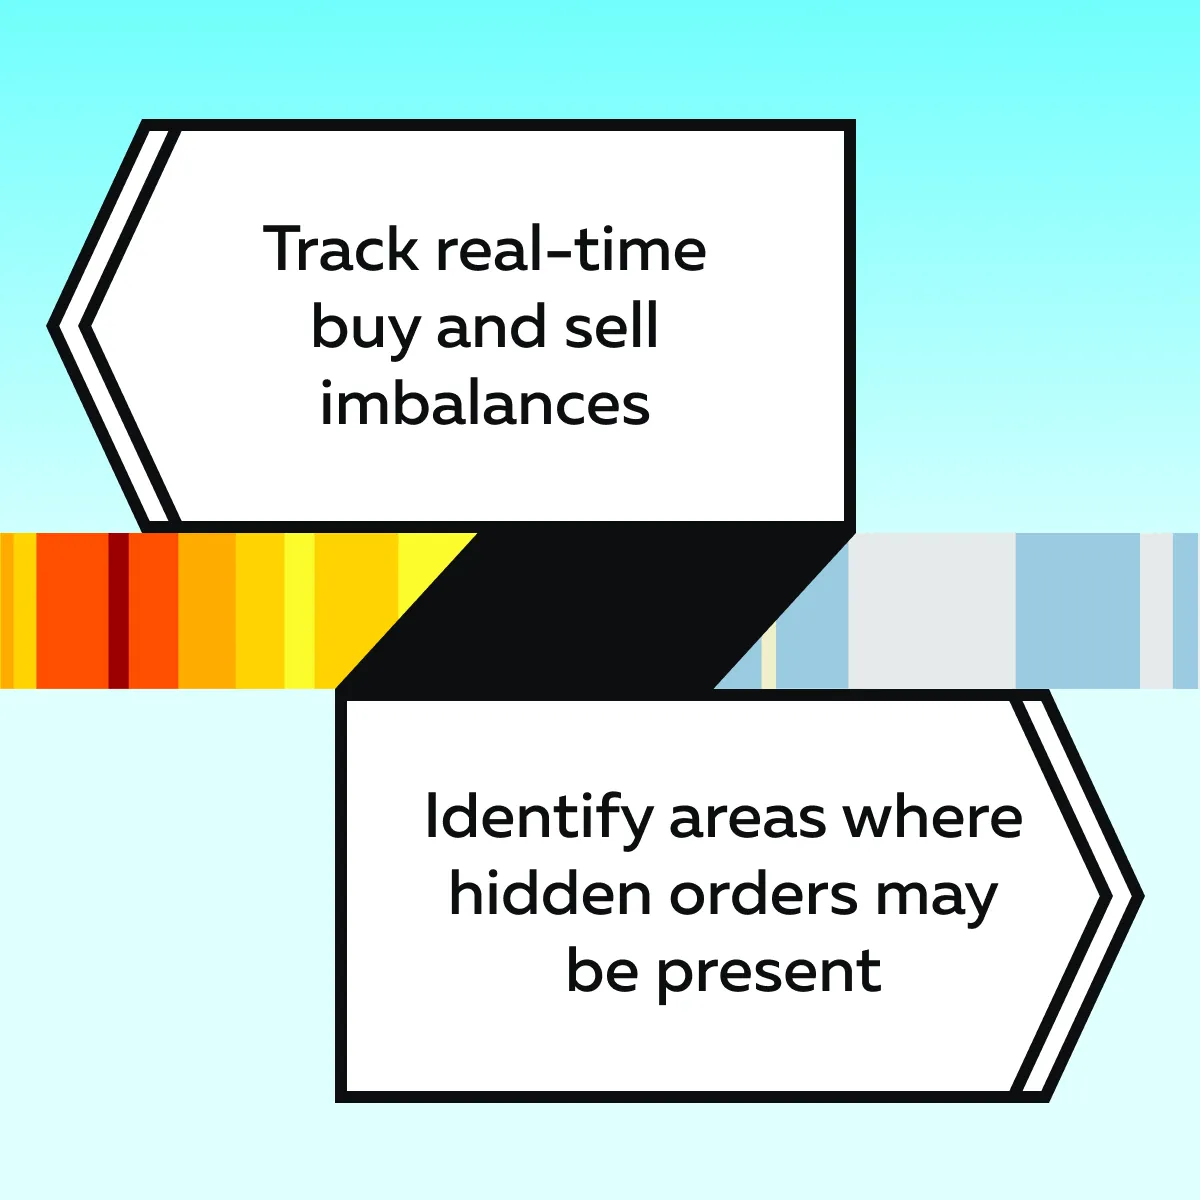
For example, say there is persistent selling pressure at a specific price level. But the visible order book doesn’t show significant sell orders. Now, this clearly shows that an iceberg order is absorbing the buy-side liquidity.
Method II: Bookmap’s Absorption Indicator
Our advanced market analysis tool, Bookmap, offers a powerful absorption indicator. It reveals areas where significant trading volume has occurred in a short period. This absorption signals hidden liquidity, such as iceberg orders trading at critical price levels. Let’s see how:
| Buy-Side Absorption | Sell-Side Absorption |
| This occurs when large buy limit orders absorb aggressive selling. If the price repeatedly holds at a support level, it suggests hidden institutional buying and could lead to a price reversal upward. | Large sell limit orders absorbing aggressive buying can signal resistance and may cause a downward price reversal. |
Take this instance:
- Say a Tesla stock experiences heavy transactions at $200.
- There are no visible sell orders.
- Now, this indicates a hidden iceberg order placed by a large seller.
Monitor large-cap stock liquidity like never before with Bookmap’s advanced visualization tools.
Method III: Heatmap Insights
Our Bookmap offers another powerful feature, which is “heatmap”. It visually highlights resting liquidity. Also, it shows concealed orders at key price levels. Using these heatmaps, you get to know about areas where institutional players are active.
Imagine the following situation:
- Say a trader is monitoring Amazon’s heatmap.
- It could spot significant buy-side absorption at a key support level.
- This suggests hidden institutional demand.
How Absorption Signals Hidden Liquidity?
Numerous studies have shown that there is hidden liquidity in large-cap stocks when heavy transactions occur at specific price levels without corresponding visible orders. Traders who use tools like Bookmap can easily uncover hidden orders. Also, they can predict price movements with greater precision.
Strategies for Trading Around Hidden Liquidity
To trade around hidden liquidity in large-cap stocks, you need a combination of the following:
- Advanced tools,
- Sharp analysis, and
- Disciplined execution.
Also, by using techniques like order flow analysis and heatmaps, you can identify key price levels where institutional activity occurs. For more clarity, let’s have a look at some major strategies that can help you uncover hidden orders and optimize entry and exit points:
Scalping Hidden Liquidity Zones
Scalping hidden liquidity zones is a strategy where traders exploit high-activity areas created by hidden liquidity in large-cap stocks. These zones are often driven by iceberg order trading. They provide opportunities for short-term trades within well-defined price ranges.
How Scalpers Utilize Hidden Liquidity?
If we talk about scalpers, they mostly use our advanced market analysis tool, Bookmap. Using it, they identify hidden liquidity levels where institutional traders are active. When iceberg orders are detected, they create high-volume zones. These zones generally act as temporary support or resistance levels (ideal for scalping strategies). Now, let’s learn about two popular types of zones:
| Buy-Side Liquidity Zones | Sell-Side Liquidity Zones |
|
|
For more clarity, let’s study an example of scalping around hidden liquidity:
- Say a scalper is trading Tesla stock.
- Trading occurs at a detected hidden liquidity level of $200.
- Using Bookmap’s heatmap, the scalper observes significant buy-side absorption at this price.
- This hidden institutional demand keeps the price from falling further.
- Also, it creates a range where the scalper repeatedly:
- Buys near $200
and
- Sell slightly higher as the price bounces back.
- By executing multiple trades within this range, the scalper generates consistent profits.
Swing Trading with Hidden Liquidity
Most swing traders confirm critical price levels to benefit from hidden liquidity in large-cap stocks. These are specific support or resistance levels where iceberg orders are trading. Post-identification, they enter long-term trades at these levels. It is worth mentioning that these hidden orders often act as anchors. They stabilize prices and create opportunities for swing trades.
Let’s see an example:
- Say a swing trader is using Bookmap.
- They spot a large hidden buy order near Tesla’s 200-day moving average.
- This signals a likely price floor and indicates strong institutional demand.
- Also, it suggests the stock will not fall below that level in the short term.
- The trader uses this information to enter a long position.
- They do so in anticipation of a price rebound.
Also, be aware that large-cap stock liquidity patterns revealed through these hidden orders provide valuable confirmation for swing trading strategies.
Risk Management for Hidden Liquidity
Trading around hidden liquidity zones comes with its own set of risks. Please note that uncovering hidden orders provides insights. However, markets can still move unpredictably, especially if hidden liquidity is suddenly withdrawn. To manage this risk, traders use tight stop-loss orders near detected hidden liquidity levels.
Here’s a scenario to understand this strategy:
- Say a trader notices significant hidden buy-side liquidity for Tesla at $200.
- They enter a long position.
- They place a stop-loss order at $198, just below the hidden liquidity zone.
- Now, if the price unexpectedly breaks through the support level, the stop-loss minimizes losses.
- This enables the trader to exit quickly before further declines.
Risks of Trading Around Hidden Liquidity
Trading around hidden liquidity in large-cap stocks offers smart opportunities. However, it also carries significant risks. Let’s check them out:
Risk I: Market Reversals
One of the primary risks of trading near hidden liquidity zones is the possibility of sudden market reversals. Be aware that hidden liquidity (such as iceberg orders trading) often stabilizes prices. However, the cancellation or rapid execution of these orders leads to sharp price movements.
Let’s understand this through an example:
- Say a trader spots hidden sell-side liquidity in Nvidia stock.
- They enter a short position expecting resistance.
- They face a sudden breakout.
- This happens because the iceberg orders are canceled or overwhelmed by aggressive buy-side demand.
- Due to these rapid shifts in large-cap stock liquidity, the trader gets exposed to unexpected losses.
Risk II: Overreliance on Detection Tools
Another risk is overdependence on tools designed to detect hidden liquidity. Heatmaps, absorption indicators, and other detection methods indeed provide valuable insights. However, they must be used in conjunction with other technical and fundamental indicators. When you don’t refer to other indicators, there is a chance of misinterpreting hidden liquidity patterns. This leads to poor trading decisions.
Consider the following scenario:
- Say Nvidia is trading at $450.
- Some hidden sell-side orders appear at that level.
- A trader sees this as resistance and takes a short position.
- However, unbeknownst to the trader, strong institutional demand builds just below that level.
- This leads to a sudden price surge.
- The buy-side liquidity overwhelms the hidden sell orders.
- This misinterpretation results in significant losses.
How to Manage These Risks?
To mitigate these risks, you should:
- Combine iceberg order detection with other advanced trading techniques in 2025, such as:
- Trend analysis,
- Moving averages, and
- Market sentiment.
- Use tight stop-loss orders to limit exposure to rapid reversals.
- Regularly monitor changes in large-cap stock liquidity to adjust strategies as market conditions evolve.
Conclusion
By detecting hidden liquidity in large-cap stocks, you can significantly improve your trading outcomes. Hidden liquidity (such as iceberg order trading) often shapes market movements. It absorbs buy and sell pressure without being visible in the standard order book. Traders who identify these concealed orders gain a significant edge.
In 2025, you can use our advanced market analysis tool, Bookmap, and its several advanced features. Using it, you can uncover hidden orders and better understand large-cap stock liquidity. Also, try performing an order flow analysis. This allows you to:
- Track real-time imbalances,
- Spot hidden buy and sell zones,
- Identify precise entry and exit points, and
- Improve the accuracy of trades.
Lastly, prefer integrating order flow analysis into trading strategies. Through it, you can anticipate market movements driven by institutional players. This reduces the risk of unexpected price shifts and missed opportunities. Discover hidden liquidity in large-cap stocks with Bookmap’s Iceberg Order Detection tools.
Sign Up Now