4th of July Sale
50% Off Bookmap Global+, Data & Add-Ons
Save on Global+, market data, and add-ons from July 3–13.
Education
August 26, 2024
SHARE
Strategies for Trading in Low vs. High Liquidity Markets

Trading effectively across different market conditions necessitates an assortment of strategies. It’s important to understand that market liquidity, which refers to how easily an asset can be bought or sold, is a key factor in distinguishing these conditions.
In this article, we will explore the importance of market liquidity and how it affects trading. You’ll learn about the differences between high- and low-liquidity markets and how to adapt your trading strategies accordingly. Also, we will cover specific techniques for trading in both environments.
Additionally, we’ll explain how advanced market analysis tools like Bookmap can help you analyze market conditions more accurately and improve your trading decisions. Read the entire article to understand how to deal with various liquidity conditions and optimize your trading strategies for better success. Let’s begin.
Market Liquidity: Brief Overview
Market liquidity refers to the ease with which an asset can be bought or sold in the market without significantly impacting its price. An asset with high liquidity shows that many buyers and sellers are actively trading that asset. It allows for quicker transactions at stable prices. High liquidity is crucial for trading because:
- Traders can execute trades quickly without experiencing delays.
- The difference between the bid (buy) and ask (sell) prices is smaller in a liquid market, which reduces trading costs.
- High liquidity stabilizes prices by absorbing large buy or sell orders without causing significant price swings.
It must be noted that liquidity also affects trade execution, spreads, and volatility. Let’s see how:
| Trade Execution | Spreads | Volatility |
|
|
|
What Factors Impact Market Liquidity?
Mostly, trading volume affects market liquidity. Usually, higher trading volumes indicate more active participation and enhanced liquidity. On the other hand, low trading volumes signal a lack of interest or confidence that, in turn, reduces liquidity. The reactions of market participants play a major role in the level of activity in the market. The three most common distinctions of market participants are:
- Retail traders,
- Institutional investors,
and
- Market makers.
Usually, limited participation or concentration of activity among a few players leads to lower liquidity. Similarly, major news events and earnings reports also create such an impact. Let’s see how:
| Major News Events | Earnings Reports |
|
|
Strategies for Trading in High-Liquidity Markets
High-liquidity markets are appealing to traders because they offer:
- Quick trade execution,
- Narrow bid-ask spreads,
- Stable prices.
Also, this environment supports diverse trading strategies, such as scalping and day trading. For more clarity, let’s study the advantages of trading in high-liquidity markets:
- Tighter Spreads
- High liquidity results in narrow bid-ask spreads.
- It minimizes the cost associated with entering and exiting positions.
- It is beneficial for frequent traders as lower spreads translate to cost savings.
- Quicker Trade Execution
- With more buyers and sellers, trades can be executed almost instantaneously.
- It minimizes the risk of price slippage.
- Better Price Stability
- High liquidity provides a buffer against large price swings.
- It leads to more stable and predictable price movements.
- Lower Transaction Costs
- The combination of tighter spreads and reduced slippage results in lower transaction costs for traders.
What are Some Strategies Suitable for High Liquidity Environments?
In high liquidity environments, traders mostly follow these trading strategies:
| Aspects | Scalping | Day trading |
| Meaning |
|
|
| Example |
|
|
How Important is Order Flow Analysis in High Liquidity Markets?
Order flow analysis is crucial for understanding market dynamics in high liquidity environments. Mostly, it involves analyzing the flow of buy and sell orders to:
- Gauge market sentiment,
and
- Predict price movements.
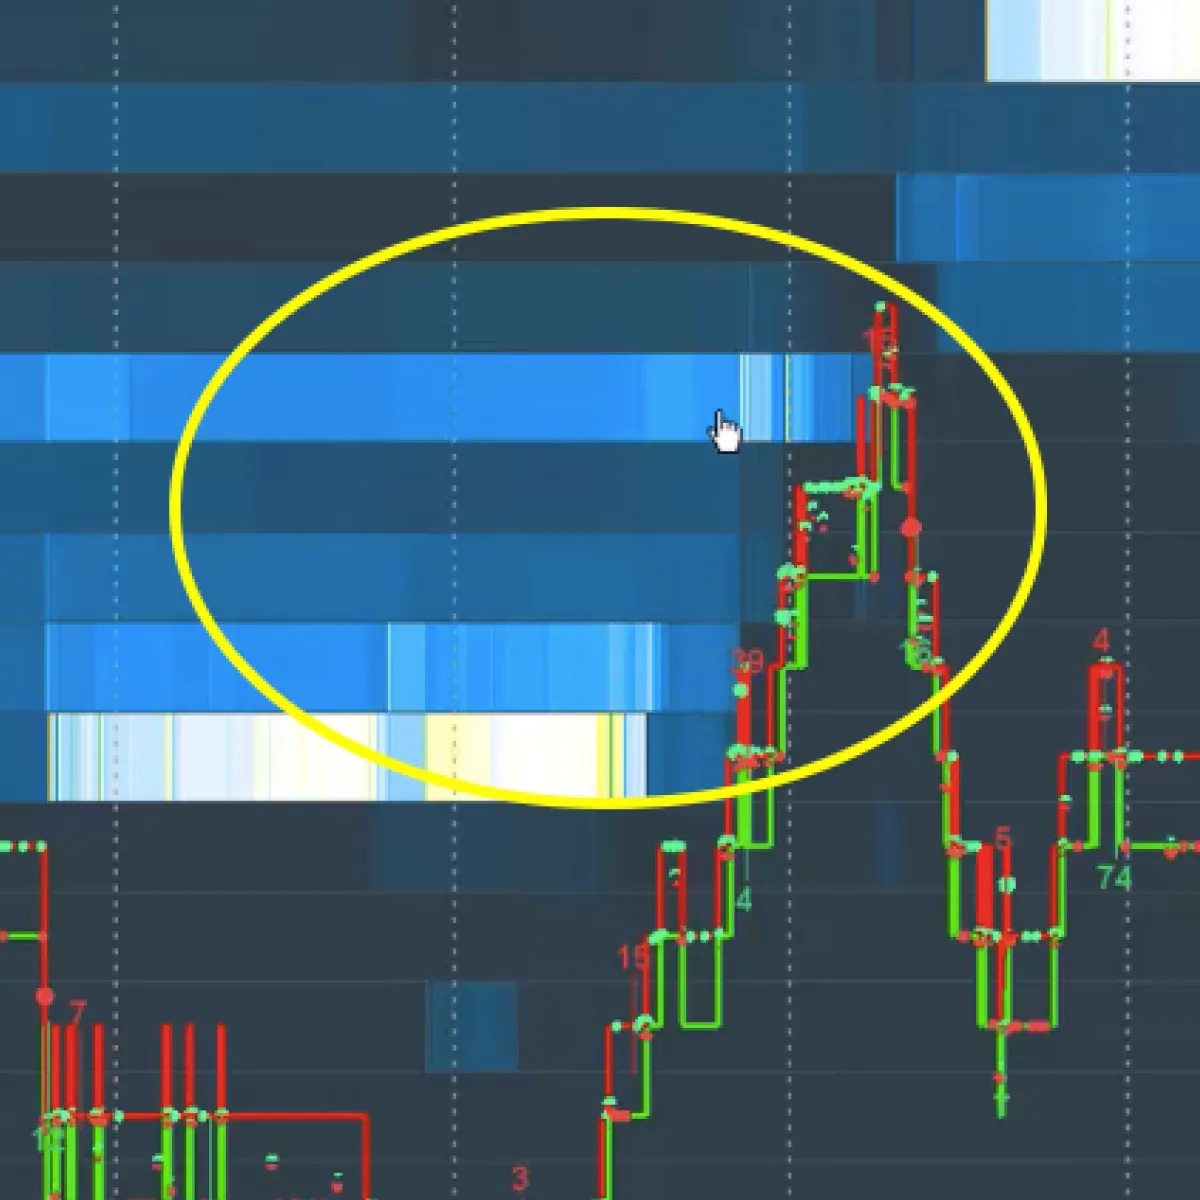
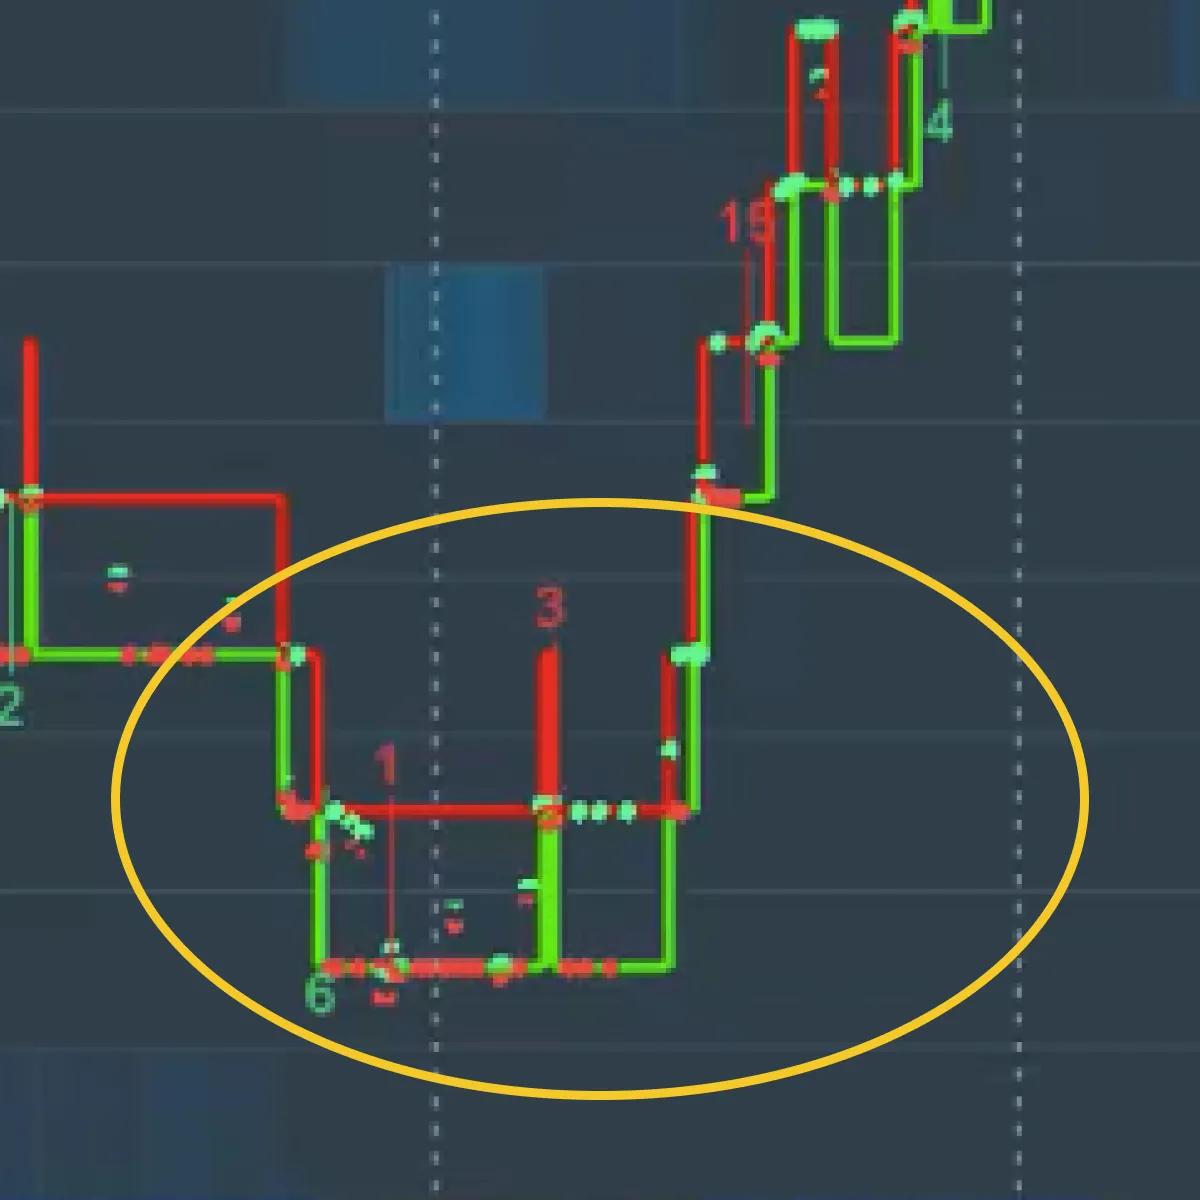
Advanced market analysis tools like Bookmap provide real-time visualizations of order flow. They show where buyers and sellers are placing their orders. By using these tools, traders can identify:
- Liquidity zones,
- Support and resistance levels,
and
- Potential breakout points.
For example,
- Let’s assume a trader is using Bookmap to see a concentration of buy orders at a particular price level.
- They anticipate this concentration as strong support.
- Now, if sell orders are “thin” above this level, it suggests an upward price movement.
Now, let’s study a step-by-step guide related to the scalping strategy practiced in high liquidity conditions:
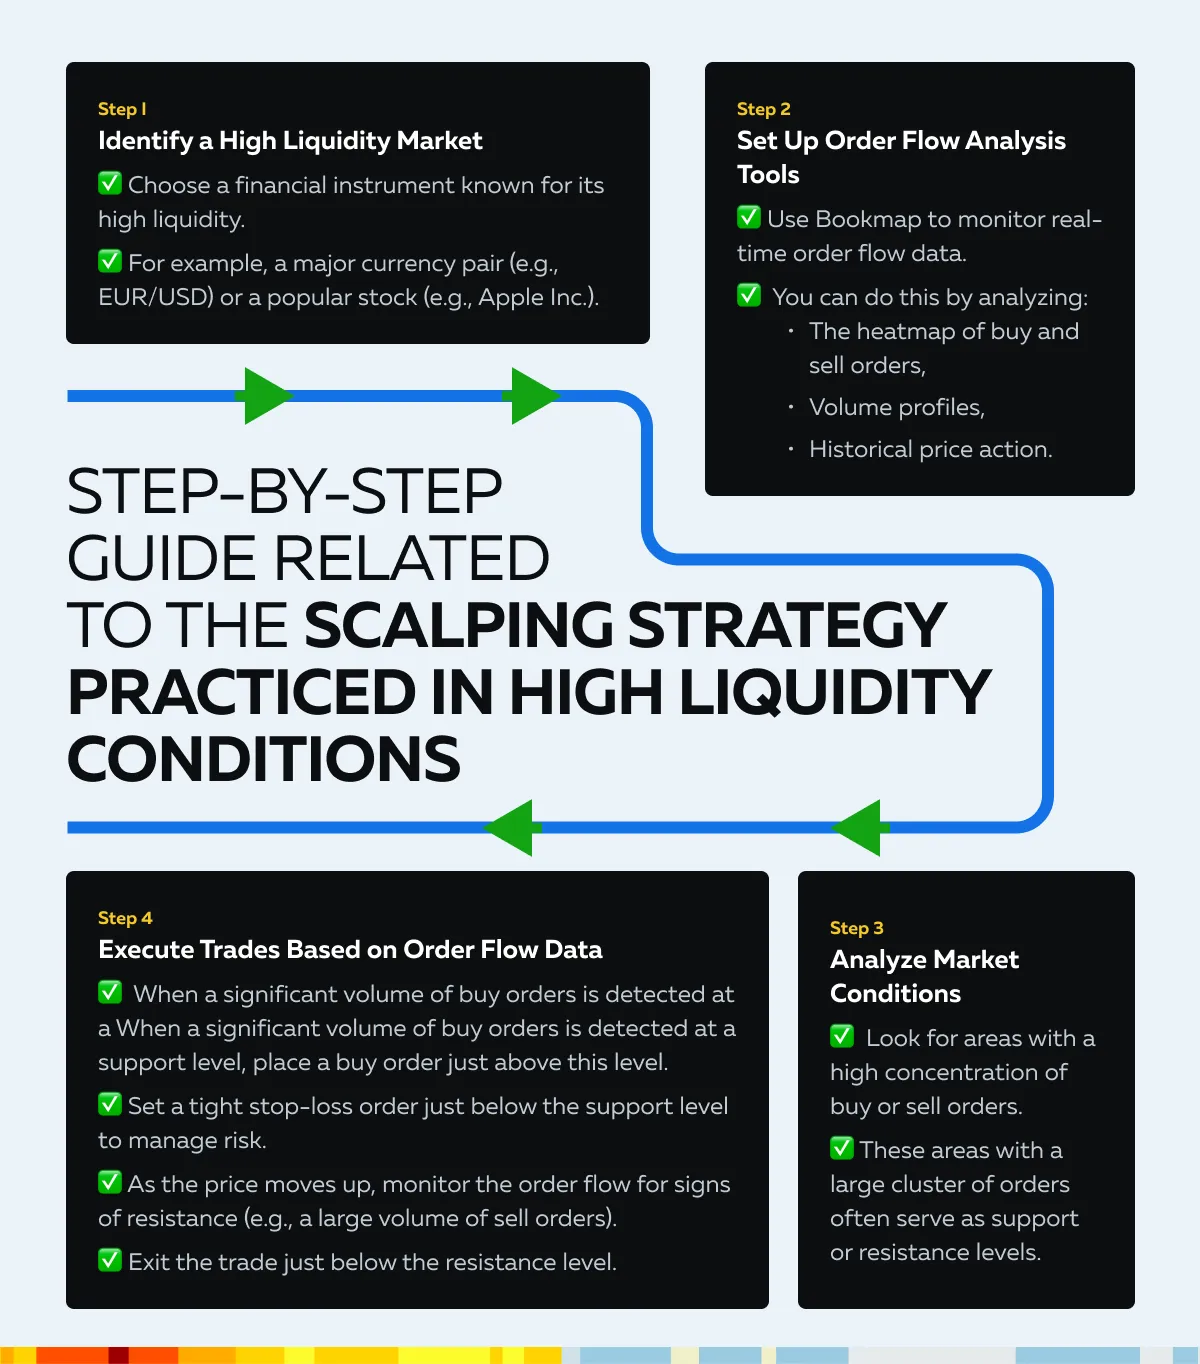
Putting in numbers:
- A trader uses Bookmap to see a large cluster of buy orders at $100 for a stock.
- The order flow shows minimal sell orders above $101.
- The trader, accordingly, places a buy order at $100.05 and sets a stop-loss at $99.90.
- As the price reaches $101, the trader notices an increase in sell orders.
- They decide to exit the trade at $100.95 after securing a small profit.
Risk Management in High Liquidity Markets
Stop-loss orders are crucial in managing risk, especially in high-liquidity markets, where price movements can be rapid and unpredictable. For the unaware, stop-loss orders automatically sell your position if the price moves against you, limiting your potential losses. They also help remove emotions from trading decisions and ensure that you stick to your risk management plan.
For a better understanding, let’s study an example related to precise stop-loss placement:
- A trader buys a stock at $100 with a tight spread of $0.01.
- They place a stop-loss order at $99.90, just 0.1% below the purchase price.
- This minimizes potential loss while providing enough room to avoid being stopped by minor fluctuations.
Some Tips on Appropriate Position Sizing
It is worth mentioning that proper position sizing is essential for:
- Minimizing risk
and
- Protecting your trading capital.
The first step in determining appropriate position sizing is related to the percentage of your account balance that you’re willing to risk on a single trade. A common rule is to risk no more than 1-2% of your total account balance on any trade. Let’s see an example showing how to calculate position size based on account balance and risk tolerance:
Say you have a $10,000 trading account, and you decide to risk 1% per trade. This means you will risk $100 per trade, which in percentage is 1%. Also, based on your analysis, the ideal stop-loss price is $99.90. Now, using the position sizing formula:
Position Size=Account Balance x Risk per trade entry price-Stoploss price
Position Size=$10,000 x 1%$100-$99.90
Additionally, you can adjust position size based on market conditions. Usually, in high liquidity markets, you can take larger positions due to the reduced risk of:
- Slippage
and
- Tighter spreads.
Moreover, always consider the volatility of the instrument you’re trading. More volatile instruments require smaller position sizes to manage risk effectively.
Strategies for Trading in Low-Liquidity Markets
Before moving on to the strategies, let’s first understand the various challenges faced in low liquidity markets. Generally, low-liquidity markets have wider spreads. That’s because, with fewer buyers and sellers, the bid-ask spread widens. In turn, this increases the cost of entering and exiting trades. Additionally, some other challenges are:
- Higher Volatility
- Low liquidity can cause sharp price movements.
- That’s because large orders have a greater impact on the market, which leads to higher volatility.
- Price Slippage:
- Due to low liquidity, executing trades at desired prices becomes difficult.
- This results in significant price slippage, where trades are filled at less favorable prices.
- Unpredictable Market Movements:
- Limited market participants and lower trading volumes lead to erratic price behavior.
- Such a situation makes it challenging to predict market movements.
What are Some Strategies Suitable for Low Liquidity Environments?
Swing trading and position trading are the two most preferred strategies for low liquidity environments. Let’s understand them in detail:
- Swing Trading:
- Swing trading involves holding positions for several days or weeks.
- The primary goal is to capture larger price movements.
- In this strategy, traders focus on significant price swings rather than short-term fluctuations.
- This helps in navigating low liquidity conditions.
- Position Trading:
- Position trading involves holding trades for longer periods, often months or even years.
- This time, the intention is to capitalize on major market trends.
- In this strategy, there is a reduced frequency of trades.
- This mitigates the impact of wider spreads and slippage.
What is the Role of Technical Analysis in Low Liquidity Markets?
Technical analysis is essential in low-liquidity markets. It helps to identify potential support and resistance levels. For the unaware, these levels indicate where prices have historically had difficulty moving above (resistance) or below (support). Traders use these levels to identify entry and exit points as they expect price reversals or breakouts at these points. For more clarity, let’s study an example:
- A trader observes that a stock has consistently bounced off a support level at $50.
- When the price approaches $50 again, the trader enters a buy position, anticipating a bounce back up.
- On the other hand, if the price approaches a resistance level at $60, the trader may enter a sell position or take a profit.
- This time, they expect the price to reverse downward.
How to Practice Swing Trading in Low Liquidity Conditions?
Let’s understand this process through a step-by-step guide:
Step I: Identify a Low Liquidity Market:
- Select a stock or financial instrument known for its lower trading volume and liquidity.
Step II: Set Up Technical Analysis Tools:
- Use charting software to analyze price movements.
- Specifically, focus on:
- Support and resistance levels,
- Trend lines, and
- Technical indicators such as the Relative Strength Index (RSI) and Moving Averages (MA).
Step III: Analyze Market Conditions:
- Look for stocks that are approaching significant support or resistance levels.
- Use indicators like RSI to gauge overbought or oversold conditions.
Step IV: Execute Trades Based on Technical Indicators:
| Entry point | Exit point |
Enter a buy position when the:
|
Plan to exit the trade when the:
and
|
Now, let’s put the above steps in numbers and see a scenario:
- Say a trader identifies a low liquidity stock trading at $48.
- The stock is nearing a strong support level at $47, which has historically held firm.
- The RSI is at 28, suggesting oversold conditions.
- The trader, therefore, decides to place a buy order at $47.50.
- The price rises to $52, where a resistance level is identified.
- The RSI now reads 72, indicating overbought conditions.
- The trader exits the trade at $51.50.
- They secure a profit while minimizing the risk of a sudden reversal.
Risk Management in Low Liquidity Markets
It is pertinent to note that in low-liquidity markets, placing a large order can significantly impact the price. Usually, it leads to unfavorable execution and increased volatility. Also, large orders can cause a rapid price increase or decrease. For traders, it makes it difficult to achieve the desired entry or exit price.
Hence, to minimize market impact, an ideal approach is to break up large orders into smaller ones.
You can do so by executing smaller orders incrementally over time rather than all at once. This helps to blend in with normal market activity and reduce the likelihood of significant price movements.
For Example:
- Say you want to buy 1,000 shares of a low-liquidity stock.
- Now, consider breaking it into ten orders of 100 shares each, spaced out over a period.
- This reduces the risk of pushing the price up due to a large buy order.
How to Use Limit Orders to Control Entry and Exit Prices?
Limit orders enable you to specify the maximum price you would conveniently pay for a buy order or the minimum price you would accept for a sell order. Using these orders, you can:
- Avoid price slippage,
- Ensure that your trades are executed at desired price levels or better, and
- Confidently surpass unfavorable prices caused by low liquidity.
These limit orders are of utmost importance in low-liquidity environments. Let’s see how:
- Limit orders provide more control over your trading.
- Using them, you can prevent trades from being executed at unexpected prices due to sudden market movements.
- They ensure that you enter or exit trades only when the market reaches your specified price. This reduces the risk of adverse price execution.
For example:
- Say you want to buy a stock at $50 in a low liquidity market.
- Now, you place a limit order at $50.
- This means your order will only be executed if the stock can be purchased at $50 or lower.
- If the price rises above $50 due to a lack of sellers, your order will not be executed.
- This way, you get protected from overpaying.
Adapting to Changing Liquidity Conditions
Be aware that market liquidity is not static. It changes throughout the trading day due to various factors, such as the following:
- Economic events,
- News releases, and
- Market sentiment.
This creates the need for monitoring liquidity, as keeping an eye helps traders understand the current market conditions. Also, awareness of liquidity levels helps in managing risks effectively by avoiding situations where trades could be executed at unfavorable prices.
Now, to optimize performance and minimize risks, traders must be adaptable. They must adjust their strategies according to the prevailing liquidity conditions. For a greater comprehension, let’s study an example related to switching strategies from scalping to swing trading, based on liquidity:
- Say a trader normally uses a scalping strategy in a high-liquidity market.
- They take advantage of tight spreads and quick price movements.
- However, if liquidity decreases, spreads widen.
- This causes price movements to become more erratic.
- In this case, the trader may find scalping less effective and decide to switch to a swing trading strategy.
- This approach involves holding positions for several days or weeks to capture more significant price changes.
Putting in numbers:
- The trader identifies a stock trading at $50 with a known support level of $47.
- Due to lower liquidity, the spread widens, and the price becomes more volatile.
- The trader then places a buy order at $47.50 with a plan to hold the position for a few days and then sell at a resistance level of $55.
- They set a stop-loss at $46 to protect against significant losses.
- The trader uses technical indicators like the RSI and moving averages to monitor the stock’s performance.
- Then, as the price moves in their favor, they adjust the stop-loss level accordingly.
Conclusion
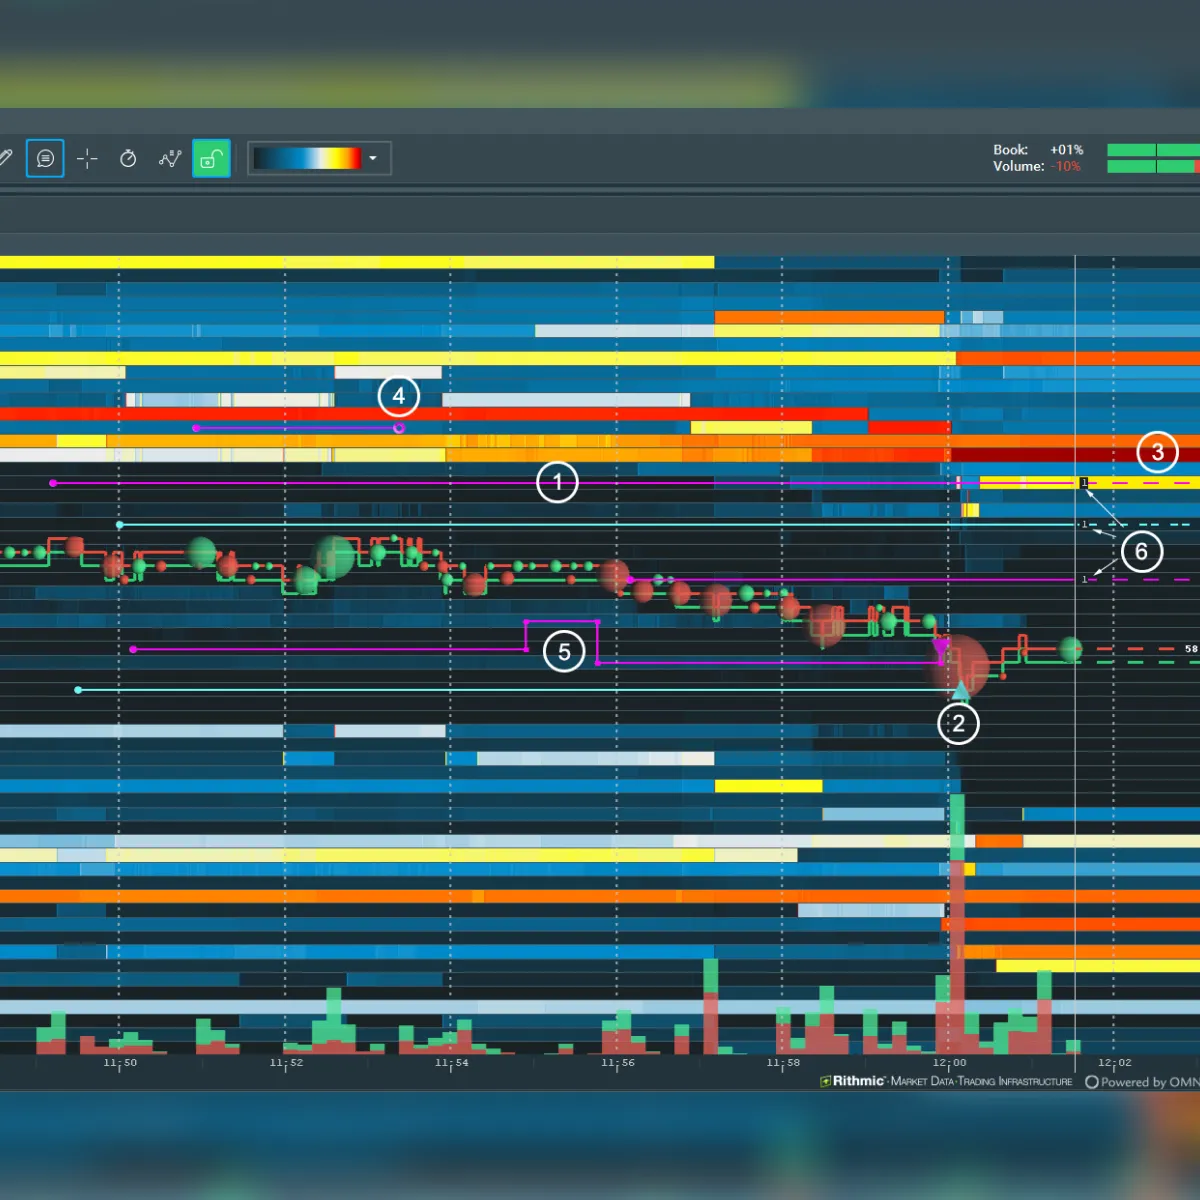
For increased market success, traders should adapt their trading strategies to different liquidity conditions. This can be done by recognizing genuine liquidity zones and understanding the impact of large orders. Also, by leveraging heatmap data, traders identify optimal entry and exit points and minimize risks.
For those looking to elevate their market analysis and trading accuracy, considering advanced market analysis tools like Bookmap can be highly beneficial. Bookmap’s sophisticated platform provides real-time heatmap data and comprehensive market insights. These features allow traders to make more informed decisions.
Are you ready to take your trading to the next level? Sign up for Bookmap’s advanced tools and start making more accurate trading decisions today. Let’s get started.
Sign Up Now