See order flow more clearly in real time.
Compare plans to access deeper market visibility for order flow.
Education
October 20, 2024
Updated
SHARE
Can Real-Time Order Flow Give You an Edge in Scalp Trading?
In scalp trading, decisions are usually made in seconds – sometimes in even split seconds! In such a fast-paced trading, can you afford to miss a clear understanding of market movements?
Certainly, not! But how can you gain this understanding?
Through this article, we will walk you through the importance of using a specialized technique called “real-time order flow analysis” that can substantially improve your scalp trading strategy. You’ll learn what real-time order flow analysis is, why it’s important, and how traders use it to gain insights into buying and selling pressure. We’ll also explore key order flow indicators like volume analysis and delta indicators and show how they can signal potential breakout or reversal points.
Additionally, we will cover how to implement real-time order flow tools, such as those offered by Bookmap, in your strategy, such as heatmaps, DOM Pro, and Footprint charts. You will understand how to identify market momentum and make quick decisions.
Also, you’ll discover the importance of adjusting your scalping strategies during major economic events so that you can better deal with increased volatility and maximize profit opportunities. Finally, we’ll provide an example of a successful scalp trade using real-time order flow and show how these tools can help you spot opportunities and execute profitable trades. Let’s begin.
What is Real-Time Order Flow Analysis?
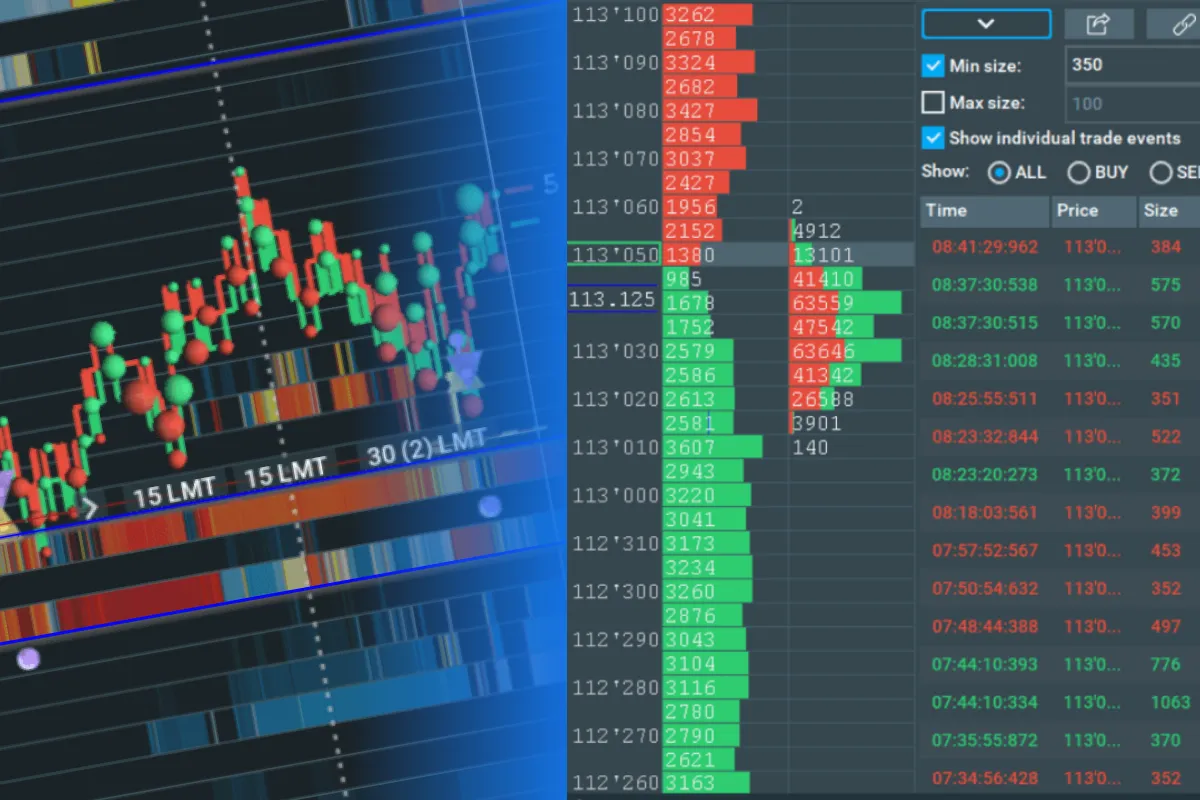
Real-time order flow analysis refers to monitoring and interpreting the flow of buy and sell orders in the market as they occur. This analysis gives traders a detailed view of the market’s microstructure. It allows them to observe the actual trading activity. By tracking the order flow, traders gain insights into the current market sentiment and obtain valuable information about buying and selling pressure.
For example,
- Say a trader sees a surge in buy orders at a particular price level.
- They can infer strong buying interest, which can push prices higher.
- Whereas an influx of sell orders can indicate potential downward pressure on the price.
It must be noted that this real-time visibility allows traders to react quickly to changes in market sentiment. It is for this reason that real-time order flow analysis is particularly beneficial for scalp traders who rely on making rapid decisions to capitalize on small price movements.
Since scalp traders operate in short time frames, the ability to see and interpret live order flow becomes highly important for them. See the graphic below to check how it helps them:
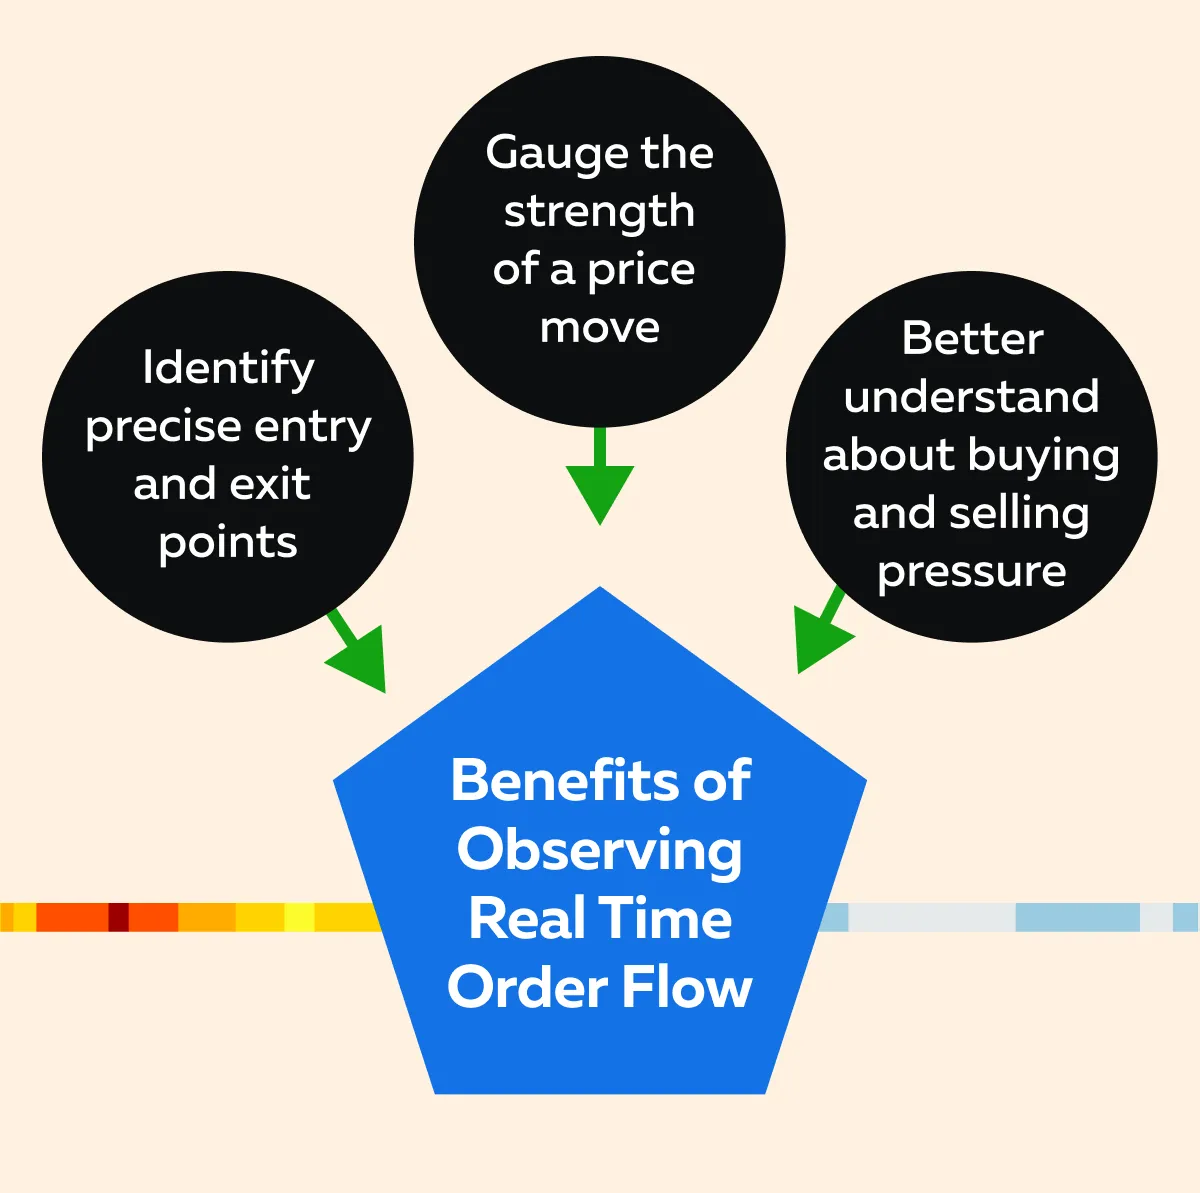
Furthermore, one of the key advantages of real-time order flow analysis is the ability to detect shifts in market momentum as they happen. By monitoring the order flow, traders can spot when buying or selling pressure is increasing or decreasing. This indicates a potential reversal or continuation of the current trend. Such a capability is invaluable for traders as it helps them stay ahead of market movements.
Do you wish to know about the latest order flow analysis techniques and tools? Read our exclusive article today and enhance your knowledge base.
Key Order Flow Indicators for Scalp Trading
For the unaware, order flow indicators are certain tools that can lead to more informed and profitable trades. These indicators provide real-time data on market activity and help traders identify key moments to enter or exit positions. Let’s check them out:
Volume Analysis
- Volume analysis reflects the intensity of trading activity at different price levels.
- High trading volume often correlates with significant market movements.
- This correlation makes it a key indicator for potential breakout or reversal points.
Let’s understand how traders use it under different scenarios:
| Scenario I: A trader observes a spike in volume at a resistance level | Scenario II: A trader observes a spike in volume at a support level |
|
|
Delta Indicators
- Delta indicators measure the net difference between buying and selling orders.
- These tools offer insights into the underlying market sentiment.
- Often, a positive delta suggests that buying orders are dominating.
- Usually, it is a sign of strong buying interest.
- When it comes to scalp traders, this information is invaluable.
- That’s because it helps them identify opportunities for quick gains.
For example,
Say a scalp trader notices a rising positive delta. Now, they have decided to enter a long position as they are anticipating a short-term upward move in the market.
Use our real-time insights to sharpen your scalp trading. Start here!
How to Implement Real-Time Order Flow in Your Scalping Strategy?
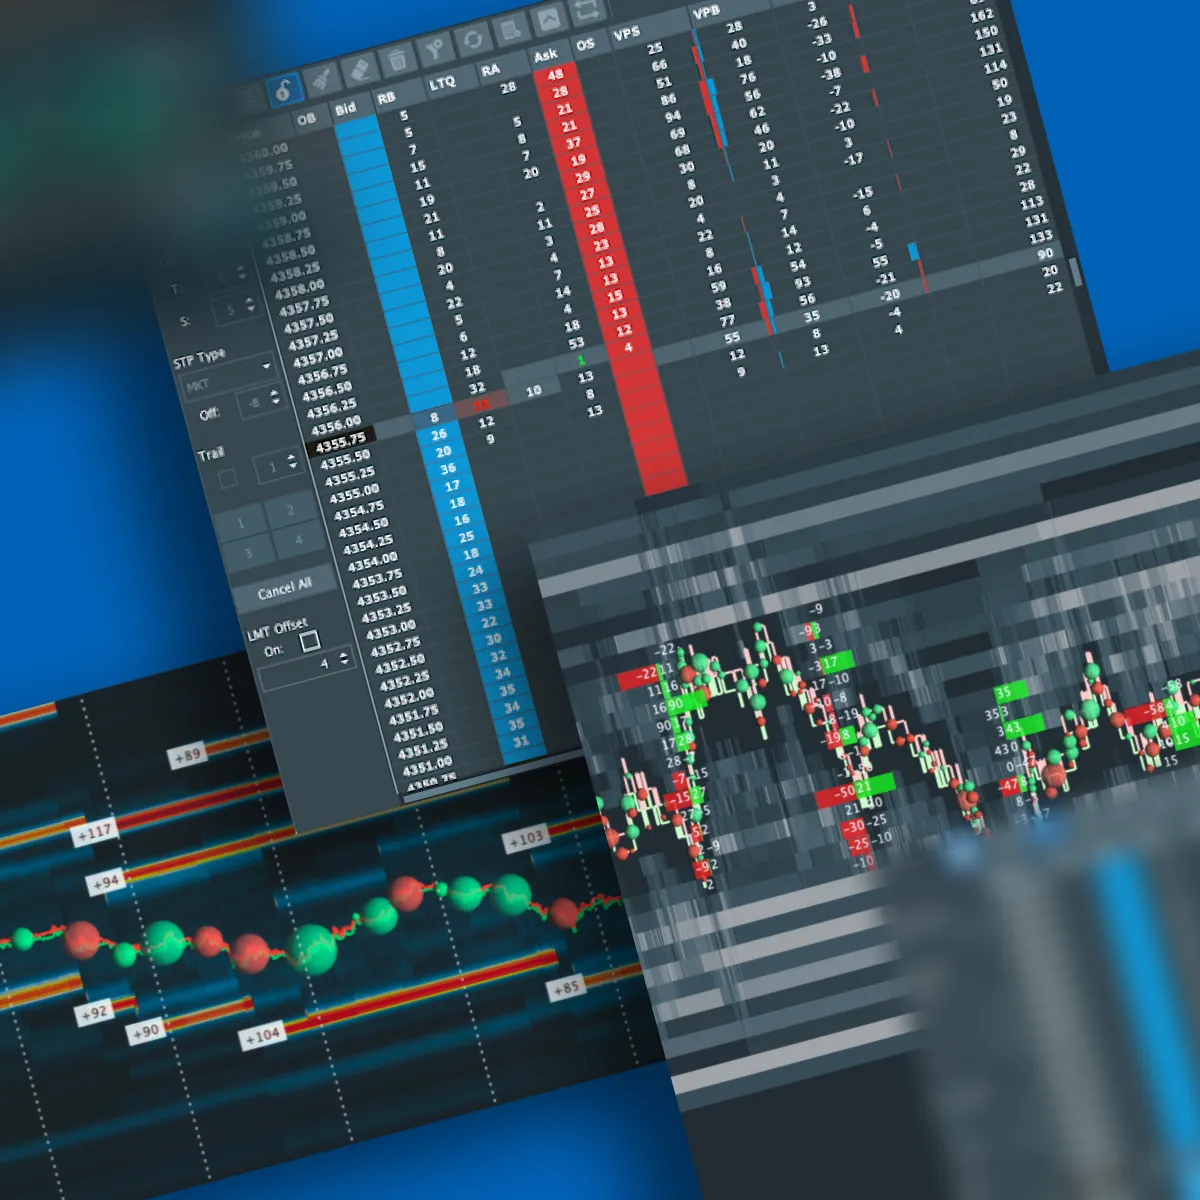
To implement real-time order flow into your scalping strategy, you need the right tools and an understanding of how to interpret the data they provide. Ideally, you should prefer using advanced market analysis tools like Bookmap.
They offer modern features that give traders deep insights into market dynamics. Using these insights, traders can make quick and informed decisions. Let’s check out how you can set up and use these tools on Bookmap:
- Set Up Real-Time Order Flow Tools on Bookmap
To begin, you’ll need to set up real-time order flow tools. These tools provide a detailed view of the market’s microstructure. Using them, you can observe live market orders, liquidity, and trade executions. By integrating these tools into your trading platform, you can enhance your ability to anticipate market moves.
- Liquidity Heatmap for Visualizing Market Depth
One of the most powerful tools offered by Bookmap is the “liquidity heatmap.” It visually represents the depth of the market by displaying where liquidity is resting. Moreover, the heatmap shows areas where large orders are sitting in the order book . By using it, most traders anticipate potential market moves.
For example, say a significant amount of liquidity is clustered at a certain price level. Now, it could act as a magnet and draw the price toward it.
Hence, by monitoring these levels, scalp traders can take better advantage of potential breakouts or reversals.
- DOM Pro Tool to Understand Market Depth
The Depth of Market (DOM) Pro add-on offered by Bookmap is another important tool for scalp traders. It provides a single-click order entry interface and displays real-time market depth alongside recent trades. The DOM Pro tool aggregates this data into a split volume profile and offers a detailed view of where volume is concentrated and how the market is moving.
For scalp traders, the DOM Pro tool is invaluable. That’s because it identifies real-time shifts in supply and demand. For example, say the DOM Pro tool shows a sudden increase in buying interest at a specific level. Now, a scalp trader might enter a long position, expecting a short-term price rise.
- Footprint Add-on for Analyzing Order Flow in Detail
The Footprint add-on provides a granular view of order flow. It shows the actual buy and sell volumes at each price level within a given time frame. This allows traders to see the underlying buying and selling pressure.
The Footprint chart is particularly useful in scalp trading for spotting when the market is likely to reverse or continue based on the volume distribution at key price levels.
For more clarity, let’s study an example showing how to use footprint charts for scalping:
Assume that a trader uses “footprint charts” to detect a cluster of aggressive buying at a specific price. This suggests a potential short-term support level. See the graphic below to check how this insight helps the trader:
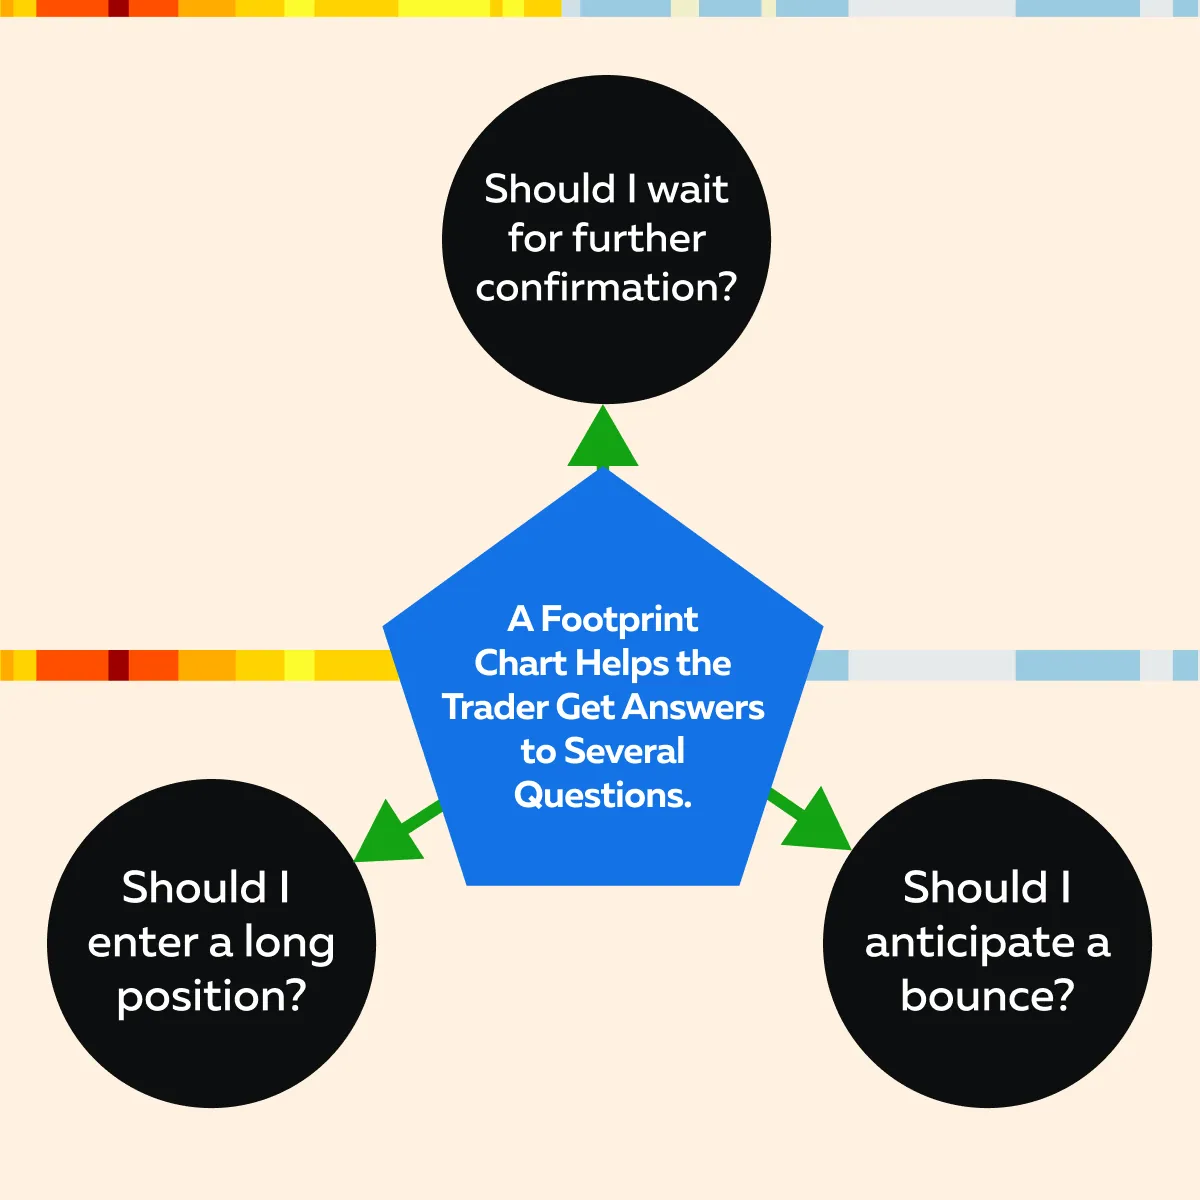
Now, by getting satisfactory answers to the above questions and analyzing the Footprint chart, the trader can:
- Gauge the strength of the buying interest
and
- Determine the optimal entry and exit points for their scalp trade.
Moreover, it is worth mentioning that reading and interpreting real-time order flow data is highly important, especially in fast-paced strategies like scalping. That’s because by closely monitoring the order book and understanding the behavior of orders, traders can identify key opportunities to enter and exit trades within seconds. Let’s check how to do so using the technique of “Liquidity Vacuums”.
- A liquidity vacuum occurs when there is little to no liquidity at certain price levels in the order book.
- These vacuums signal potential breakout points or areas where the price might move quickly due to a lack of resistance.
For a better understanding, let’s study a scenario related to trading in a liquidity vacuum:
Say a trader is monitoring a stock. They notice a liquidity vacuum just above the current price level. The order book shows a gap where no large sell orders are present. This implies that if the price rises in this area, there will be little resistance to slow it down. Now, the trader quickly enters a long position. They are expecting the price to surge through the vacuum.
As the price moves up, the trader watches for any signs of large orders being placed, which could fill the vacuum and halt the move. Once the price reaches a level where resistance begins to build, the trader exits the trade. This way, they capture a quick profit within seconds.
Additionally, it is significant to mention that understanding common order flow patterns helps scalp traders to act quickly on real-time information. Let’s check out some key patterns to look for:
- Stacking and Pulling of Orders
- “Stacking” occurs when a large number of buy or sell orders are suddenly added to the order book at a particular price level.
- This addition indicates strong interest at that level.
- Whereas, “pulling” happens when orders are quickly removed from the book.
- Often, it triggers reactions to changes in market sentiment.
- Spoofing
- Spoofing is a tactic where large orders are placed with no intention of being executed.
- Usually, it is done to manipulate the market by creating a false sense of supply or demand.
- Spoofers take advantage of this artificial pressure and position themselves to profit when the spoofed orders are withdrawn.
- Large Order Imbalances
- When there is a significant imbalance between buy and sell orders, it often indicates that a strong move is about to occur.
- For example,
- Say there is a large imbalance with far more buy orders than sell orders.
- Now, it suggests that buying pressure is overwhelming, and the price is likely to rise.
- Scalpers use this information to enter trades in the direction of the imbalance.
Adjusting Scalping Strategies During Major Economic Events

“Scalping strategies require careful adjustments during major economic events, such as
- Federal Open Market Committee (FOMC) meetings
or
- The release of employment figures.
Usually, these events cause sharp and unpredictable market movements. This happens because major economic events often lead to increased volatility as market participants react to new information. These price movements present both significant opportunities and heightened risks for scalpers.
Hence, you, as a scalper must adjust your scalping strategies in a way to protect against expected losses while positioning yourself to capitalize on market reactions. Let’s understand better through a hypothetical example:
- Say a trader is preparing for an upcoming FOMC meeting.
- The outcome is expected to significantly impact interest rates.
- The trader anticipates increased volatility as the market reacts to the committee’s announcement.
Now, to manage this risk, the trader can adjust their scalping strategy in several ways:
| Technique I: Reducing Position Size | Technique II: Widening Stop-Loss Orders | Technique III: Monitoring Order Flow for Clues |
|
|
|
Refine your scalping strategy with real-time data using Bookmap – Join now!
How to Monitor Order Flow and Market Reactions using DOM Pro and Footprint charts?
During economic events, traders can use real-time data from tools like the “DOM Pro” and “Footprint charts.” These tools allow traders to track rapid changes in buying and selling pressure.
For example,
- Say after the immediate release of employment figures, a trader notices a sudden increase in buying pressure through the DOM Pro tool.
- The tool shows a large imbalance in favor of buy orders.
- Simultaneously, the Footprint chart shows a liquidity vacuum at higher price levels.
- This situation suggests that the price could surge upward due to minimal selling resistance.
- Recognizing these signals, the trader quickly enters a long position.
- They try to capitalize on the emerging trends before the market stabilizes.
Find your edge in scalp trading with Bookmap’s real-time order flow tools. Sign up today!
How to Adjust Entry and Exit Points?

Increased volatility during major economic events requires scalpers to be flexible with their entry and exit points. One popular strategy is to wait for the initial market reaction to subside before entering a trade. This strategy allows the trader to avoid being caught in erratic price swings.
Alternatively, if the trader identifies a clear trend from the order flow data, they can choose to enter the market quickly by using tighter stop-losses to manage risk.
Again, let’s understand better through a hypothetical example related to timing entries after initial volatility:
- For example, a trader anticipates volatility after an employment report.
- They initially hold off on entering a position until the first wave of price swings has passed.
- Once the market begins to settle, the trader looks for confirmation from the heatmap and Footprint charts.
- They observe that a new trend is forming, such as persistent buying pressure and diminishing sell orders.
- Now, the trader enters the market with a tighter stop-loss.
- It allows for dynamic trade management based on real-time order flow data.
- This approach helps the trader capitalize on the new trend while minimizing the risk of being caught in a volatile reversal.
Example: Order Flow Success in Scalp Trading
Real-time order flow analysis significantly enhances a scalper’s ability to make quick and profitable trades. Let’s study an example of how a trader successfully executed a scalp trade using various order flow tools.
A) Spotting the Opportunity
- A trader closely monitors the Depth of Market (DOM).
- They notice a significant buy-side order imbalance.
- The DOM shows large orders stacking on the bid, while the ask side appears relatively thin.
- This imbalance suggests that the buyers are more aggressive.
- Also, there’s a potential for an upward price move.
- The trader then checks the heatmap.
- Now, they see a key liquidity level just above the current price.
- At this level, large orders are sitting and are acting as a magnet for the price.
B) Entering the Trade
- With the order flow data indicating strong buying pressure, the trader decides to enter a long position.
- The Bookmap’s heatmap shows a liquidity vacuum just above this level.
- This means there is minimal resistance, and the price could move quickly once it breaks through.
- Now, the trader times their entry precisely as the price begins to break into the liquidity vacuum.
- They anticipate a rapid upward move.
C) Exiting the Trade
- As the trade progresses, the trader continues to monitor the Cumulative Volume Delta (CVD) and DOM for signs of weakening buying pressure.
- The CVD, which tracks the net difference between buying and selling, starts to flatten out.
- This flattening indicates that the buying pressure may be losing steam.
- Simultaneously, the trader observes on the heatmap that the price is approaching the next significant resistance level. At this level, large sell orders are visible.
- Anticipating a reversal or a slowdown in the upward momentum, the trader decides to exit the trade.
- The decision is timed perfectly as the price nears the resistance level.
- This allows the trader to lock in a quick profit.
Conclusion
Real-time order flow analysis offers significant benefits for scalp traders. It provides a clear view of market dynamics that other methods might miss. By using advanced market analysis tools like Bookmap and its features, such as the DOM Add-on, liquidity heatmap, and Footprint charts, traders can see the actual buying and selling pressure. They can easily spot liquidity vacuums and even identify order imbalances in real-time. By gaining such advanced information, traders can quickly enter and exit trades with precision and confidence.
Moreover, the ability to monitor how the market absorbs new information, especially during volatile periods like major economic events, gives scalpers a critical edge. Also, real-time data helps traders anticipate market moves, manage risk effectively, and maximize profit potential.
If you’re serious about improving your scalp trading, try to integrate real-time order flow analysis into your current approach. Additionally, check out more info on our latest indicator to improve your trading game. Join us now and feel the difference!
Sign Up Now