See market more clearly in real time.
Compare plans to access deeper market visibility for market.
Education
July 18, 2024
SHARE
Cut Through the Chaos: Market Analysis Amidst the Noise
Amid the market’s clamor, traders strive for clarity. Indeed, the abundance of information in financial markets can overwhelm traders. This creates the necessity of honing trading skills to effectively sift through the market noise.
This article will demonstrate how technical analysis and innovative platforms, such as Market Pulse help traders improve their decision-making and achieve better trading outcomes. We’ll study different techniques like volume analysis, price change analysis, and monitoring of market events that help traders filter out irrelevant data and concentrate on significant trends.
Additionally, we’ll highlight the role of Market Pulse as a cutting-edge tool that streamlines market analysis and provides actionable insights derived from advanced algorithms. Let’s get started.
What is Market Noise?
Market noise refers to irrelevant or misleading information that makes it challenging for traders to discern meaningful trends or signals.
Often rooted in rumors, it may cause short-term fluctuations in asset prices. However, it does not substantially affect the underlying fundamentals that can drive long-term market movements. Let’s see some common characteristics of market noise:
- Short-Term Volatility
-
-
- Market noise often causes short-lived fluctuations in prices.
- These short-term price changes usually happen due to:
- Investor sentiment,
- Speculative trading, or
- Temporary imbalances in supply and demand.
-
- Irrelevance to Fundamentals
-
-
- Noise obscures the common fundamental factors such as:
- Company earnings,
- Economic indicators, and
- Geopolitical developments.
- Noise obscures the common fundamental factors such as:
-
- Excessive Information
-
-
- In the age of instant communication and widespread access to financial data, traders are overwhelmed with an astounding quantity of data from various sources.
-
- Lack of Accuracy
-
- Usually, much of the information in the market noise is:
- Inaccurate,
- Exaggerated, or
- Based on rumors and speculation.
- Usually, much of the information in the market noise is:
How Market Noise Causes Confusion
Market noise often causes confusion and misinterpretation of market trends. It impacts traders in several ways:
| HOW MARKET NOISE IMPACT TRADERS? | What Traders Do Under the Influence of Market Noise? |
| False Signals |
|
| Overreaction |
|
| Loss of Focus |
|
| Herding Behavior |
|
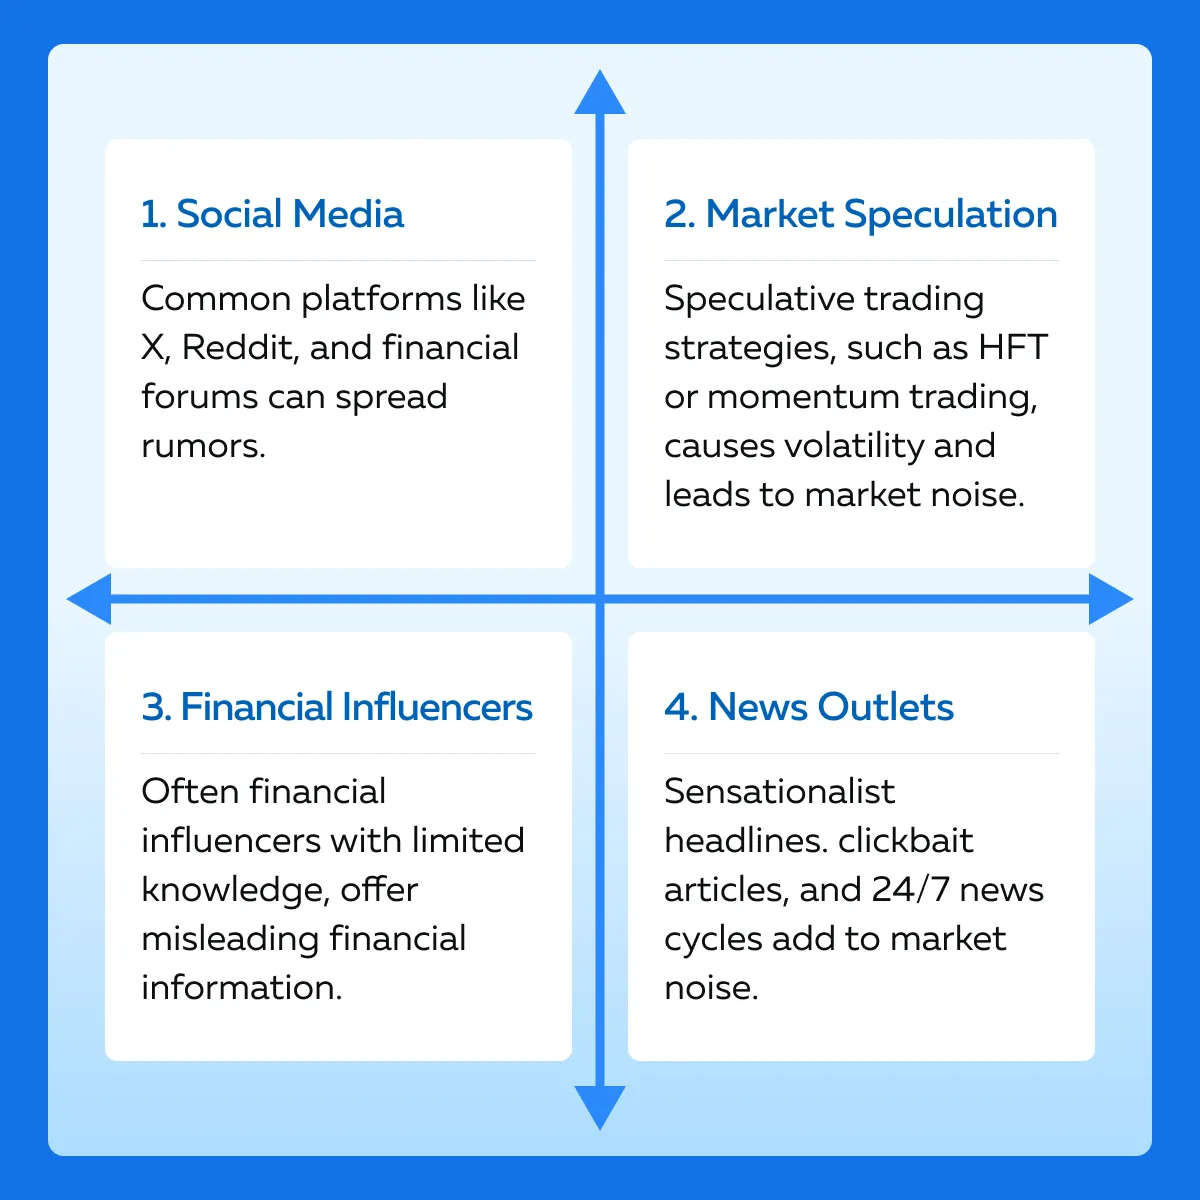
What are Some Common Sources of Market Noise?
3 Key Techniques for Filtering Out Market Noise
To reduce the impact of market noise on trading decisions, traders need to filter information carefully. To do so, traders must:
- Focus on long-term fundamentals,
- Employ robust risk management strategies, and
- Maintain a disciplined approach to decision-making.
Additionally, traders must perform technical analysis or sentiment analysis to separate signals from noise and identify genuine market trends. Let’s see three popular techniques for doing so.
A) Focus on Technical Analysis
Technical analysis is the study of past market data, primarily focusing on price and volume. It is employed to discern trends and predict future price movements. Most traders analyze historical price patterns and trends to:
- Distinguish meaningful market signals from mere noise,
- Identify potential trading opportunities, and
- Assess the overall direction of the market.
Some Useful Technical Analysis Tools
Traders use several tools to perform technical analysis and filter out irrelevant data. Let’s study some popular tools that can help you identify meaningful patterns:
- Moving Averages (MAs)
-
-
- MAs help traders to identify the direction of the trend amidst daily price fluctuations.
- There are two most used types of moving averages:
- The simple moving average (SMA) and
- The exponential moving average (EMA).
- The closing prices of an asset are averaged over a specific period to calculate both the above listed moving averages.
- These moving averages help traders smooth out short-term price fluctuations and effectively discern the underlying trend.
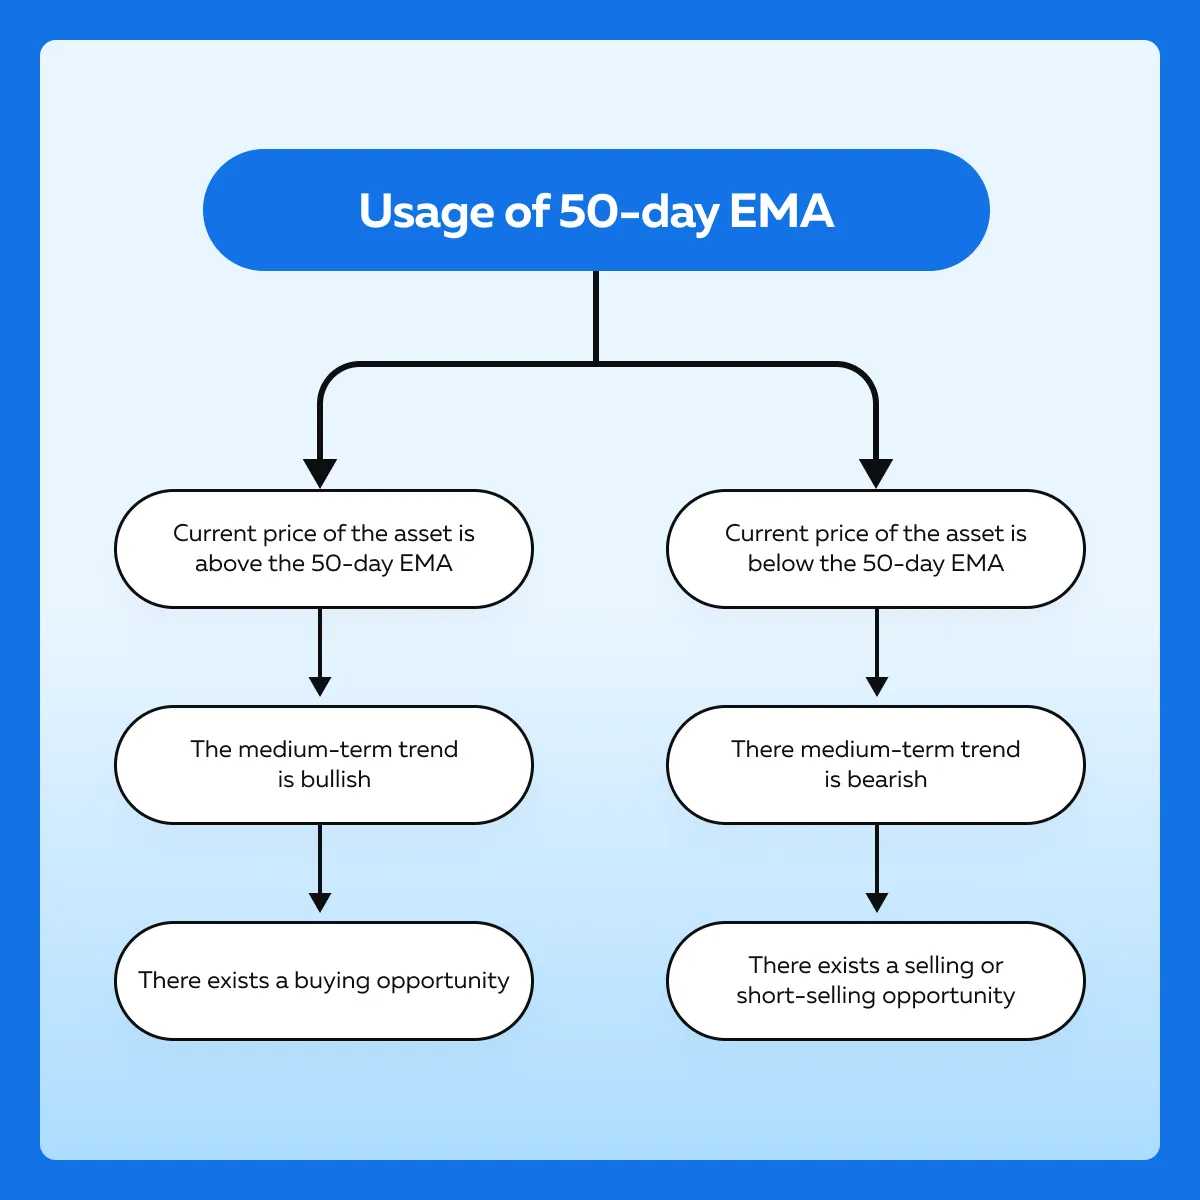
- For example,
- Traders use the 50-day EMA indicator to determine an asset’s average closing price spanning the past 50 trading days.
-
- 50-day EMA assigns more weight to recent prices and helps traders identify the medium-term trend direction.
- Bollinger Bands
-
-
- Bollinger Bands comprise of:
- A middle band (normally a 20-period moving average) and
- Two outer bands that indicate volatility based on standard deviations.
- Any price movement outside the bands suggests overbought or oversold conditions.
- This analysis enables traders to sift out noise and distinguish potential reversal points.
- Bollinger Bands comprise of:
-
- Relative Strength Index (RSI)
-
-
- The RSI is a momentum oscillator.
- It calculates the pace of recent price movements.
- RSI has a range of 0 to 100 and is used to determine overbought or oversold conditions.
- When the RSI value exceeds a certain threshold, typically 70, the asset is considered overbought.
- When the RSI value falls below a certain threshold, typically 30, the asset is considered oversold.
-
- MACD (Moving Average Convergence Divergence)
-
- The MACD is a trend-following momentum indicator that:
- Measures the difference between two exponential moving averages (typically 26-period EMA and 12-period EMA) and
- Plots it against a signal line (often a 9-period moving average of the MACD line).
- Traders use MACD crossovers and divergences to filter out noise and identify trend changes.
- The MACD is a trend-following momentum indicator that:
B) The Power of Volume Analysis
Volume analysis is a powerful tool in technical analysis that helps traders:
- Gauge the strength of market movements and
- Confirm the validity of price trends.
Let’s see how volume analysis helps traders:
| Assesses the Strength of Market Movements | Indicates Confirmation of Trend Strength |
|
|
How Does Volume Analysis Help in Trend Confirmation?
Volume analysis helps traders validate breakouts from trend lines or resistance levels. Understand through the graphic below:
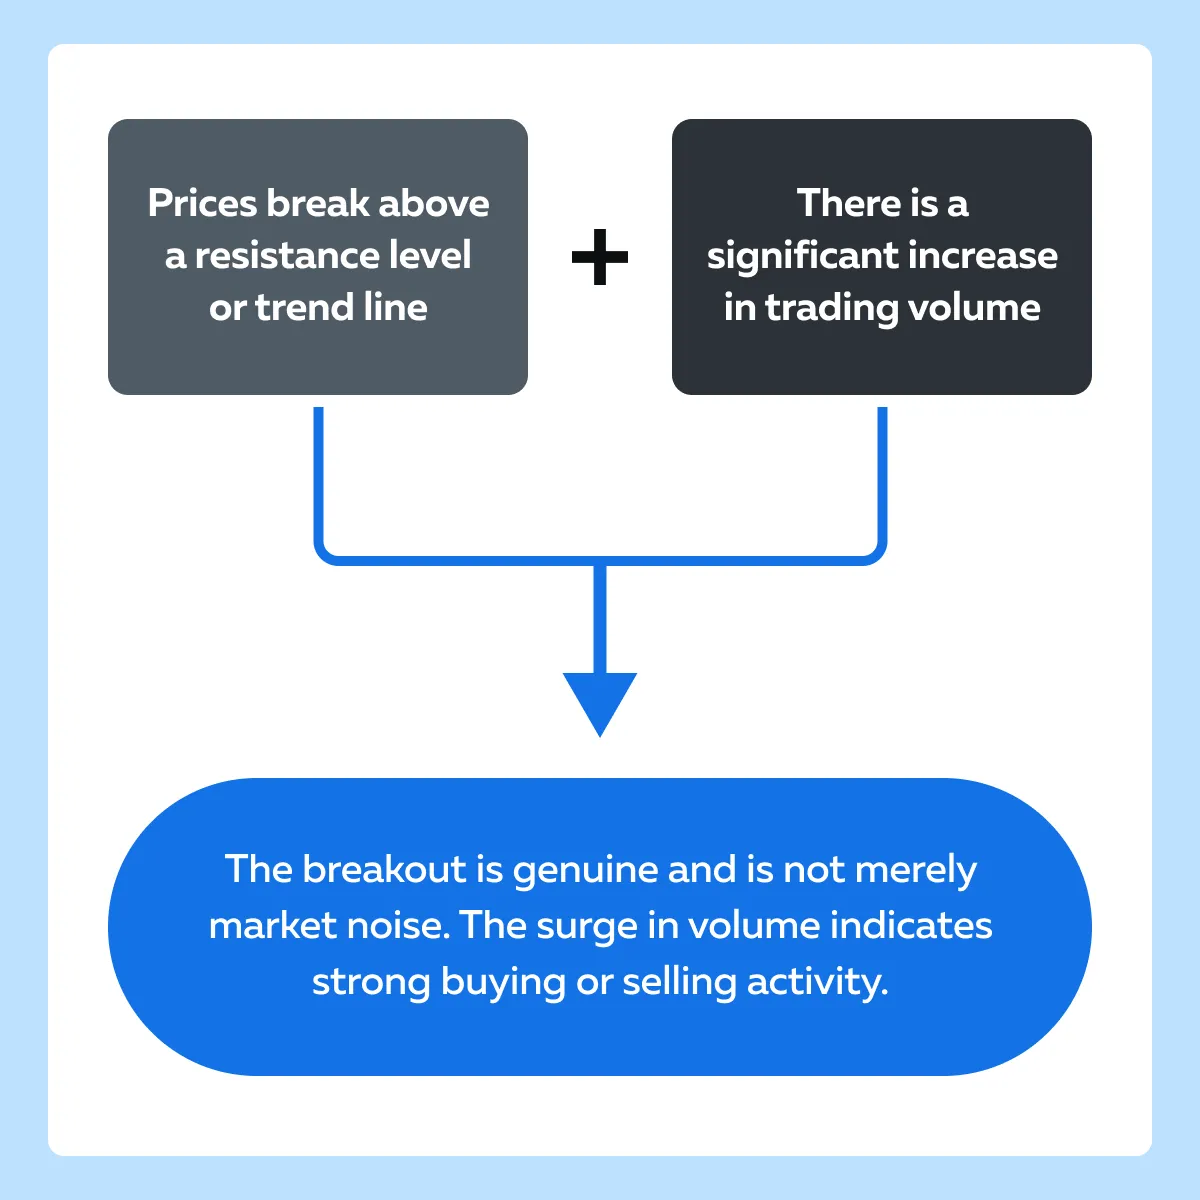
Let’s also see a hypothetical example:
- A stock has been trading within a narrow range for an extended period.
- It is bounded by a resistance level
- Traders observe the price action and notice a breakout above the resistance level
- This observation signals a potential bullish move.
- However, to confirm the validity of the breakout, they look at the accompanying volume.
C) Using Market Pulse
Market Pulse is a cutting-edge tool designed to revolutionize how traders monitor market events and filter out noise. Unlike traditional market analysis tools, Market Pulse uses advanced algorithms to:
- Integrate multiple data sources and
- Present a clearer picture of market behavior.
Therefore, traders using this technique can focus on the data that matters most. Its sophisticated algorithms identify the most relevant:
- Key trends,
- Patterns, and
- Market signals.
Let’s study them in detail.
What is the Volume Pressure Algorithm?
The Volume Pressure algorithm within Market Pulse assesses the buying and selling pressure in the market based on trading volume events over a specified period. Because this algorithm is compatible with any instrument, traders across different markets consider it a versatile tool.
Here’s how it works:
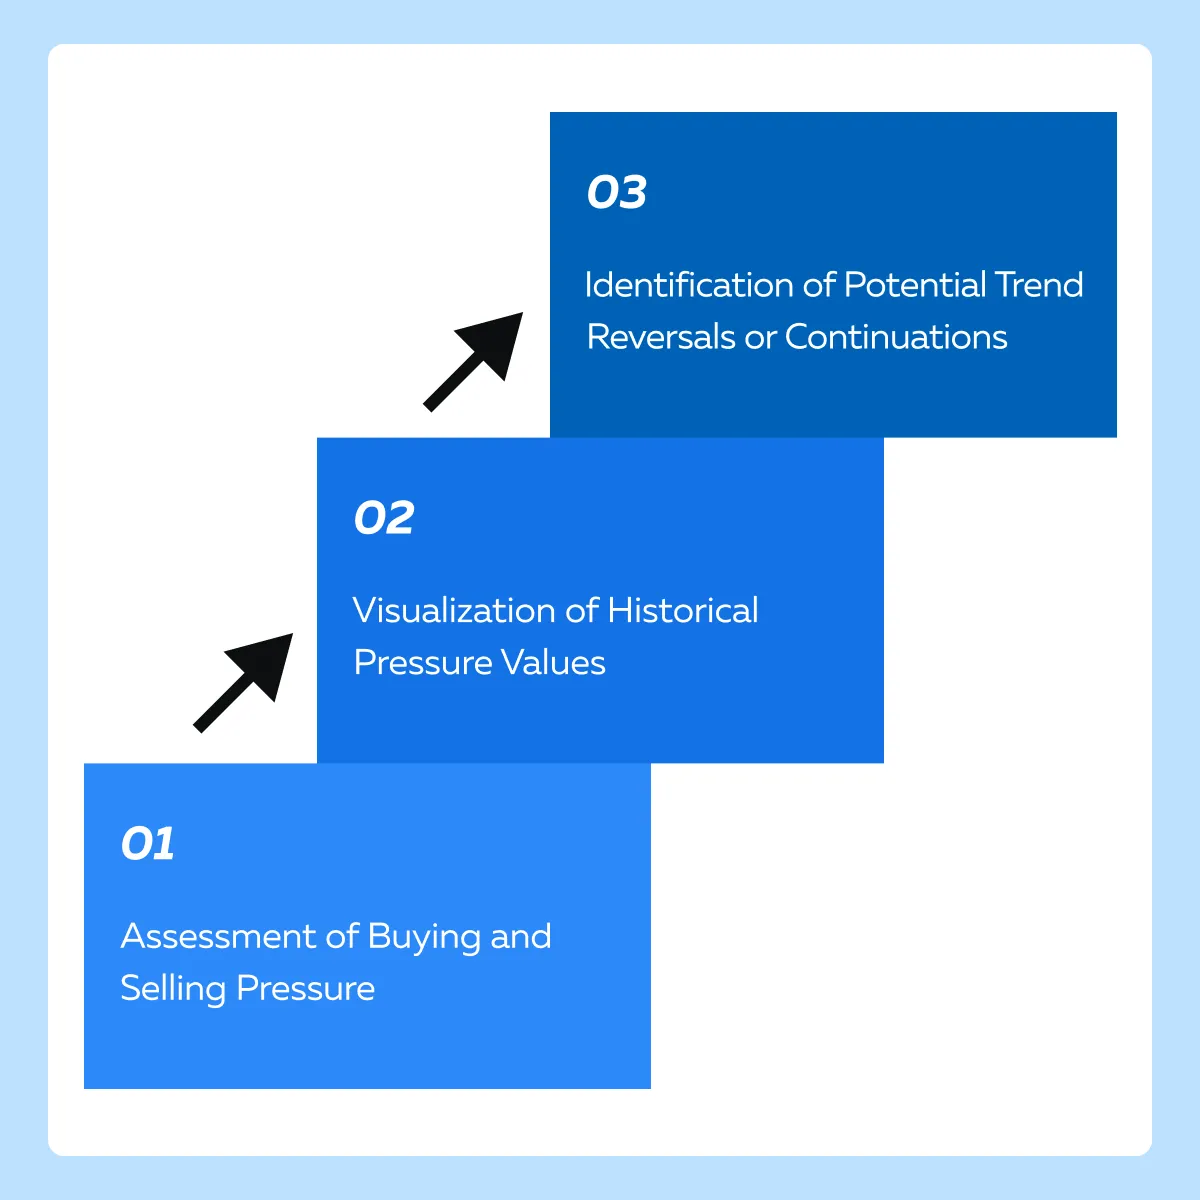
- Assessment of Buying and Selling Pressure
-
-
- The Volume Pressure algorithm analyzes trading volume events, such as:
- Volume spikes or
- Changes in volume trends.
- It does so to measure the relative strength of buying and selling pressure in the market.
- By examining volume, the algorithm provides critical information related to:
- The Volume Pressure algorithm analyzes trading volume events, such as:
-
- The balance between buyers and sellers and
-
-
-
- The prevailing sentiment in the market.
-
-
- Visualization of Historical Pressure Values
-
-
- The historical values of buyers’ and sellers’ pressure are visualized within a sub-chart.
- This visualization offers traders a clear, at-a-glance understanding of market sentiment over time.
- Using it, traders can:
- Quickly identify periods of intense buying or selling pressure and
- Assess how market sentiment has evolved over different timeframes.
-
- Identification of Potential Trend Reversals or Continuations
-
- Traders analyze volume pressure trends to identify potential:
- Trend reversals or
- Trend continuations.
- For example:
- Let’s assume there is a significant increase in buying pressure accompanied by rising prices.
- This event indicates bullish momentum and signals a potential trend continuation.
- Conversely, a divergence between price and volume, such as declining volume amid rising prices, suggests:
- Weakening buying pressure and
- Signal a potential trend reversal
- Traders analyze volume pressure trends to identify potential:
Volume Pressure Algorithm is a Versatile Tool
The Volume Pressure algorithm is compatible with any instrument, including:
- Stocks,
- Currencies,
- Commodities, and
- Indices.
Whether trading equities, forex, or futures, traders, traders can use it across different markets and make more informed trading decisions.
What is the Price Change Algorithm?
The Price Change algorithm within Market Pulse measures the deviation of the last trade price from the average price over a specified period for any instrument. This algorithm quantifies how close the current deviation is to the maximum deviation detected within the set interval. It provides a percentage value.
Here’s how it works:
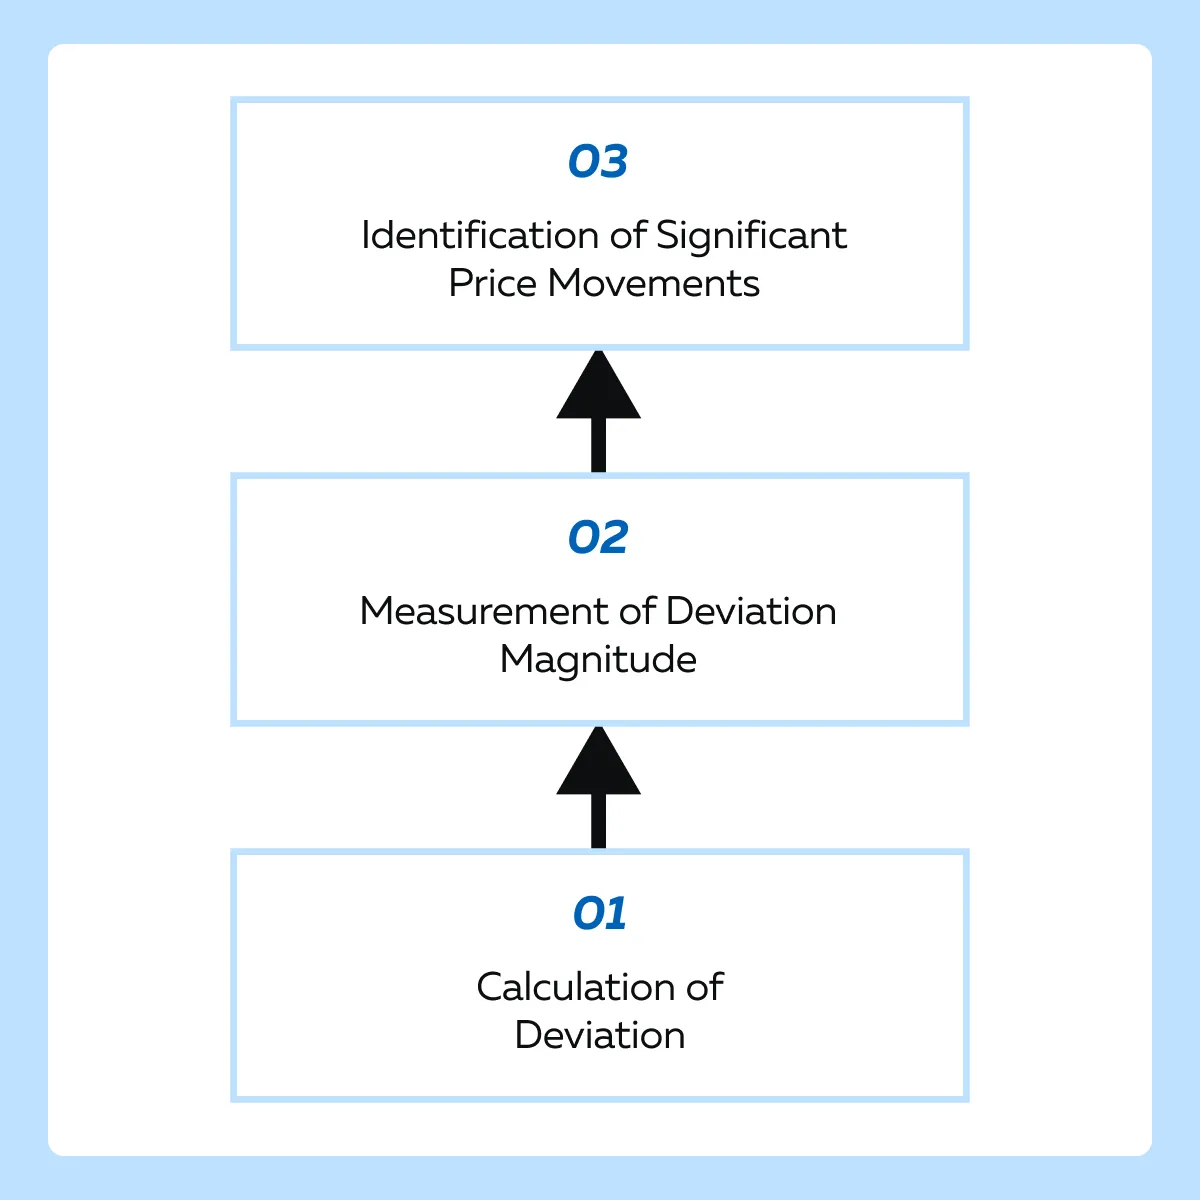
- Calculation of Deviation
-
-
- The Price Change algorithm calculates the deviation of the last trade price from the average price over a specified interval.
- By comparing the current price to its historical average, the algorithm provides information related to the magnitude and direction of price movements relative to the norm.
-
- Measurement of Deviation Magnitude
-
-
- The algorithm quantifies the magnitude of deviation.
- It determines how close the current deviation is to the maximum deviation detected within the set interval.
- This calculation results in a percentage value that represents the degree of deviation from the norm.
-
- Identification of Significant Price Movements
-
- The Price Change algorithm is invaluable for pinpointing price movements that deviate significantly from the norm.
- By flagging deviations that exceed a certain threshold, traders can identify key market events or shifts.
It’s worth noting that a sharp deviation from the historical average signals a significant market event, such as a:
- News announcement,
- The earnings report, or
- Technical breakout.
Traders modify their trading strategies using this information to adjust. Based on it, they usually decide their entry or exit positions.
Price Change Algorithm is a Versatile Tool
Similar to the Volume Pressure Algorithm, it is also compatible with any instrument, including stocks, currencies, commodities, and indices. This versatility allows traders to apply the algorithm across different markets and asset classes.
Liquidation Pressure algorithm
The Liquidation Pressure algorithm is designed specifically for the crypto market within Market Pulse. This innovative algorithm measures the impact of market liquidation events. Traders using it gain information about market stability and sentiment.
Here’s how it works:
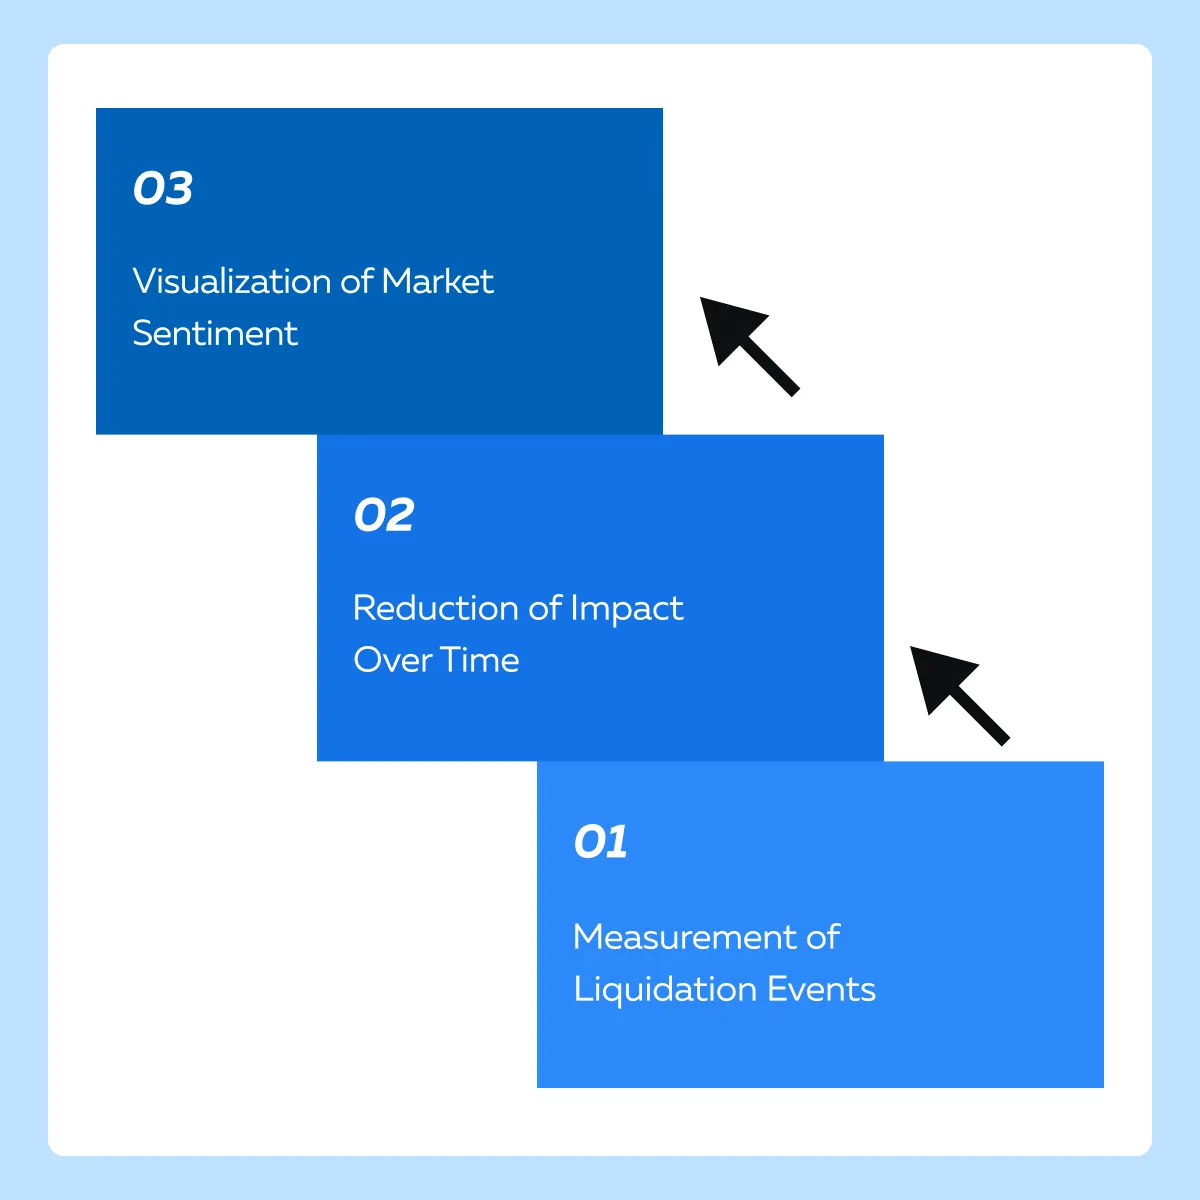
- Measurement of Liquidation Events
-
-
- The Liquidation Pressure algorithm accumulates the sizes of liquidations in the crypto market.
- It captures the impact of liquidation events on the market.
- Liquidation events occur when traders are forced to sell their positions to cover margin calls or losses.
-
- Reduction of Impact Over Time
- The Liquidation Pressure algorithm reduces the impact of liquidation events by half during the half-life period.
-
-
- This smoothing mechanism helps traders visualize the liquidation events more effectively which reduces noise and provides a clearer understanding of market sentiment.
-
- Visualization and Understanding of Market Sentiment
-
- By analyzing liquidation events, this algorithm helps traders visualize the market sentiment in the crypto market.
- High levels of liquidation pressure indicate heightened volatility and uncertainty.
- On the contrary, low levels suggest market stability and confidence.
How Does Liquidation Pressure Algorithm Help Traders?
- It provides traders with a quantitative measure of liquidation pressure
- It offers advanced visualizations using which traders can:
- Strategically enter or exit positions,
- Adjust risk management strategies, and
- Time trades.
How Market Pulse’s Algorithms Empower Traders?
The advanced algorithms of Market Pulse empower traders by providing deep insights into:
- Volume dynamics,
- Price deviations, and
- Liquidation events.
Using these powerful tools, traders can filter out irrelevant market noise and focus on the data that truly matters. Let’s see briefly how different algorithms help traders differently:
| Algorithm | Primary Use |
| Volume Pressure Algorithm | Assessing buying and selling pressure |
| Price Change Algorithm | Quantifying price movements |
| Liquidation Pressure Algorithm | Understanding the impact of liquidation events |
Case Studies: Successful Noise Filtering
Study the hypothetical scenarios below where traders filtered out market noise by successfully applying these techniques:
- Volume analysis,
- Price change analysis, and
- Liquidation event monitoring.
| Technique Applied | Scenario | Application | Outcome |
| Volume Analysis in Stock Trading |
|
|
The stock continues its upward momentum, validating Sarah’s analysis. |
| Price Change Analysis in Forex Trading |
|
|
The deviation is caused by an unexpected economic announcement. Using this information, John avoids entering a trade, based on noise-driven prices. |
| Monitoring Liquidation Events in Cryptocurrency Trading |
|
|
Alex temporarily reduced his exposure to cryptocurrencies. He waits for the situation to stabilize before re-entering the market. |
The Bookmap Benefit
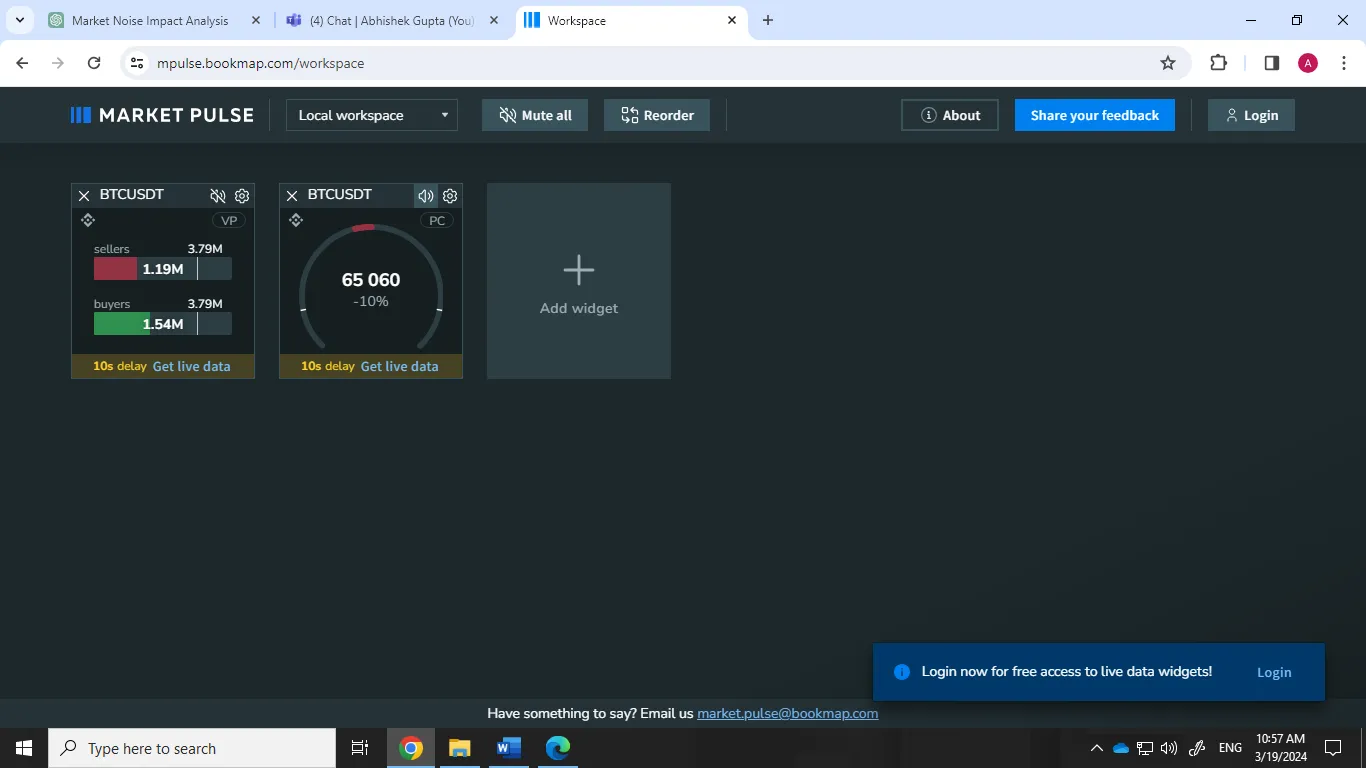
Traders can use the FREE version of Market Pulse Web offered by Bookmap by accessing the platform through their web browser. Once logged in, traders can explore a range of features and tools designed to enhance their trading power. Additionally, traders can customize their workspace to suit their preferences and trading style.
Conclusion
It’s vital to cut through market noise to improve trading results. Filtering out irrelevant information helps traders make better decisions and focus on what matters in the market. Techniques like volume analysis, price change analysis, and monitoring liquidation events are key.
Market Pulse makes this process easier using advanced algorithms. Traders use this tool to analyze volume dynamics, understand price movements, and track liquidation events in real time. Dive deeper into your market analysis and decisively cut through the noise with Bookmap’s Market Pulse.
Whether it’s order flow, the order book, options, liquidations, or more, Market Pulse aggregates and displays critical market events in one place. Enhance your trading strategy by staying ahead of market movements with Market Pulse. Explore how here: Market Pulse on Bookmap.
Sign Up Now