See price more clearly in real time.
Compare plans to access deeper market visibility for price.
Education
September 13, 2024
SHARE
Detecting Stop Runs: Using CVD and Iceberg Absorption for Strategic Trading
Curious about the real secret to trading success? It’s more than just price movements. Most top traders dig deeper and spot hidden orders that truly drive the market. Want to know how?
In this article, you’ll learn about two powerful tools for trading: Cumulative Volume Delta (CVD) and iceberg orders. CVD helps you understand the balance between buying and selling in the market, giving you a better sense of what’s really happening beyond just price movements. On the other hand, iceberg orders are large trades that are mostly hidden from view. They allow big players to buy or sell without causing huge price changes.
The article explains how to detect iceberg orders and understand their impact on market dynamics. You’ll also understand how these orders can absorb buying or selling pressure at key price levels and create opportunities for strategic trading. By recognizing these patterns, especially when they set the stage for a “stop run” (a rapid price movement caused by stop-loss orders being triggered), you can anticipate market reversals or continuations and make more informed trading decisions. Plus, we’ll guide you on using CVD and iceberg orders to enhance your trading strategy. With Bookmap, you’ll learn how to gain a competitive edge and boost your chances of success. Let’s begin.
A Brief Overview of Cumulative Volume Delta

Cumulative Volume Delta (CVD) is a technical indicator. It is used in trading to analyze the difference between buying and selling pressure in the market. Basically, it calculates the cumulative net difference between buying and selling volumes over a given period. This provides insights into:
- Market sentiment
and
- Expected price movements.
For more clarity, let’s see how CVD tracks buying and selling pressure.
Assume that there are two types of trades happening in the market:
- Aggressive buys (market orders hitting the ask price)
and
- Aggressive sells (market orders hitting the bid price).
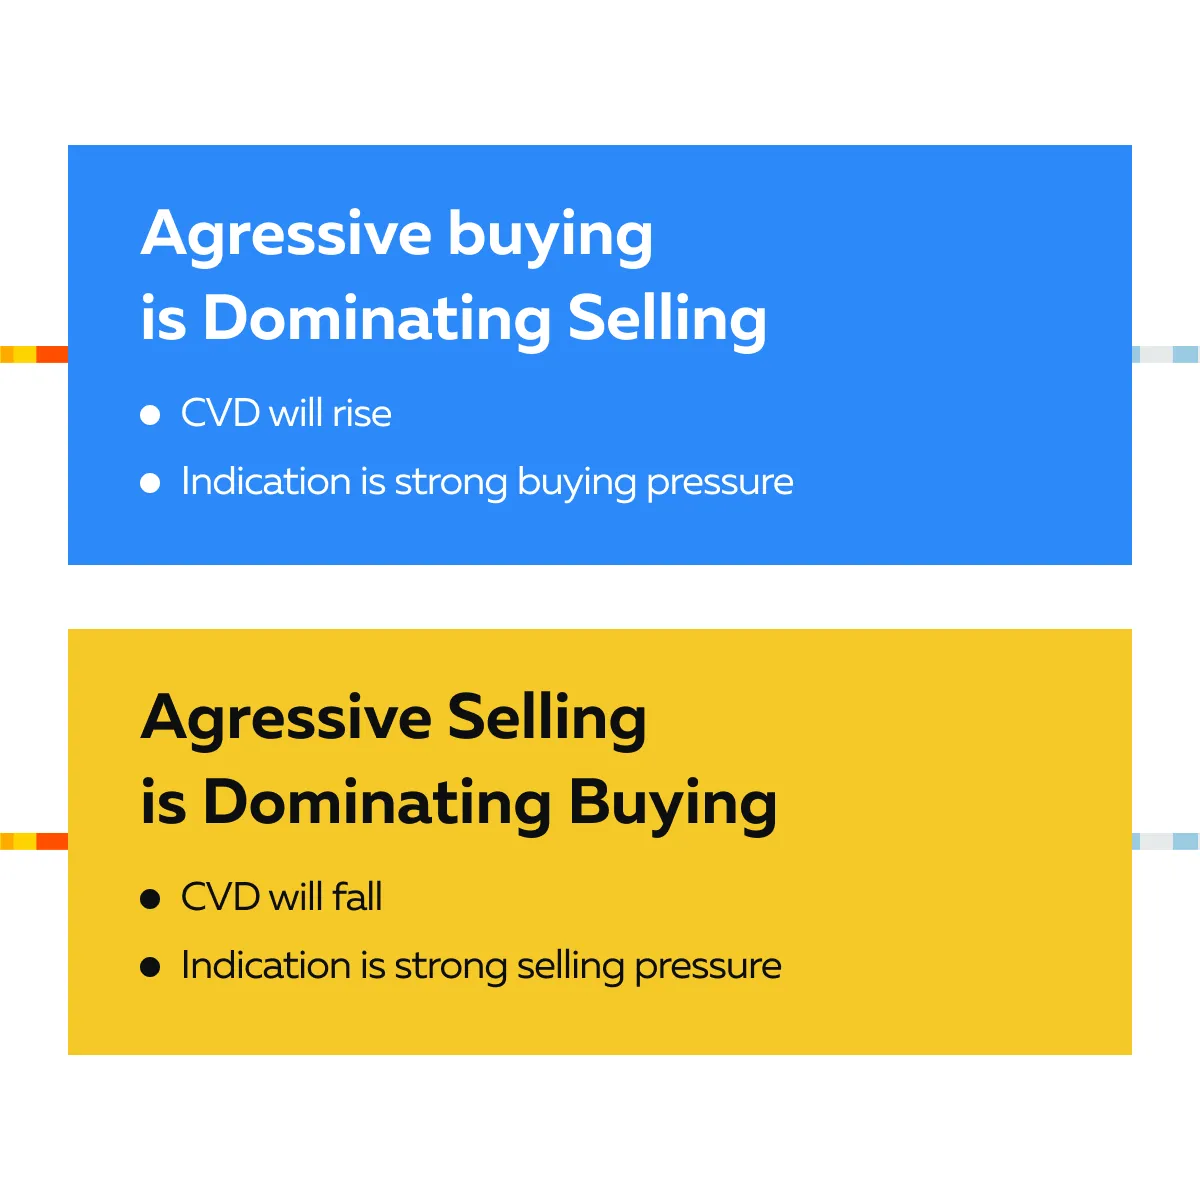
Please note that CVD tracks the net difference between these two actions. See the graphic below to understand how CVD reacts in different situations:
For example,
- Say, in a specific time frame, 100 contracts are aggressively bought and 80 contracts are aggressively sold.
- Now, the CVD would increase by 20.
- It will reflect the net buying pressure.
Why is CVD Valuable for Traders?
CVD offers a real-time glimpse into market dynamics, beyond just price movement. The price might stay flat or even drop slightly, but if CVD is rising, it indicates that there’s underlying buying pressure. Mostly, this pushes prices higher. At the same time, a declining CVD during a price increase signals hidden selling pressure. This usually leads to a price reversal.
Hence, we can state that CVD helps traders understand market sentiment by revealing the true balance between buyers and sellers. For more clarity, see the graphic below:

This way, traders use CVD to:
- Confirm trends
or
- Spot divergences between price and volume.
These indications often precede significant market moves. Hence, by using CVD, traders can better anticipate potential reversals or continuations in the market. For a better understanding, check out this Bookmap article to learn how CVD can enhance your trading strategy.
The Role of Iceberg Orders in Market Dynamics
An iceberg order is a type of large trade order that is split into two parts:
- A smaller part that is visible to other traders (the visible portion)
and
- A bigger part that is hidden from the public order book (the hidden portion).
Traders use iceberg orders to execute substantial trades without revealing the full size of their positions. This technique helps them to conceal the true size of trades and minimize the potential impact on the market price.
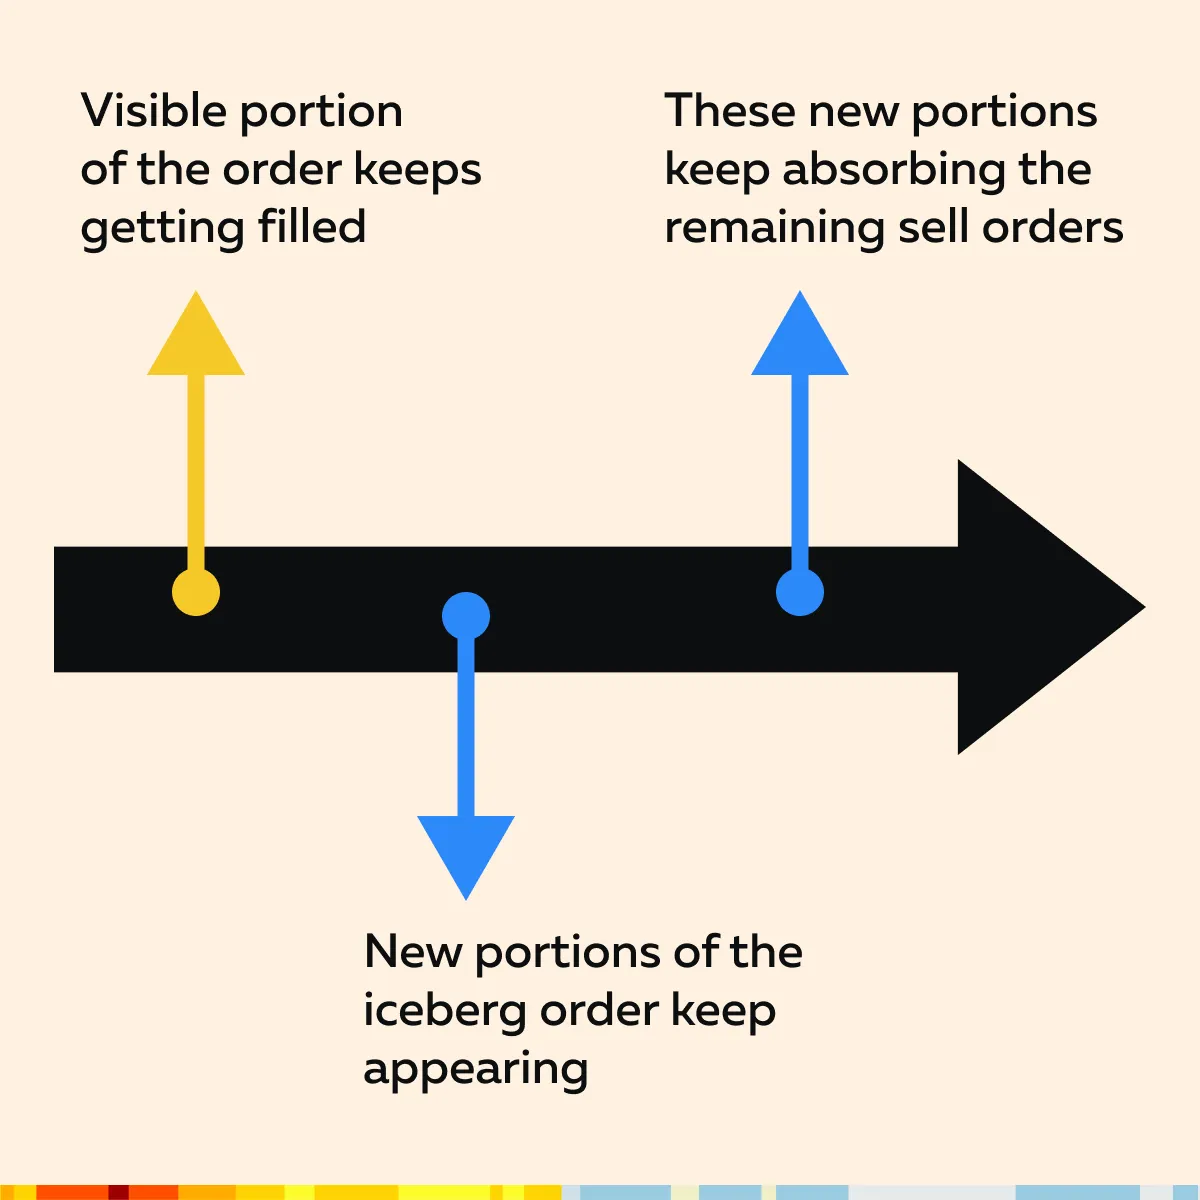
It must be noted that when a trader places an iceberg order, only a small portion of the order is displayed to other market participants. Once this visible portion is executed, another portion of the order becomes visible until the entire order is filled. This process prevents other market participants from:
- Reacting to the large order
and
- Causing unfavorable price movements.
For example, say a trader wants to sell 10,000 shares of a stock but doesn’t want to drive the price down. Now, they have decided to use an iceberg order to only display 1,000 shares at a time. As each 1,000 shares gets filled, another 1,000 shares will appear on the order book until the entire 10,000-share order is executed.
How do Iceberg Orders Impact Market Liquidity and Price Movements?
It is worth mentioning that iceberg orders play a significant role in maintaining market liquidity. They allow large trades to be executed without causing sudden and large price swings. Since the full size of the order is hidden, other traders may not realize the market is absorbing a large volume of trades. This lack of awareness prevents panic selling or buying.
However, iceberg orders also create an “illusion of liquidity.” If many iceberg orders are placed at a specific price level, it may appear that there is strong support or resistance at that level. Once the hidden portions of these orders are fully executed, the apparent liquidity may vanish. This often leads to rapid price movements. For more clarity, let’s study an example:
-
- Assume that a market participant wants to sell 50,000 contracts of a futures contract.
- If they place a regular sell order, the price will drop significantly.
- This happens because other traders will see the large sell order and react by “selling.”
- To avoid this situation, the trader uses an iceberg order.
- Now, they display only 5,000 contracts at a time.
- As each block of 5,000 contracts is sold, the next block is revealed.
- This allows the entire 50,000 contracts to be sold without causing a sharp decline in price.
- Following this strategy, the market absorbs the large volume of trades smoothly.
Identifying Absorption by Iceberg Orders

Iceberg orders are designed to be hidden. However, skilled traders can detect them by observing patterns in market data. One way to spot iceberg orders is by using trading tools and indicators, which analyze the:
- Order book,
- Trade execution patterns, and
- Volume anomalies.
For example:
- If you notice that a specific price level consistently absorbs a large number of trades without significant price movement.
- It could indicate the presence of an iceberg order.
- Some other signs are:
- Repeated large transactions at the same price level.
- Sudden spikes in executed volume without corresponding visible orders in the order book.
How Bookmap’s Features Help to Identify Iceberg Orders?
Bookmap is a powerful market analysis tool. It provides a real-time heatmap of the order book. Using it, traders find it easier to identify iceberg orders. Bookmap’s heatmap visualizes market depth and liquidity and reveals:
- At what price level are orders concentrated?
- How do they interact with price movements?
In Bookmap, when an iceberg order is present, you might see a large number of trades happening at a particular price level. This activity indicates that a significant amount of buying or selling is taking place. However, despite these trades, the visible portion of the order book doesn’t show a large order.
This discrepancy between the high trade volume and the relatively small visible orders is a key sign of an iceberg order. For example:
- Assume that the heatmap shows large volumes being executed repeatedly at a particular price.
- However, the visible order book does not reflect a large order.
- Now, this could be an indication of an iceberg order absorbing trades at that level.
Optimize your trading with insights on CVD and iceberg orders. Get started here!
How to Recognize Iceberg Orders That Absorb Sell Pressure as a Price Floor?
Firstly, let’s understand what it means. It refers to identifying situations where iceberg orders are placed to buy at a certain price level. When these orders absorb a large number of sell orders without allowing the price to drop further, they create a price floor (a strong support level in the market).
To recognize these levels, traders look for patterns where, despite heavy selling, the price consistently holds at a certain level. This indicates that the hidden parts of an iceberg order are absorbing the selling pressure. Such a situation:
- Signals strong buying interest,
and
- Suggests that the price is unlikely to go lower.
Most traders use this information to predict that the market may stabilize or even reverse direction from that price floor.
Combining Iceberg Orders to Predict Stop Runs
Mostly, absorption by iceberg orders occurs when a large hidden order absorbs significant selling or buying pressure at a specific price level. This process stabilizes the price temporarily. The visible portion of the iceberg order continues to absorb trades without moving the price significantly.
On the other hand, a stop run happens when a sudden price movement triggers a series of stop-loss orders. It causes rapid and often exaggerated price changes.
It is worth mentioning that when absorption by iceberg orders occurs at key support or resistance levels, it can set the stage for a stop run. Let’s see how:
- Say an iceberg order successfully absorbs a large amount of selling pressure.
- This way, it creates a false sense of security for traders holding short positions.
- After an iceberg order is fully executed (filled) or if the market starts moving in the opposite direction (reverses), traders who are holding losing positions (typically those who are short) now need to quickly exit their trades to avoid further losses.
- To exit, they often place buy orders to “cover” their short positions.
- If many traders do this at the same time, it triggers a chain reaction.
- In such a situation, a large number of buy orders push the price up rapidly, which leads to a stop run.
For more clarity, let’s study an example:
- Market Scenario:
-
-
- Assume that the market is trending downward.
- The price of a stock has fallen from $110 to $102.
- There is a key support level of $100.
- At this price level, many traders expect the price might stabilize or bounce back.
- Iceberg Order Placement:
- As the price nears $100, an iceberg buy order is placed at $100, but only a small part of it is visible.
- Now, assume that the visible part of the iceberg order shows only 500 shares available at $100, while the total iceberg order is actually 10,000 shares.
-
- Absorption of Sell Pressure:
-
-
- As the price reaches $100, heavy selling continues.
- Traders who are bearish sell 3,000 shares, but the price doesn’t drop below $100 because the iceberg order absorbs these sell orders.
- Another 2,000 shares are sold by different traders, but the iceberg order continues to absorb these too.
- The price remains stable at $100.
-
- Short Traders’ Assumptions:
-
- Traders who are short (expecting the price to go down) notice that despite 5,000 shares being sold, the price is not breaking below $100.
- In such a situation, they assume that:
- The selling pressure is weakening
and
- The downward trend is losing momentum.
- Iceberg Order Gets Filled:
-
-
- Eventually, after absorbing 9,500 shares, the iceberg order has just 500 shares left, which also get filled.
- Now, the entire 10,000-share iceberg order is completed.
-
- Market Reversal:
-
-
- After the iceberg order is filled, there are no more large hidden buy orders at $100.
- However, the price starts to rise slightly due to the previous buying interest.
- As the price moves up from $100 to $101, short traders begin to panic
- They panic because they see that the price is rising instead of continuing to fall.
-
- Stop Run Triggered:
-
-
- At this moment, short traders start covering their positions by buying back the stock.
- Assume that 1,500 shares are bought back quickly.
- This aggressive buying pushes the price to $103.
- Also, this situation triggers stop-loss orders set by other short traders just above $101.
- As these stops are hit, they generate automatic buy orders.
- This pushes the price even higher to $105.
-
- Resulting Stop Run:
-
- The price moves from $100 to $105 rapidly.
- This combination of short covering and triggered stop-loss orders causes a sharp upward spike.
- It is a classic stop run.
How to Detect Absorption?

It is vital to recognize that traders can identify absorption by monitoring market data and using specialized trading tools like:
- Heatmaps
and
For the unaware, absorption is often detected by observing repeated execution of trades at a certain price level without a corresponding movement in price. By using advanced market analysis tools like Bookmap, traders can visualize these patterns. They can specifically see how large volumes are being executed at a price level where an iceberg order may be present.
Enhance your trading strategies with Bookmap’s advanced tools. Sign up today!
Now, by paying close attention to the order flow and volume at specific price levels, traders can spot when absorption is occurring. If a price level continues to hold despite substantial trading volume, it may indicate that an iceberg order is:
- Absorbing the pressure
and
- Setting the stage for a likely reversal or stop run.
For a greater understanding, let’s study an example that shows increased absorption and how it indicates a potential stop run:
- A trader is watching the market at a significant resistance level.
- They notice that every time the price nears this level, large sell orders are executed.
- Despite this, the price doesn’t drop significantly.
- This repeated absorption at the resistance level suggests the presence of an iceberg order.
- If the price eventually breaks through this resistance level after the iceberg order is filled, it could trigger a stop run.
- Traders with short positions may have placed their stop-loss orders just above this resistance level.
- Once the price breaks through, these stops are triggered.
- This event causes a sharp upward price movement as shorts cover their positions and new buyers enter the market.
How Absorption Signals Strong Buying Interest?
 ow Absorption Signals Strong Buying Interest?
One must be aware that the absorption of sell orders by iceberg orders can be a strong indicator of underlying buying interest. When large sell orders are consistently absorbed without pushing the price lower, it signals a significant demand at that price level. This strong buying interest often precedes a market reversal or a stop run. Let’s study an example:
- Suppose a stock is trading at a support level of $50.
- There is the presence of an iceberg order absorbing all sell orders at this level.
- The price doesn’t drop below $50, despite heavy selling.
- Eventually, the selling pressure diminishes, and the price starts to rise.
- Traders who were “short the stock” (implies short-selling) and had their stop-loss orders just above $50, now find themselves in a position where they need to “cover”.
- As the price rises above $50, these stop orders get triggered.
- This situation causes a rapid upward move in the stock price or we can say a “stop run”.
In this scenario, we can observe that recognizing the absorption of sell orders at $50 provided an early signal of strong buying interest. It allowed traders to anticipate the stop run and position themselves accordingly. Identify stop runs with precision using Bookmap – Join now!
Practical Examples of Stop Runs
Suppose a stock is in a strong uptrend but experiences a temporary pullback. The price begins to approach a significant support level at $100, where many traders have placed their stop-loss orders just below this level. As the price nears $100, a large iceberg buy order is placed at this level, but only a small portion of it is visible in the order book.
Now, as the pullback intensifies, the price starts testing the $100 support level. The iceberg order absorbs the sell pressure. It prevents the price from falling below $100, even though substantial selling volume is present. See the graphic below to visualize the market situation at this point:
Other traders witness the price holding at $100 despite heavy selling. Now, they start to lose confidence in the downward move. This absorption suggests that:
- Strong buying interest exists at this level
and
- The market might reverse direction soon.
Finally, as the selling pressure diminishes, the price begins to rise from the $100 level. Traders who were short the stock would have placed their stop-loss orders just above $100. As the price moves back up, these stop orders are triggered. It leads to a rapid and sharp price increase, a stop run.
How to Plan Trades Using Stop Run Information?
Once a trader identifies an iceberg order absorbing selling pressure at a key support level, they can:
- Anticipate a potential stop run
and
- Position themselves to take advantage of the ensuing price movement.
Let’s continue with the previous example and understand how this happens in detail:
After the price reverses from $100 and the stop run occurs, the trader notices that the market momentum is now “strongly bullish.” Recognizing that the stop run has triggered a wave of buying activity, the trader decides to enter a long position immediately after the price breaks above $101. Now, they are anticipating that the upward momentum will continue.
By entering the trade after the stop run, the trader capitalizes on the surge of buying interest. The sharp price increase was driven by:
- The Covering of short positions
and
- The influx of new buyers.
In this way, traders earned significant gains in a short period.
Conclusion
Cumulative Volume Delta (CVD) and iceberg orders greatly enhance a trader’s ability to detect and capitalize on stop runs. CVD helps traders gauge the underlying buying and selling pressure in the market. It offers insights that go beyond price movements. On the other hand, iceberg orders allow large traders to conceal their intentions and absorb significant market pressure at key levels.
By recognizing the absorption of sell or buy orders through iceberg orders, traders can identify areas of strong support or resistance. These areas often set the stage for “stop runs,” where a sudden surge in price occurs as stop-loss orders are triggered. By detecting these patterns, traders usually anticipate and act on the likely market reversals or continuations.
Hence, we can state that by applying these techniques, traders can significantly reduce risks and increase the likelihood of success. With tools like Bookmap, identifying CVD patterns and iceberg orders becomes more accessible. Do you wish to stay ahead of market moves and optimize your trading performance? Join Bookmap now!
Sign Up Now