See cumulative volume more clearly in real time.
Compare plans to access deeper market visibility for cumulative volume.
Trading Basics
July 18, 2024
SHARE
How to Leverage Market Profiles and Cumulative Volume for Advanced Trading Insights

The financial markets are said to be a level playing field, yet why do you as a trader struggle while others reap profits? The short answer is “You don’t have trading insights”. Without valuable information, and making informed decisions about buying or selling assets, you are making a shot in the dark.
But this is not going to be the same anymore. Through this article, we will learn how to combine “market profiles” and “cumulative volume” to gain advanced trading insights. We’ll start from scratch and explain what market profiles are, their origins, and how they offer a statistical overview of market conditions over time. Then, we’ll understand cumulative volume and its role in measuring the total volume traded at specific price levels during a session.
Also, you’ll learn how to synergize market profiles and cumulative volume together, visualizing them using charts and graphs like “composite volume profile charts” and “volume at price histograms”. Lastly, we’ll introduce advanced visualization techniques and walk you through multiple real-world trading scenarios. Let’s get started.
The Fundamentals of Market Profiles and Cumulative Volume
Market profiles are graphical representations that display price distribution over a specific time period (mostly a trading session). This tool was developed by J. Peter Steidlmayer in the 1980s to give traders a statistical overview of market activity.
Steidlmayer was a trader at the Chicago Board of Trade (CBOT). He aimed to understand market behavior by segmenting trading days into smaller time intervals, known as Time Price Opportunities (TPOs). Each TPO represents a specific price at which trading occurred during a set time period, usually 30 minutes.
How do market profiles offer a statistical overview of market conditions?

A market profile chart organizes price and volume data to create a distribution curve, which resembles a horizontal histogram. Here are some of its main components:
- Point of Control (POC): The price level with the highest traded volume.
- Value Area (VA):
- It is the range of prices where a significant portion of trading occurs.
- The VA is usually 70% of the total volume.
- Range: The highest and lowest traded prices during the session
These elements help traders to:
- Identify key support and resistance levels,
- Understand market sentiment, and
- Predict potential price movements.
By analyzing the shape and distribution of the profile, traders can understand the balance between supply and demand. This understanding helps in anticipating market trends. For a more detailed exploration of market profiles, please refer to this article.
What is cumulative volume?
Cumulative volume refers to the total amount of volume traded at a specific price level. It must be noted that cumulative volume is always of a particular session. It accumulates the volume from the start of the session, providing a running total as trading progresses.
Furthermore, traders must note that:
- As trading progresses, the cumulative volume at each price level will continue to increase with each new trade.
- This running total helps traders see where significant trading activity is concentrated.
- Using this information, traders can determine key support and resistance levels.
Let’s understand this concept using a hypothetical scenario:
- Say you are observing a trading session for a stock.
- You want to track the cumulative volume at each price level.
- Assume this is the scenario for the first few trades of the session:
- Trade 1:
- Price: $100
- Volume: 200 shares
- Cumulative Volume at $100: 200 shares
- Trade 2:
- Price: $101
- Volume: 150 shares
- Cumulative Volume at $101: 150 shares
- Trade 3:
- Price: $100
- Volume: 100 shares
- Cumulative Volume at $100: 200 (previous volume) + 100 (current trade) = 300 shares
- Trade 4:
- Price: $102
- Volume: 250 shares
- Cumulative Volume at $102: 250 shares
- Trade 5:
- Price: $100
- Volume: 50 shares
- Cumulative Volume at $100: 300 (previous volume) + 50 (current trade) = 350 shares
- Trade 6:
- Price: $101
- Volume: 100 shares
- Cumulative Volume at $101: 150 (previous volume) + 100 (current trade) = 250 shares
- Trade 1:
- We can clearly observe that the cumulative volume for each price level at the end of these trades would be:
- $100: 350 shares
- $101: 250 shares
- $102: 250 shares
- From the cumulative volume data, you inferred the following:
- At $100
- This price level has the highest cumulative volume (350 shares).
- It shows strong trading activity.
- You considered this price level as a significant support or resistance level.
- At $101 and $102
- These levels have lower cumulative volumes compared to $100.
- You gauged the signal that at this price level, there is less trading activity.
- At $100
How Cumulative Volume Helps in Assessing Market Strength:
Let’s see how cumulative volume helps traders:
- Identifying Key Levels
-
-
- By observing where the highest volumes are traded, traders can pinpoint significant support and resistance levels.
-
- Assessing Market Sentiment
-
-
- Higher cumulative volumes at certain price levels indicate either a bullish or bearish trend.
- Conversely, low cumulative volumes suggest indecision or a lack of interest in those price levels.
-
- Confirming Trends
-
- A rising cumulative volume trend alongside price movements confirms the strength of the trend.
- If prices are rising but cumulative volume is declining, it signals:
- Weakening momentum
and
- Potential reversals.
For a comprehensive guide on leveraging cumulative volume in trading strategies, check out this article.
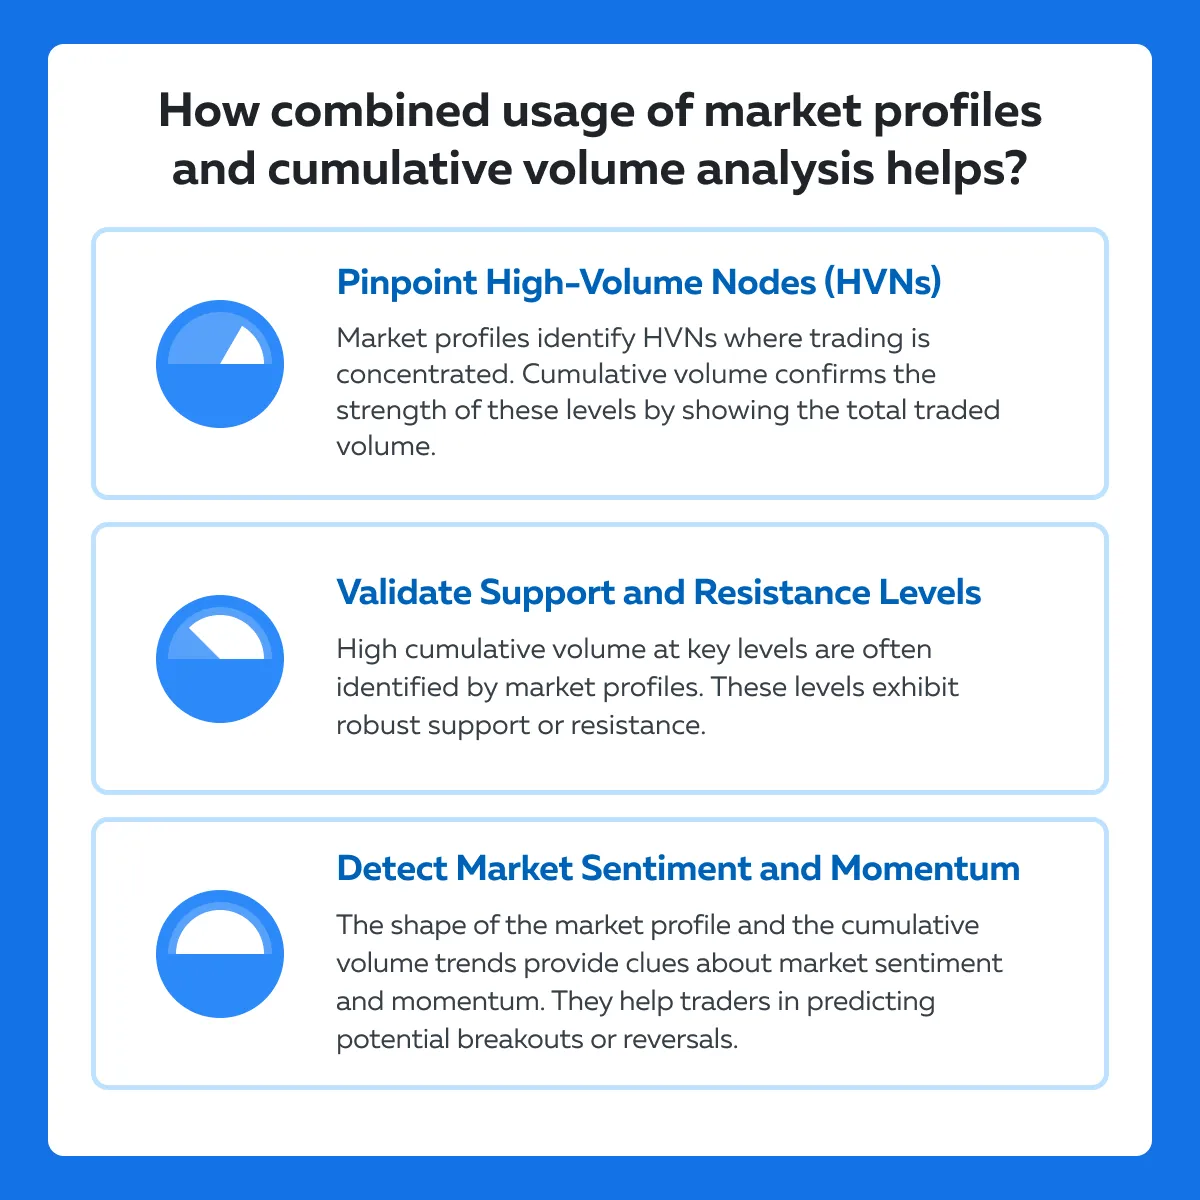
The Synergy Between Market Profiles and Cumulative Volume
Several traders leverage both market profiles and cumulative volume analysis to optimize their trading decisions. While each tool is potent in its own right, their combined application is particularly effective. This combined usage enables traders to precisely identify high-volume areas that signify strong support or resistance levels.
Read the graphic below to understand better:
An example showing a real-world scenario combining market profiles and cumulative volume:
Consider the following data:
| Market Profile Analysis | Cumulative Volume Analysis: |
|
|
|
|
Making combined analysis
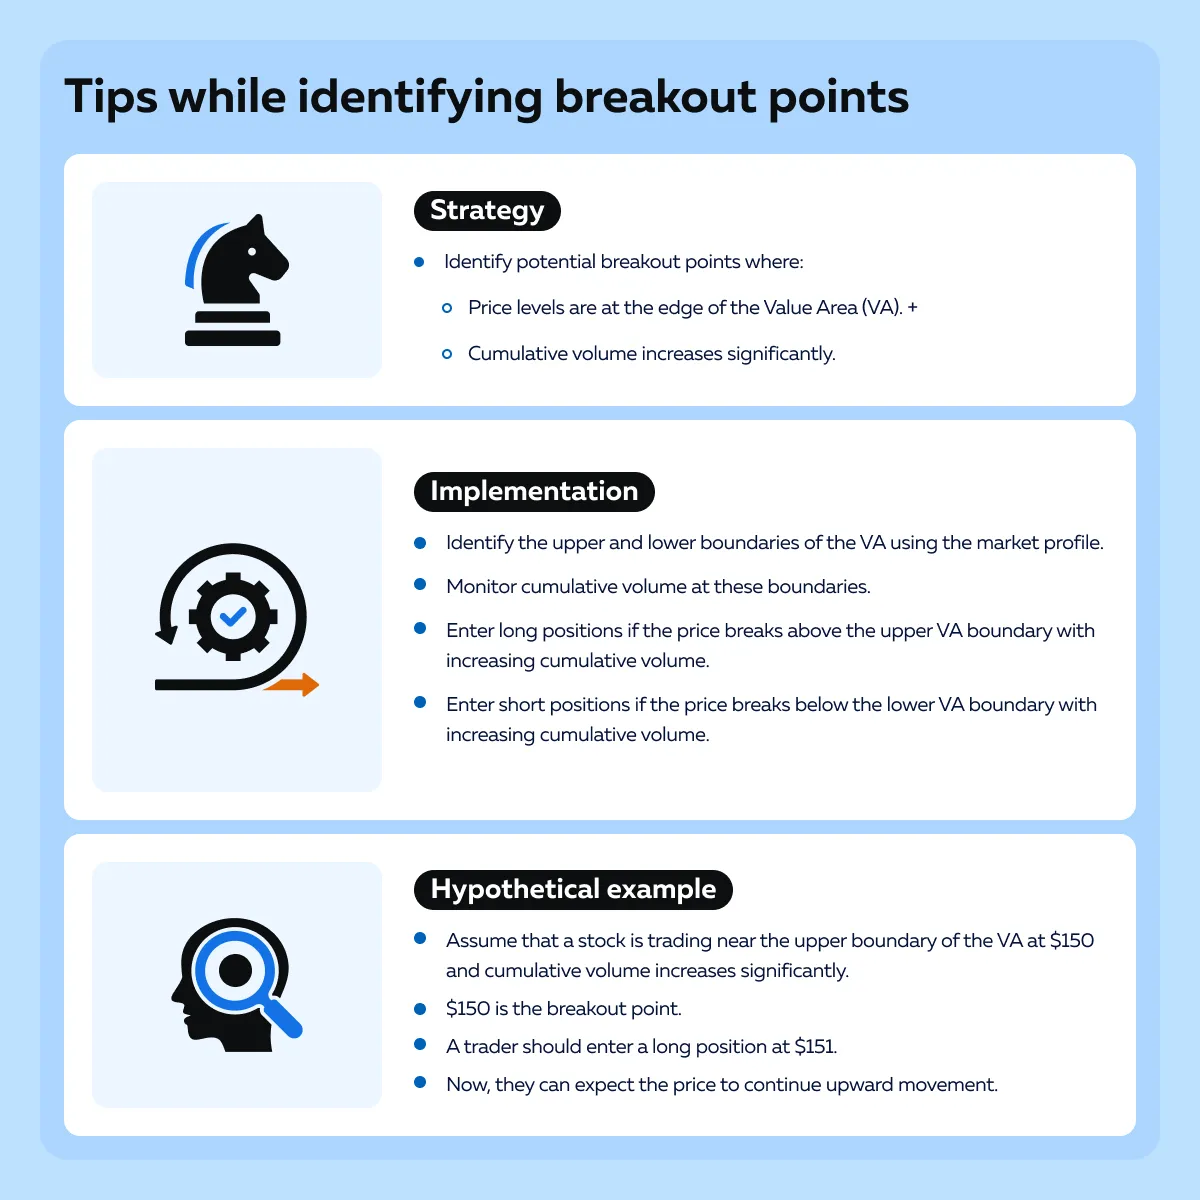
- Identifying Breakout Points
-
-
- The stock has been trading within the VA ($145 to $155) for several sessions.
- The cumulative volume analysis shows increasing volume as the price nears the upper boundary of the VA ($155).
- This indicates strong buying interest, and there is going to be a breakout above $155.
-
- Trading Decision
-
- Anticipating a breakout, the trader decides to go long on the stock at $156.
- They set a stop loss set just below $155 to manage risk.
The outcome
- The stock breaks out above $155.
- The price rises to $165 over the next few sessions.
- The combined analysis of market profiles and cumulative volume provides a clear signal for the breakout.
- Acting on this signal, the trader capitalized on the upward movement.
Visual Tools for Combining Market Profiles and Cumulative Volume
To combine market profiles and cumulative volume, traders use specific types of charts and graphs that integrate these two data sets. The most commonly used visual tools are:
- Composite volume profile charts
and
- Volume at price histograms.
Let’s understand about both in detail:
| Composite Volume Profile Charts | Volume at Price Histograms |
or
|
|
How to combine Market Profiles and Cumulative Volume?
- The charts mentioned above combine:
- Time Price Opportunity (TPO) profiles
with
- Volume profiles.
- This combination displays the total volume traded at each price level.
- Using it, traders see how price and volume interact.
- An understanding of this interaction helps in identifying significant support and resistance levels.
How to Read Combined Visual Data?
Let’s see how you can understand the charts:
| High-Volume Nodes (HVNs) | Low-Volume Nodes (LVNs) | |
| Market profile chart |
|
On a market profile, LVNs appear as valleys or thin areas with little trading activity. |
| Cumulative volume histograms | In cumulative volume histograms, HVNs are indicated by peaks in the volume bars at specific price levels. | In cumulative volume histograms, LVNs are shown by lower volume bars. |
How to make interpretations?
- Identifying Strong Support and Resistance Areas
-
- Traders interpret a significant support or resistance level, when:
- a high-volume node on the market profile chart coincides with a peak in the cumulative volume histogram.
- This is because substantial trading activity at these price levels indicates:
- Strong market interest
- Traders interpret a significant support or resistance level, when:
and
- Price stability.
- Detecting Breakout or Reversal Signals
-
- Traders interpret a price breakout, when:
- The cumulative volume increases significantly as the price approaches a high-volume node
- Conversely, if the volume decreases, it indicates a:
- Lack of interest
- Traders interpret a price breakout, when:
and
- Possible price reversal
Let’s understand better using a hypothetical example:
The scenario
- Say a stock is trading in a range between $50 and $60.
- You are using a TPO and Volume Profile chart to analyze the market.
Step-by-step reading
- Market Profile Analysis
-
- The chart shows a prominent HVN at $55.
- This signals a lot of trading activity at this price level.
- At $55, there is a bulge in the market profile.
- The VA is between $53 and $57.
- This is the most traded price range.
- Cumulative Volume Analysis
-
- The volume histogram shows significant peaks at $55.
- This display confirms the high trading interest at this level.
Combined interpretation
| Support Level | Resistance Level |
|
|
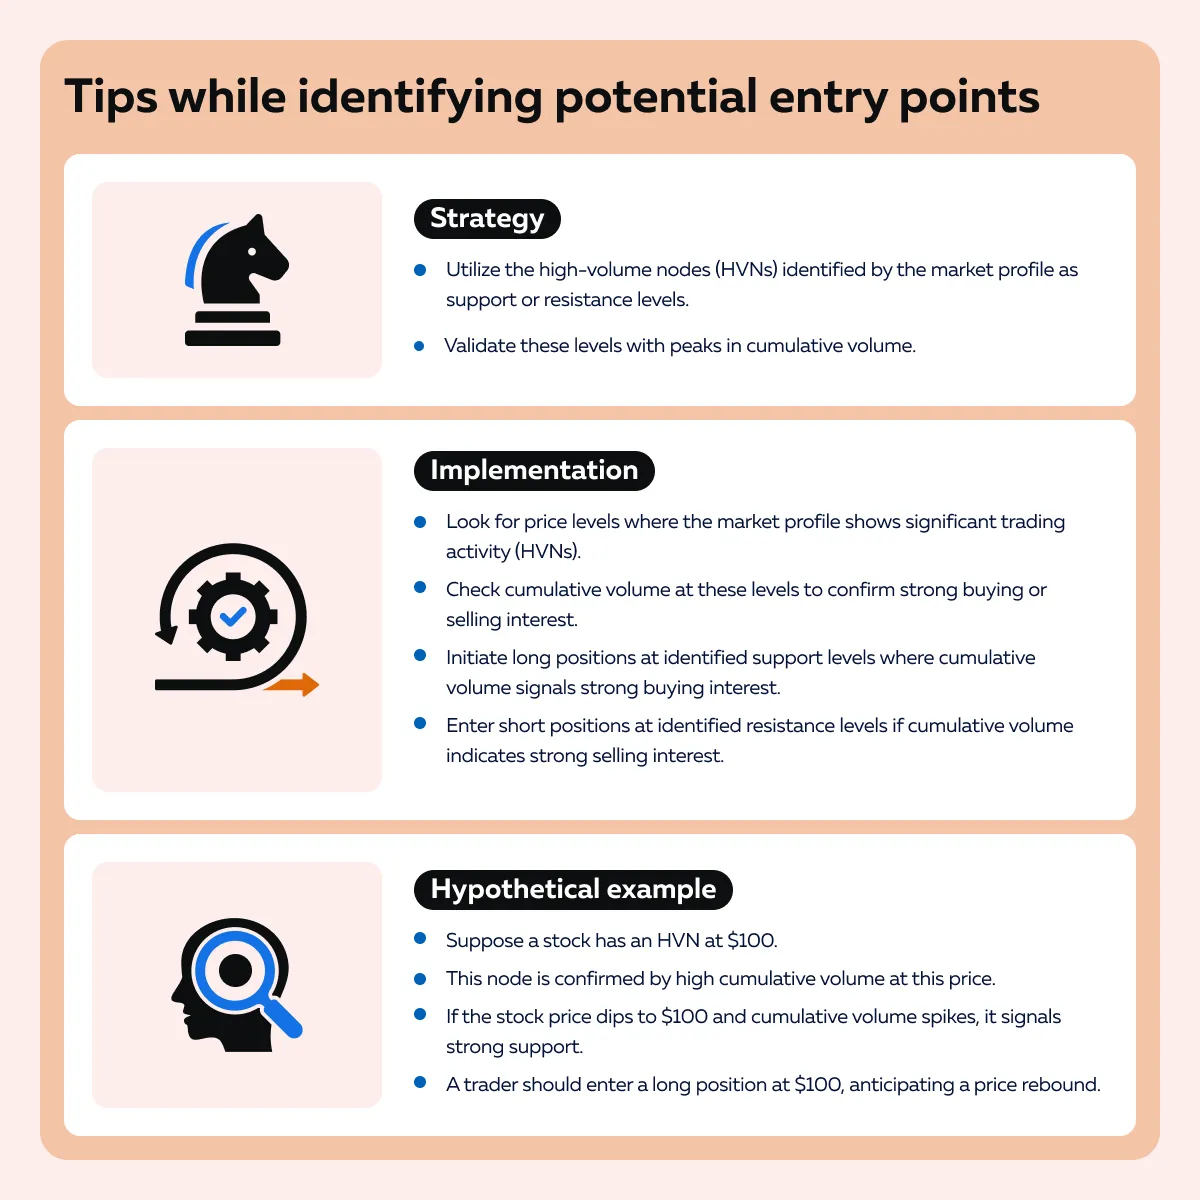
Practical Trading Strategies Using Combined Analysis
As discussed above, combining market profiles and cumulative volume significantly enhances trading strategies. This combination provides a detailed view of market dynamics. Let’s have a look at some practical strategies that can help you optimize their usage:
How can traders dynamically adjust their strategies based on real-time data?
Traders must use real-time cumulative volume data to adjust strategies dynamically when new high-volume areas emerge that are not aligned with historical market profile data.
Here’s how you can do it:
- Continuously monitor cumulative volume throughout the trading session.
- Identify new price levels with significant volume spikes that do not correspond to HVNs or the VA in the market profile.
- Adjust trading positions based on these new levels.
Hypothetical example
- Say historical market profiles show limited activity at $120.
- However, during a trading session, cumulative volume spikes at this level.
- This unexpected increase suggests a new interest level.
- A trader can enter a long position if the price approaches $120.
Additionally, traders must pay attention to divergences between:
- Price movement
and
- Cumulative volume.
By doing so, traders can identify potential reversals or continuations. Let’s see how you can implement it:
- Compare price trends with cumulative volume trends.
- If the price is rising but cumulative volume is falling, it indicates:
- Weakening momentum
and
- Likely reversal.
- Conversely, if the price is falling but cumulative volume is rising, it indicates:
- Strong buying interest
and
- Likely bounce.
Hypothetical example
- A stock price is declining toward a historical support level of $90.
- A strong buying interest is signaled when cumulative volume starts to increase significantly as the price approaches $90.
- A trader can enter a long position, anticipating a reversal.
Advanced Visualization Techniques
To further enhance market analysis, traders usually integrate additional indicators such as:
- Order flow,
- Liquidity maps, and
- Algorithmic trend analysis tools.
These advanced visualization techniques provide a more comprehensive understanding of the market. Let’s study in detail:
| Indicators | Explanation | Practical usage |
| Order Flow Analysis |
|
and
|
| Liquidity Maps |
|
|
| Algorithmic Trend Analysis Tools |
and
|
|
To gain more clarity on the concept, let’s explore some detailed trading scenarios showing how combined visual analysis is used to make successful trading decisions:
Scenario 1: Volume Spike at Key Market Profile Level
Market Conditions
- A stock has been trading within a range.
- The market profile shows an HVN at $100.
- This indicates significant past trading activity at this level.
- The cumulative volume is also high at $100, confirming strong interest.
Order Flow Confirmation
- Order flow analysis shows a sudden influx of buy orders as the price approaches $100.
- This situation indicates strong bullish sentiment.
Liquidity Map Insight
- Liquidity maps reveal large buy orders clustered around $100.
- This situation suggests that big players are entering the market at this level.
Trading Decision
- The trader places a buy order at $100.
- They anticipate a price bounce due to the confluence of:
- High cumulative volume,
- Market profile HVN, and
- Strong buy orders from order flow analysis.
Outcome
- The price quickly rebounds from $100 to $110.
- This allows the trader to profit from the anticipated move.
Scenario 2: Breakout Above Value Area Boundary
Market Conditions
- The market profile shows a Value Area (VA) between $150 and $160.
- The Point of Control (POC) is at $155.
- The price has been consolidating near the upper boundary of the VA.
Cumulative Volume Analysis
- Cumulative volume starts to increase significantly as the price approaches $160.
- This situation indicates strong buying interest.
Algorithmic Trend Analysis
- An algorithmic tool indicates an uptrend.
- It suggests that the price is likely to break above $160.
Order Flow Confirmation
- Order flow analysis shows a surge in buy orders as the price reaches $160.
Trading Decision
- The trader places a buy order at $161, just above the VA boundary.
- They are expecting a breakout.
Outcome
- The price breaks above $160.
- It rapidly moves to $170.
- The trader decides to capitalize on the breakout.
Scenario 3: Identifying a Reversal Point
Market Conditions
- The market profile shows an HVN at $200.
- The cumulative volume confirms strong trading activity at this level.
- Recently, the price has been declining towards this HVN.
Order Flow Analysis
- As the price approaches $200, order flow analysis shows a significant increase in sell orders.
- This increase indicates likely bearish sentiment.
Liquidity Map Insight
- Liquidity maps reveal large sell orders placed slightly below $200.
- Resistance is indicated.
Trading Decision
- Despite the strong cumulative volume at $200, the trader decides to place a short order at $198.
- They are anticipating a brief bounce followed by a continued decline due to the sell orders in the order flow.
Outcome
- The price briefly bounces at $200.
- But then it drops to $190 as the sell orders are executed.
- This rise and fall allows traders to profit from the anticipated reversal.
Conclusion
Using market profiles and cumulative volume together is crucial. Market profiles help identify key price levels where significant trading activity has occurred, while cumulative volume confirms the strength of interest at these levels.
This combination enables traders to pinpoint strong support and resistance areas, anticipate breakouts, and detect potential reversals with greater accuracy. By incorporating additional tools like order flow, liquidity maps, and trend analysis, traders can gain even deeper insights into the market situation.
These tools provide real-time data on buy and sell orders, highlight areas with large pending orders, and help validate market trends, all of which enhance the decision-making process.
For more insights on how to use volume profile and order flow tools to deepen your market understanding, read our article on Volume Profile vs Order Flow.
Sign Up Now