See liquidity trap more clearly in real time.
Compare plans to access deeper market visibility for liquidity trap.
Futures
July 8, 2025
SHARE
How to Tell if a Move Is Real or a Liquidity Trap in Futures

In futures trading, not all breakouts are born equal. Some are just well-dressed traps waiting to destroy your P&L. Yes, futures liquidity traps are deceptive! They cause the price to break out with force. The end? Price onlytuation looks like a breakout, but it’s not the real deal. Gain more clarity through the graphic below:collapses moments later and traps unsuspecting traders.
Please note that these setups aren’t random. They’re engineered. By whom? By large players who need volume to execute their own agendas. Through faking a move, they attract retail traders, absorb their flow, and then reverse the price.
Is there a way to avoid futures liquidity traps? In this article, you will learn how these false breakouts in futures trading are created, how you can spot them using order flow confirmation, and why using real-time analysis tools, like Bookmap, is highly important. Additionally, you’ll learn not just to avoid traps, but to anticipate and even capitalize on them. Let’s begin.
What Is a Liquidity Trap in Futures?
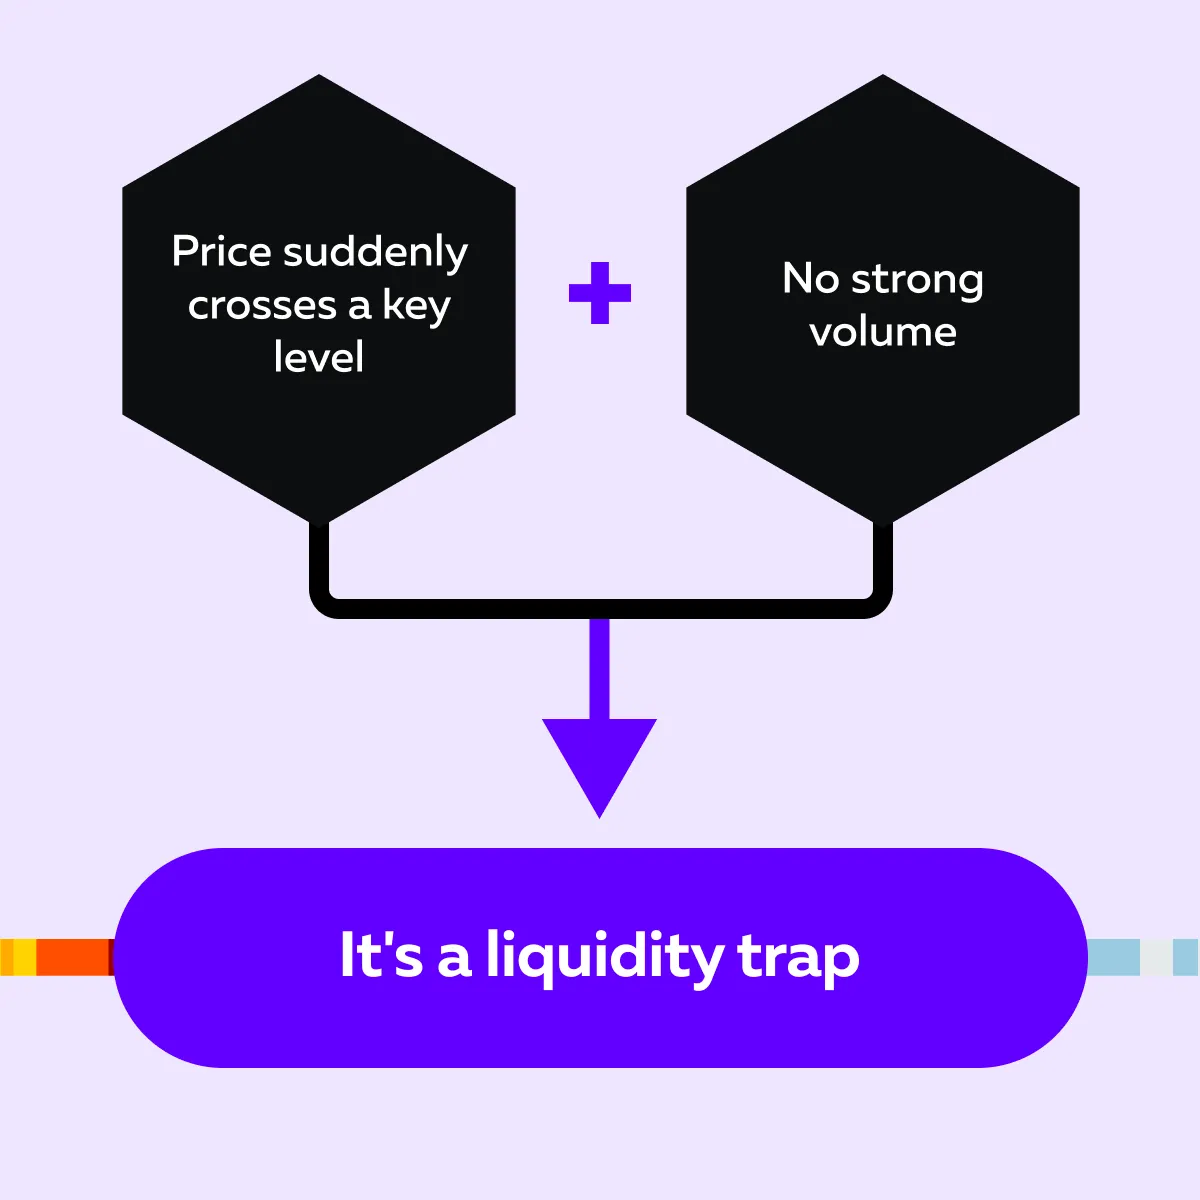
A futures liquidity trap gets created when the market price suddenly moves past a key level, such as:
- A recent high,
- A recent low, and
- VWAP.
But this price move doesn’t have strong volume or real order flow confirmation to support it. This situation looks like a breakout, but it’s not the real deal. Gain more clarity through the graphic below:
Where Can You Observe These Traps?
These traps often show up around important zones that traders are watching, such as:
- Swing highs/ lows,
- Round numbers (like 4500 on the S&P futures), and
- Technical levels.
They trick traders into thinking the market is starting a new trend (when in fact, it’s setting them up).
Why Does This Happen?
Big institutional players need people to take the other side of their large trades. So, they may create a false breakout in futures trading to lure in retail traders. Once those traders enter, the market quickly reverses! This leaves them trapped while the institutions profit. This is a classic example of a futures liquidity trap. Don’t get faked out—use volume dots and liquidity heatmaps to read through the noise.
How a Real Liquidity Trap Unfolds—Step by Step
A futures liquidity trap is usually repetitive and occurs via a set process. By learning it, you can clearly see how it unfolds. When you have the understanding, you do not confuse it with stop runs (which look similar but aren’t true traps).
Check out the graphic below to learn how you can spot a futures liquidity trap using Bookmap:
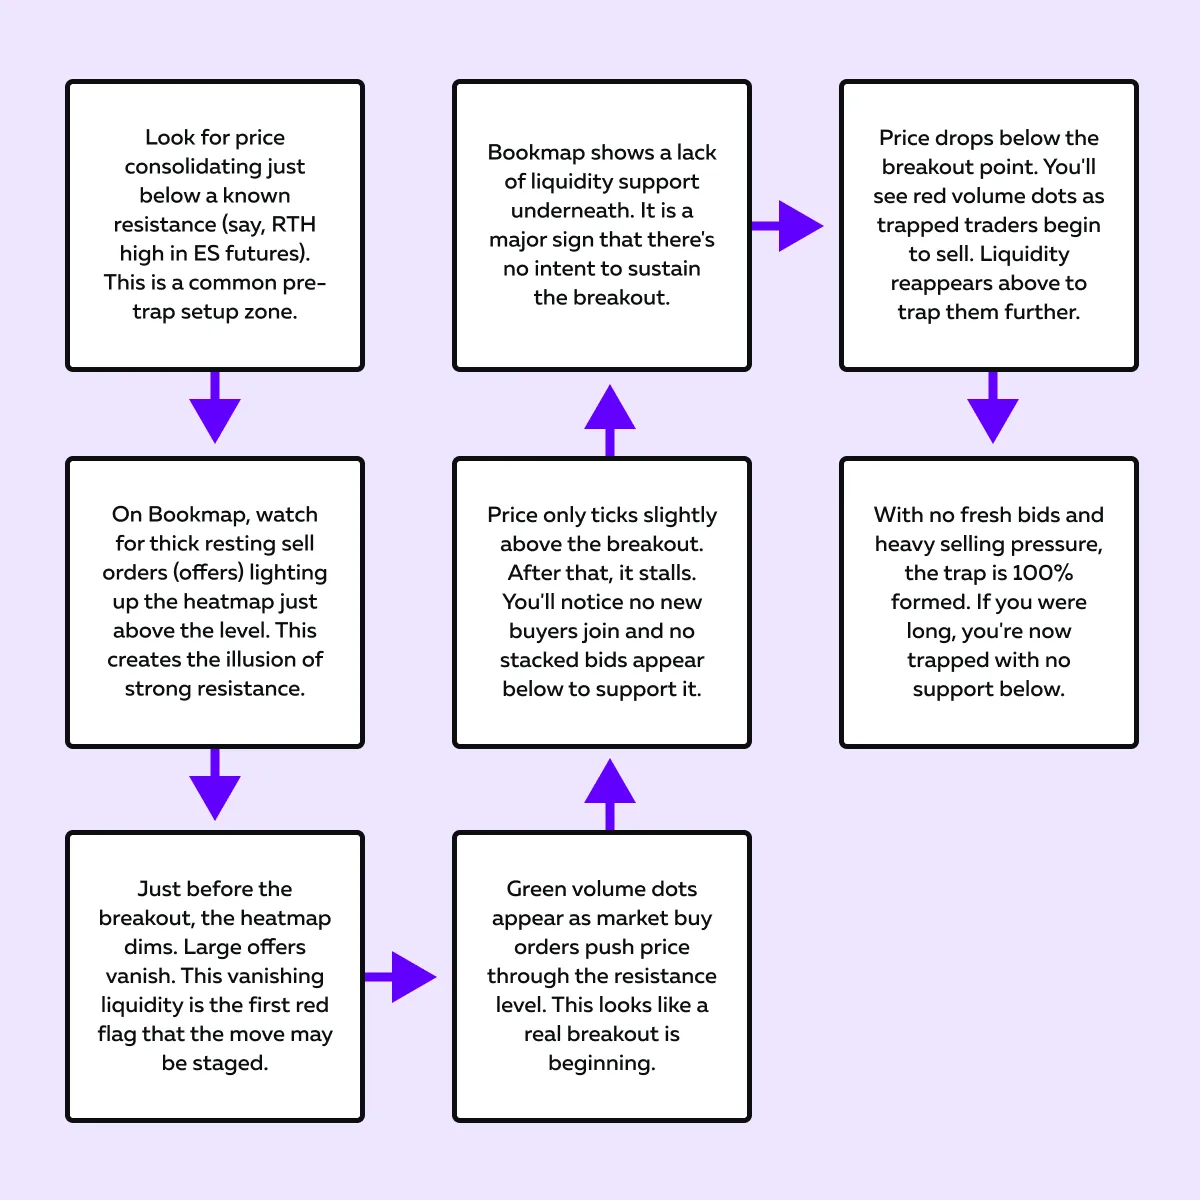
Now, let’s understand in detail how a futures liquidity trap is formed:
Setup: Pre-Breakout Liquidity Build
The formation of a futures liquidity trap starts with prices hovering just below a well-known resistance level, like the RTH (Regular Trading Hours) high on the ES futures.
During this time, if you are using our advanced real-time market analysis tool, Bookmap, you will see that a large number of sell orders (offers) are sitting just above the resistance. These thick offers light up Bookmap’s heatmap! They make it look like serious sellers are ready to defend that level.
The Mistake!
Most retail traders often interpret this as a sign of a potential breakout. It looks like the market is about to blast through the ceiling.
But Here’s the Catch!
Just before the breakout happens, those large sell orders start disappearing. In response, Bookmap’s heatmap dims! This signals that the “visible liquidity” is vanishing.
What’s Going On?
This is your first red flag. It is a classic sign of a false breakout in futures trading. Please note:
- The heavy offers were never meant to be filled.
- They were staged to make it look like genuine resistance.
- They were placed to trick traders into buying the breakout.
Without order flow confirmation, this move is likely setting the stage for a liquidity trap.
The Break: Aggressive Buys Hit—but Price Stalls
Now comes the actual breakout (or at least what looks like one).
Suddenly, a wave of aggressive market buy orders hits the tape! On Bookmap, you’ll see a burst of green volume dots. Price pushes through the resistance level. At first glance, it feels like a true breakout is happening.
But Then – Nothing!
Instead of continuing higher, the price hovers at just a few ticks past the breakout point. Additionally,
- There’s no follow-through.
- New buyers don’t show up to push the move further.
- There are no fresh limit bids appearing underneath to support the price.
On Bookmap, the heatmap remains blank below the price level. It’s like the floor vanished!
This is Where It Becomes Clear
The order flow confirmation is missing! Yes, there was volume, but not the kind that signals a real move. What you’re seeing is volume without continuation!
That’s a Critical Warning Sign!
The aggressive buying at the top was likely absorbed by larger sellers. Most institutions using the false breakout in futures trading dumped their positions.
As a result, retail traders are now caught in a classic futures liquidity trap. They are stuck in long trades with no support beneath them.
The Snapback: Trapped Traders Fuel the Reversal

In the last phase, the futures liquidity trap fully develops!
- Almost instantly, the price starts to fall.
- It falls below the breakout level.
- Suddenly, you see new market sell orders coming in aggressively.
- Resting sell orders start showing up above the price on Bookmap.
Due to these events, all those traders who bought the breakout are trapped. The price is below their entry, and panic sets in! As a result, many of them rush to exit their long trades, and this adds even more selling pressure to the market.
In Bookmap, You’ll Clearly Notice the Following:
- Red volume dots stacking up (showing aggressive market sells)
- Strong liquidity walls above price (sellers ready to keep pressure on)
- No real buying interest or defense below to stop the drop
Now, you must note that this is no longer just a false breakout in futures trading. Instead, it’s the full trap in action. Without proper order flow confirmation, many traders fall into this setup.
Tips for Identifying Real vs. Fake Moves

Want to spot a true breakout versus a futures liquidity trap? Below are some proven tips to let you avoid getting caught in false breakout futures trading setups:
- Use more than one signal
-
-
- Don’t rely only on green or red dots (market orders).
- Combine volume with liquidity behavior.
- You should look at how the price reacts when orders are added or pulled.
-
- If the price moves without support from real liquidity, that’s a red flag!
- Pay attention to timing.
-
-
- Most traps are formed:
- Right after the market opens,
- During economic news releases, and
- In low-liquidity hours (like lunchtime or overnight sessions).
- These are prime times for traps.
- That’s because prices can move easily without much resistance.
- Most traps are formed:
-
- Watch for iceberg orders.
-
-
- Real breakouts usually have hidden buying or selling interest (called icebergs).
- These are large orders split into smaller chunks to avoid detection.
-
- By using Bookmap’s MBO (Market-by-Order) data, you can easily reveal this stealth activity.
- Set alerts for liquidity changes.
-
- Be aware that most traps start with sudden shifts in the order book (like major bids or offers to vanish right before a move).
- You should use alerts to catch these changes early.
- This gives you a chance to step back when something appears staged.
Need a safe way? Always look for order flow confirmation across volume, liquidity, and price action (not just one piece). That’s how you avoid falling into a futures liquidity trap! Learn to distinguish traps from real breakouts in the Bookmap Learning Center.
Common Mistakes That Get Traders Trapped

Do you know why traders get caught in a futures liquidity trap? They make these three avoidable mistakes:
| Mistake I: Chasing price without reading order flow | Mistake II: Ignoring the heatmap | Mistake III: Assuming all volume is strong buying |
|
|
|
The key takeaway? Always look deeper than candles! Let’s learn through the graphic below, how you can avoid getting fooled by what seems like a strong move (but is actually a futures liquidity trap in disguise):
Conclusion
Futures liquidity traps often leave retail traders positioned incorrectly in the market. These traps are designed to lure in buyers or sellers with a false breakout. Later, the price reverses suddenly and leaves them stuck!
But for skilled traders who understand order flow and liquidity behavior, these setups can be opportunities (not risks). How? Stop relying on price alone and start reading the full story: volume, liquidity shifts, and how the market reacts in real time.
By using our modern real-time market analysis tool, Bookmap, you can see where the real interest lies and where it vanishes. Always remember, when you learn to spot futures liquidity traps forming, you gain an edge! Through such knowledge, you can avoid costly mistakes and can even trade in the direction of smart money. Spot real market intent using live order flow—try Bookmap’s full suite of tools.
FAQ
1. What is a liquidity trap in futures trading?
A futures liquidity trap happens when the price breaks through an important level but then quickly reverses. It’s usually caused by big traders! They create a trap by pretending to buy or sell, tricking others into entering.
Once retail traders jump in, the big players go the other way. This traps them!
2. How can you tell if a breakout is real or a trap?
Through our avant-garde real-time market analysis tool, Bookmap, you can easily check if real buyers or sellers are backing the move.
Ideally, on Bookmap, you should look for:
- Strong volume,
- Stacked orders below (or above) the price, and
- Follow-through.
If these are missing, the breakout may be fake!
3. Why does liquidity pull before fakeouts?
Most big players remove their orders before a fake move. They do so to avoid getting stuck. This creates a gap in the order book and makes it easier for the price to spike quickly. However, there is no true interest, and the move fails.
4. Can Bookmap help avoid false breakouts?
Yes! Bookmap shows real-time volume and liquidity changes. By analyzing them, you can determine:
- When orders vanish,
- When fake moves happen, and
- Whether there’s real support or resistance.
By using our advanced tool, Bookmap, you can get clues that common price charts can’t offer.
Sign Up Now