See earnings more clearly in real time.
Compare plans to access deeper market visibility for earnings.
Education
May 15, 2025
SHARE
How to Trade Q2 Earnings Reactions: Order Flow Tips and Real-Time Strategies

For traders, earnings season is one of the most volatile and opportunity-rich times of the quarter. But, Q2 earnings trading isn’t just about guessing the headline numbers. Instead, it is about interpreting how the market reacts when new information hits the tape.
Please realize that a company can crush earnings and still drop like a rock if guidance disappoints or if the good news is already priced in. That’s why smart traders don’t just read press releases! They watch the tape, track liquidity shifts, and respond to real-time order flow. Gaps, traps, and reactions at key levels all tell a deeper story.
Confused? Want to trade like a pro during the earnings season? In this article, we will learn how to trade earnings reactions with preparation, structure, and risk control. Read this article till the end to participate strategically this season.
Why Earnings Season Creates Unique Trading Opportunities?
Earnings season lets you see how companies are performing. But the real value lies in how the market reacts (not just in the raw numbers). Let’s understand in detail:
What Does Earnings Season Really Represent?
Earnings season is when companies report their financial results from the previous quarter. However, trading during this period isn’t just about whether a company beat or missed estimates. It’s about:
- The market’s interpretation of the results
- And how those results compare to what was already expected.
This interpretation is what creates Q2 earnings trading opportunities.
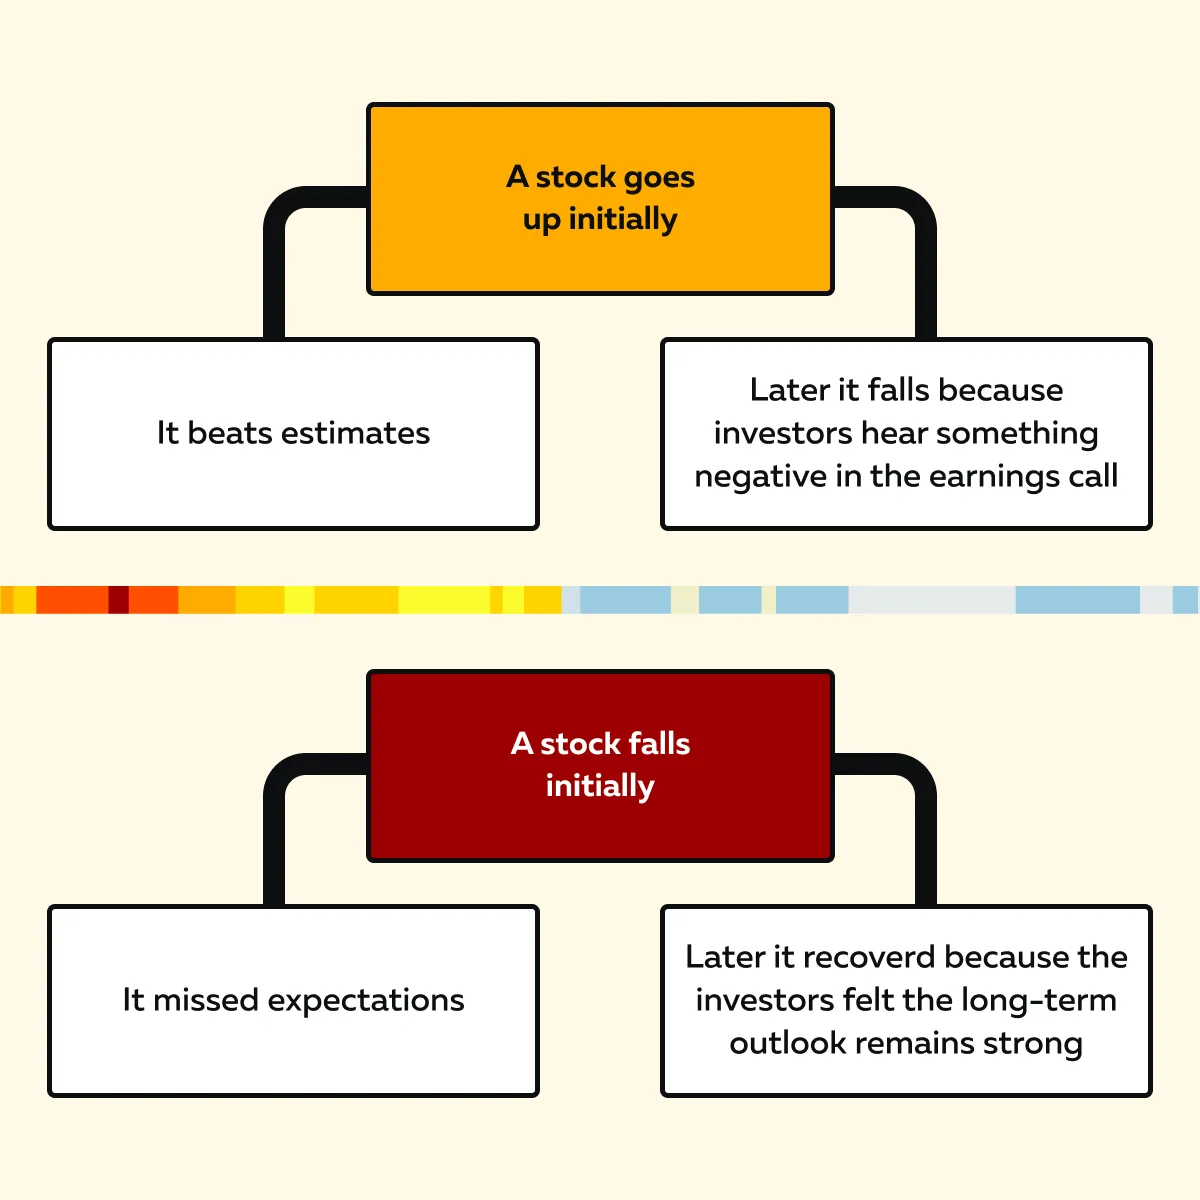
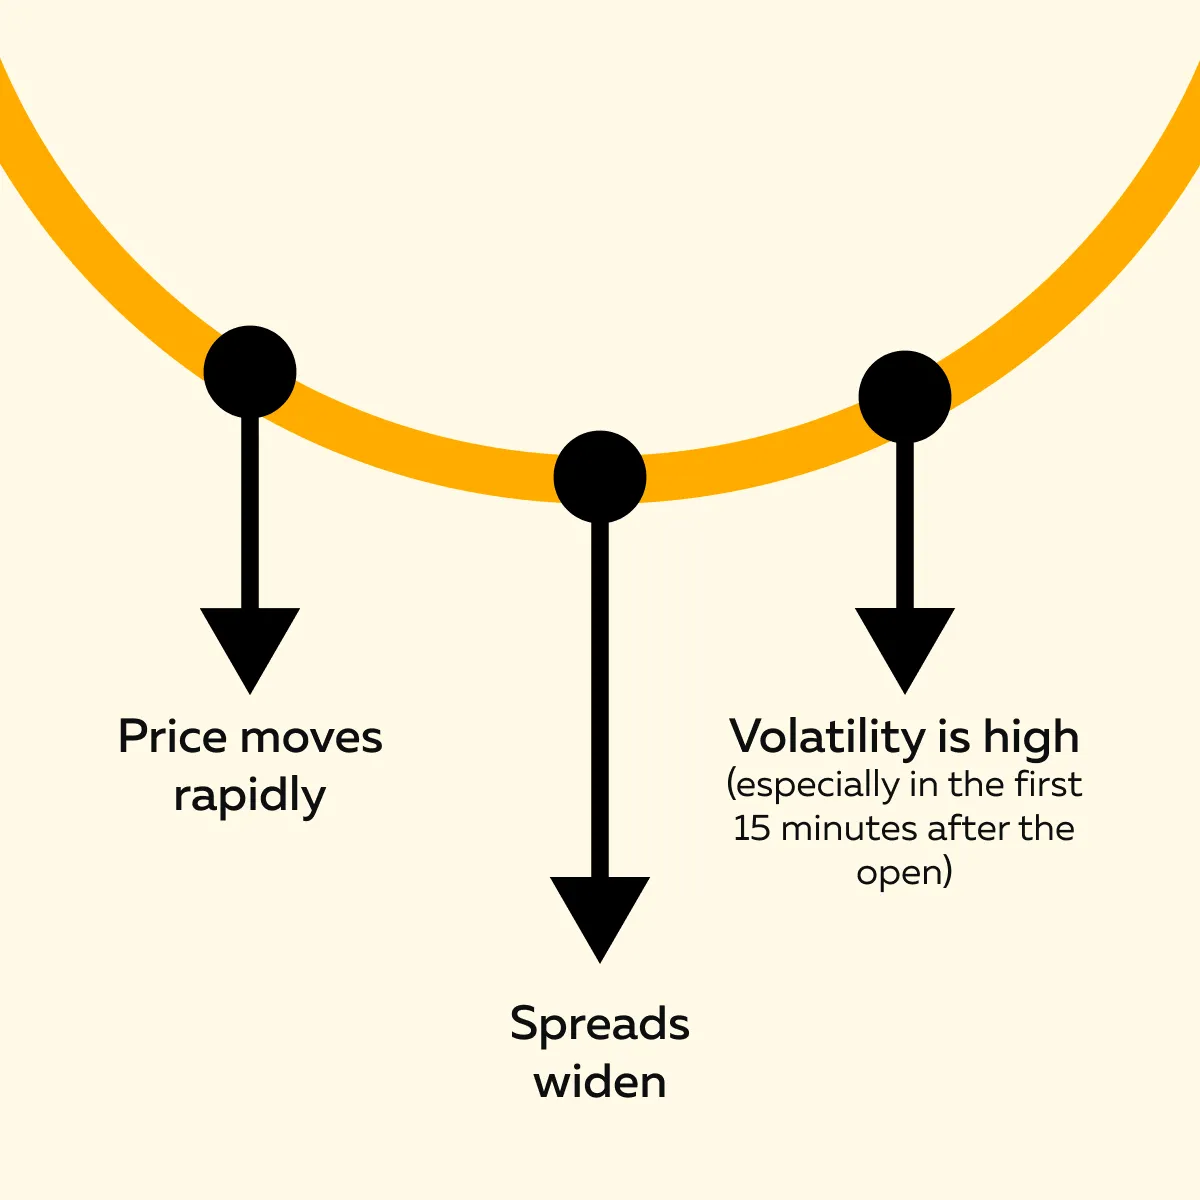
Price Moves Can Be Misleading
Stock prices often jump or fall sharply right after earnings are announced. But don’t assume that the first reaction tells the whole story! Check out the graphic below to learn why:
Forward Guidance Is Often More Important Than the Results
Companies may report strong earnings for the quarter, but most traders usually pay close attention to what management says about the future. If a company warns about slower growth next quarter or new risks (like supply chain problems or international regulations), investors may sell the stock even if recent results were good.
For example:
- Say a company like NVIDIA reports strong Q2 earnings.
- But, the management mentions issues like:
- Chip export restrictions to China
or
- Weakening demand forecasts.
- Now, the stock could still drop sharply.
Thus, you must realize that forward guidance weighs more heavily on stock price than current performance.
Key Questions Traders Must Ask
To make smart trades during earnings season, you must consider the following:
| What’s already priced in? | What does the market care about this quarter? | What is management signaling? |
|
|
|
To find better answers to these questions, you must analyze earnings season order flow. By tracking how large investors are positioning around earnings calls, you can gain insight into whether the market is bullish or bearish.
Focus on How Price Reacts, Not Just What’s Reported
Want to gain a real trading edge? It doesn’t come from predicting earnings numbers. Instead, it comes from watching how the market reacts to the news once it’s out.
As a trader, you should track the stock’s price action and order flow during and after the report (particularly in the first 15–30 minutes). That’s because price action reflects the collective opinion of investors. It shows what traders and investors really think of the earnings:
- Do they trust management?
- Do they believe in the outlook?
- Are they disappointed despite good numbers?
By analysing this reaction, you can create better entry or exit points.
How Stocks Typically React After Earnings?
After a company reports earnings, there are strong price fluctuations. But the first move isn’t always the final direction! Let’s check out, through the graphic below, what price behavior patterns you, as a trader, need to understand:
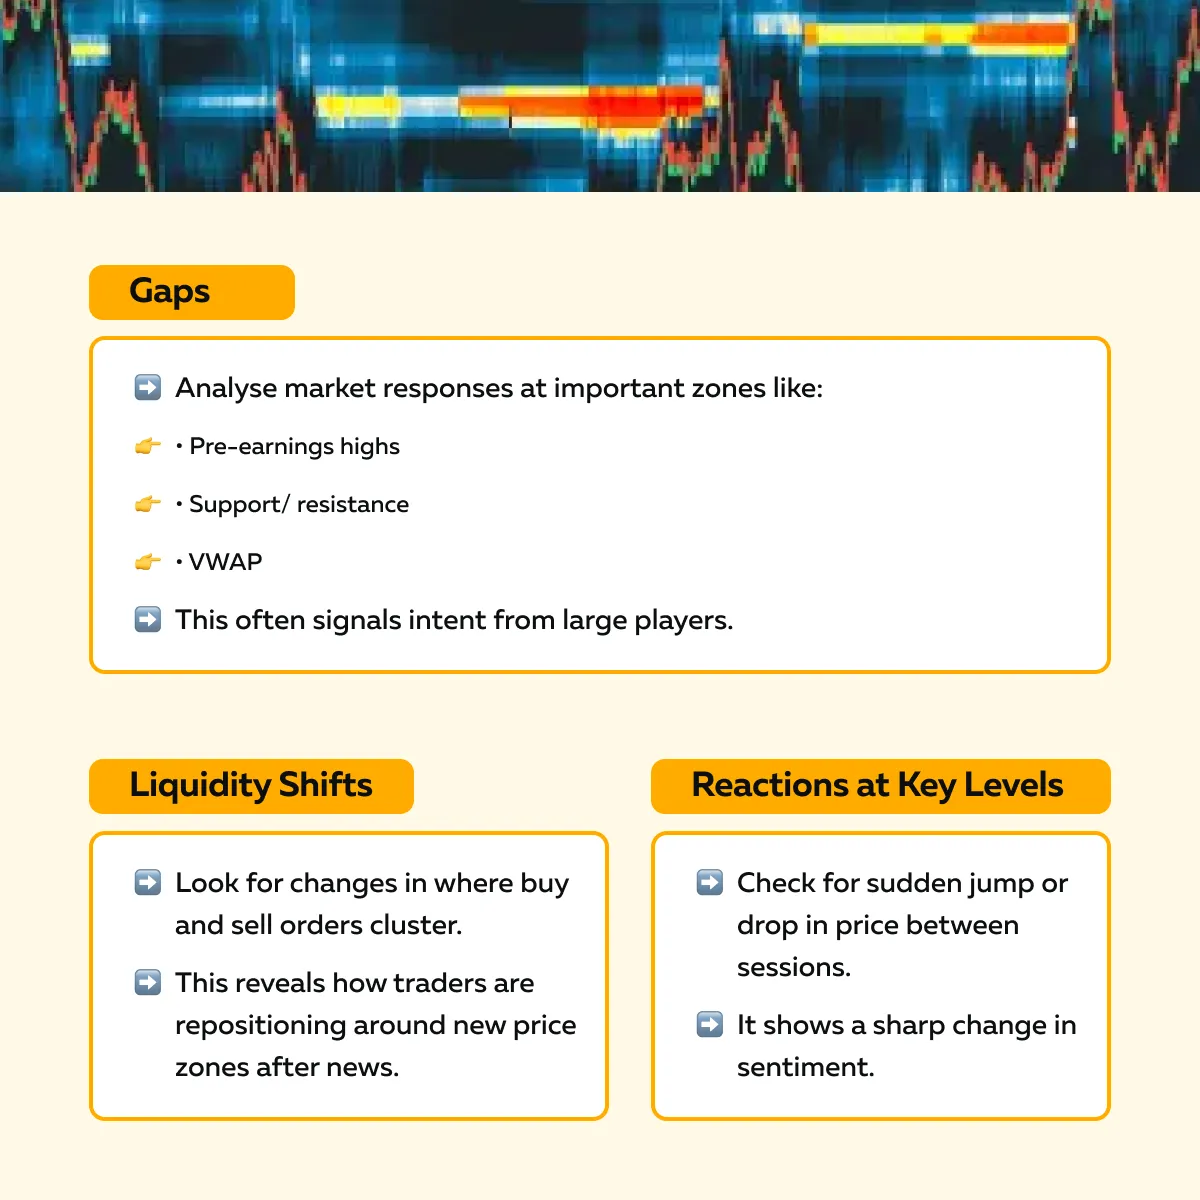
For more clarity, let’s see how stocks usually react after the release of the earnings report:
Gap and Go or Gap and Fade
When earnings are released, stocks often “gap”. This means they open much higher or lower than the previous day’s close. Usually, this happens in two ways:
| Gap and Go | Gap and Fade |
|
|
As a trader, you should be cautious! Just because a stock jumps after earnings doesn’t mean it will continue rising. You must wait to see whether the price holds or reverses.
Liquidity Voids and Restacking
Be aware that right after an earnings gap, liquidity often becomes thin. This creates a “liquidity void”. For the unaware, it means fewer orders are sitting in the market. However, as the trading day goes on:
- Liquidity slowly returns
and
- Builds around the new price area.
This process is called restacking the order book. During this time, real opportunities emerge (particularly for traders focused on earnings season order flow). You can easily identify where large players are willing to buy, sell, or trade based on that activity.
Absorption Around Key Levels
After earnings, stocks often test these three important price levels:
- The high or low from before the earnings release,
- The after-hours reaction range, and
- Previous resistance or support areas.
At these levels, most traders look for absorption. That’s because it means big buyers or sellers are quietly taking the other side of aggressive trades. For example:
- Say buyers keep stepping in when others are selling.
- Now, the price might hold and move higher.
By spotting this behavior, you can better plan your entries or exits. Your decisions will be based on how the market reacts (not just the earnings result).
Techniques for Trading Q2 Earnings Reactions
While trading earnings, you don’t only guess whether a company beats or misses estimates. Besides this, you must understand how the stock might react once the report is out. Check out the graphic below to learn what the best traders do:
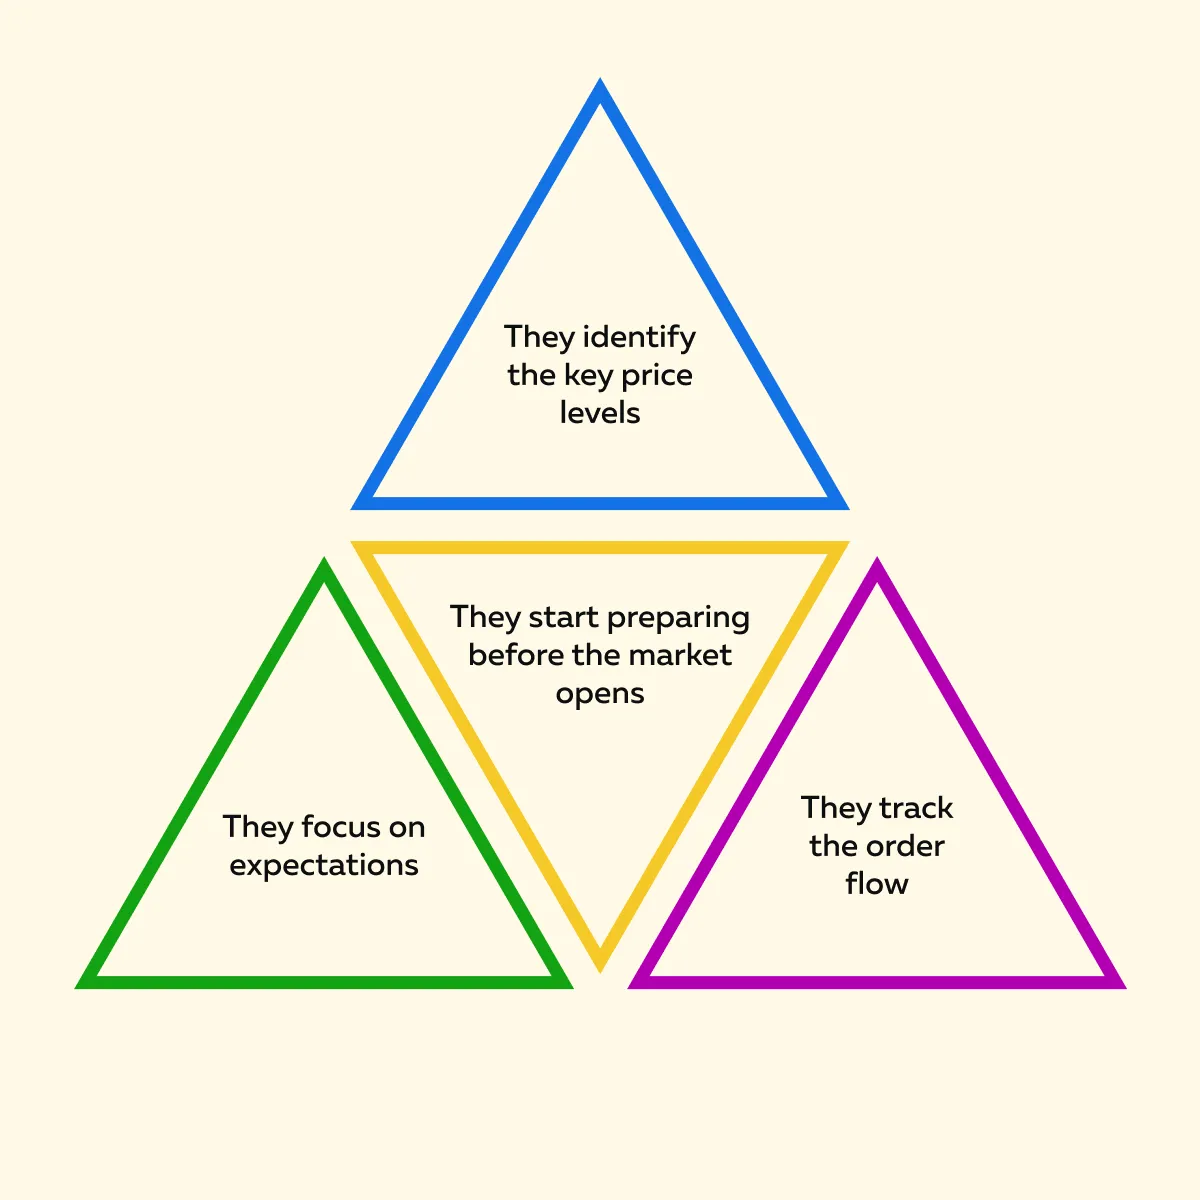
Always remember that the best traders do not just focus on the raw numbers. Below are some proven steps you can take to trade Q2 earnings reactions profitably:
Step 1: Understand Expectations and Pre-Earnings Behavior
Before you make any trade, review how the stock behaved in the days or weeks leading up to the earnings report. Ask yourself these three questions:
- Has the stock been moving up steadily? – This signals bullish sentiment and high expectations.
- Has it been dropping? – That indicates fear or anticipation of weak results.
Also, check the news and ask:
- Are analysts raising their targets? Is there a lot of talk about AI, margins, or global risks? – By using tools like short interest data and options positioning, you can tell how investors are feeling.
Let’s understand better through an example:
- Say there’s extreme optimism.
- But the company only slightly misses or gives cautious guidance.
- Now, the stock could fall on a “sell the news” reaction.
- This happens often during earnings season when traders price in too much good news ahead of time.
Furthermore, especially in Q2 earnings trading, you’ll want to ask – What is the market really focused on this quarter? For tech names, it might be AI-related revenue or cost control. In other sectors, it could be:
- Supply chain issues,
- Inflation, and
- Consumer demand.
See how stocks react to earnings surprises in real time with Bookmap’s order flow tools.
Step 2: Map Key Levels Before the Open
Once earnings are out and before the regular session begins, map out key technical levels to prepare for how the stock might trade. Below are some important zones you must mark:
| Zones to mark | Reason |
| Pre-market high and low | These show how the stock behaves in an early reaction. |
| After-hours spike level | If the stock jumped or dropped right after the report, that level can act as support or resistance. |
| VWAP (Volume-Weighted Average Price): | Our real-time market analysis tool Bookmap shows VWAP. Using it, you can identify where most of the volume is trading. |
| Previous earnings reaction zones | Some traders review past earnings moves to find patterns or “seasonal behavior.” |
These levels are critical because they often attract price action in the first 15–30 minutes. During these times, large players usually try to:
- Push the price through these areas
or
- Trap emotional traders reacting to headlines.
By watching how order flow behaves around these levels, you can determine real buying or selling interest. Please realize that this is more valuable than reacting to the initial price jump.
Step 3: Wait for the Order Book to Reset
After an earnings release, stocks often open with thin liquidity. Let’s learn what this means:
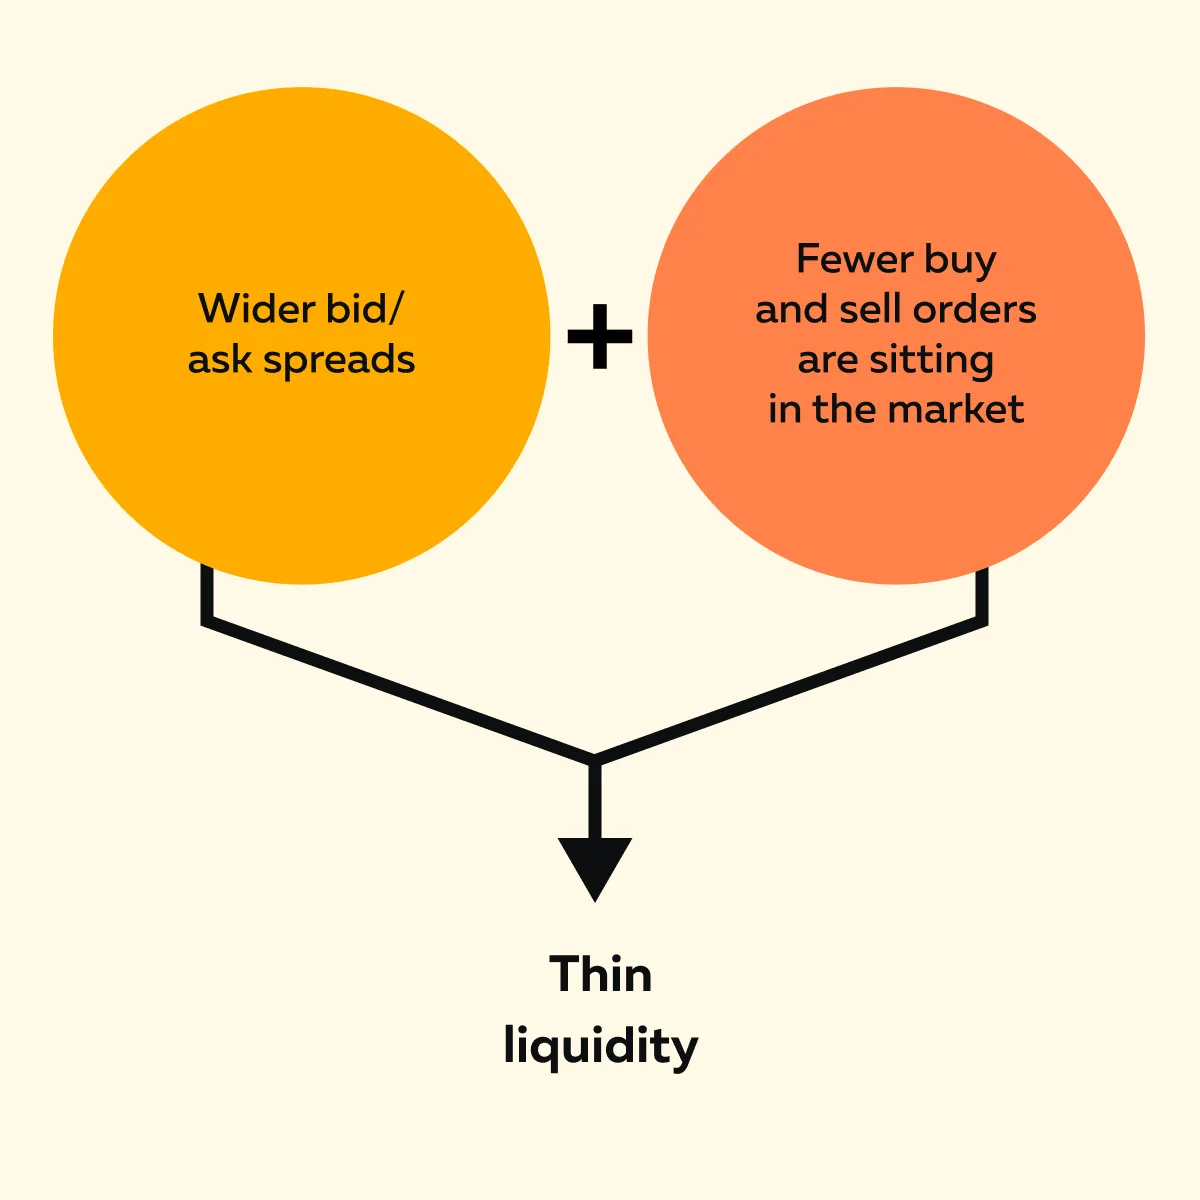
This creates an unstable trading environment where it’s easy to get trapped by sudden price swings. Thus, you should ideally wait unless the setup is very clean, such as:
- Clear absorption of aggressive selling (where buyers are holding the line)
or
- A strong continuation with heavy buying pressure.
For traders using our advanced market analysis tool, Bookmap, this is a key moment. As the first 10–30 minutes pass, the order book starts to rebuild. Resting buy and sell orders begin to cluster around the stock’s new price range. This process is called “liquidity restacking”. By analyzing it, you can easily identify where traders really want to do business.
Now, this is where real trading opportunities during earnings season start to appear. By letting the market settle, you can avoid chasing unreliable moves. Instead, you can wait for the structure to form.
Step 4: Track Aggression vs. Structure
Once the order book starts forming a new structure, it’s time to analyze:
- How price moves through key levels
and
- Whether a strong volume supports those moves.
To make this analysis, ask yourself these major questions:
- Is the move aggressive?
- Do you spot large dots on Bookmap, showing big market orders hitting the tape?
- Is that aggression being absorbed?
Please note that if the price isn’t moving despite heavy buying or selling, someone may be quietly taking the other side and stopping progress. That’s a warning sign! To confirm this state, look for these key signals:
| Signals to watch for | Explanation |
| Absorption at critical levels |
|
| Failed breakout attempts |
|
| Trend confirmation |
|
Let’s understand better through an example:
- Suppose a stock gaps down after earnings.
- Initially, it looks bearish.
- But then, it starts building a strong bid near pre-market support.
- You notice aggressive buyers stepping in.
- The sell-side also starts thinning out.
- This behavior suggests that big players are preparing to reverse the move.
- That setup (backed by earnings season order flow) may offer a high-probability long entry.
Learn order flow strategies for volatile trading days—explore Bookmap’s Learning Center.
Smart Adjustments for Trading Earnings Volatility
Trading on earnings day is very different from regular intraday trading. Let’s see why:
Thus, if you’re trading Q2 earnings reactions, you need to adjust your:
- Size,
- Strategy, and
- The mindset is to stay in control.
Let’s understand these smart adjustments in detail:
A) Size Down! Because Volatility Is Your New Leverage
On earnings day, stocks can move $3–$5 in minutes. That kind of speed means your usual stop-loss and trade size may be too risky. Thus, ideally, you should cut your position size to match the increased range.
For example:
- Say you usually trade 500 shares of a stock with a $1 daily range.
- Now, it’s moving $4 per 5-minute candle.
- In response, you should reduce your size to maybe 200 shares or fewer.
Think of volatility as leverage! You don’t need a big size to get a big move.
When you develop this mindset, you can easily survive during unpredictable post-earnings price action. Remember that this is more important than trying to be consistently right every time.
B) Wait for Liquidity Structure—Not Just Price Movement
After an earnings release, the price fluctuates rapidly. But that doesn’t mean the move will last! Many early breakouts fail fast because there’s no support underneath.
Thus, instead of jumping in right away, wait for the structure to form. Ask yourself:
- Are buyers showing up repeatedly at a support level?
- Are sellers blocking prices at a ceiling?
To find answers to these questions, start using our advanced market analysis tool, Bookmap. Using it, you can see liquidity stacking and large volume dots. Both reveal where serious traders are placing orders.
C) Accept That Traps Are Normal
Even when a stock reports strong earnings and gaps up, it might still sell off and close lower. Why? That’s because:
- Traders may not like the guidance
or
- The results were already expected and priced in.
This is a common “sell the news” reaction during earnings season. So, please realize that a good trade idea can still fail. Thus, don’t rely on the news alone. Instead, you must wait for confirmation through order flow and structure before committing.
D) Don’t Force “Home Run” Trades
Do you think? – A 10% gap means there’s a $5 move waiting for you. However, that’s not always the case! Instead, you should focus on small and high-conviction setups where:
- Liquidity is stable,
- Volume supports the move, and
- A key level holds or breaks.
Use the first 30–45 minutes to watch how the market settles. Only act when multiple signals align.
E) Know When to Skip
Sometimes the smartest move is to do nothing! Check out the graphic below to learn when you must walk away:
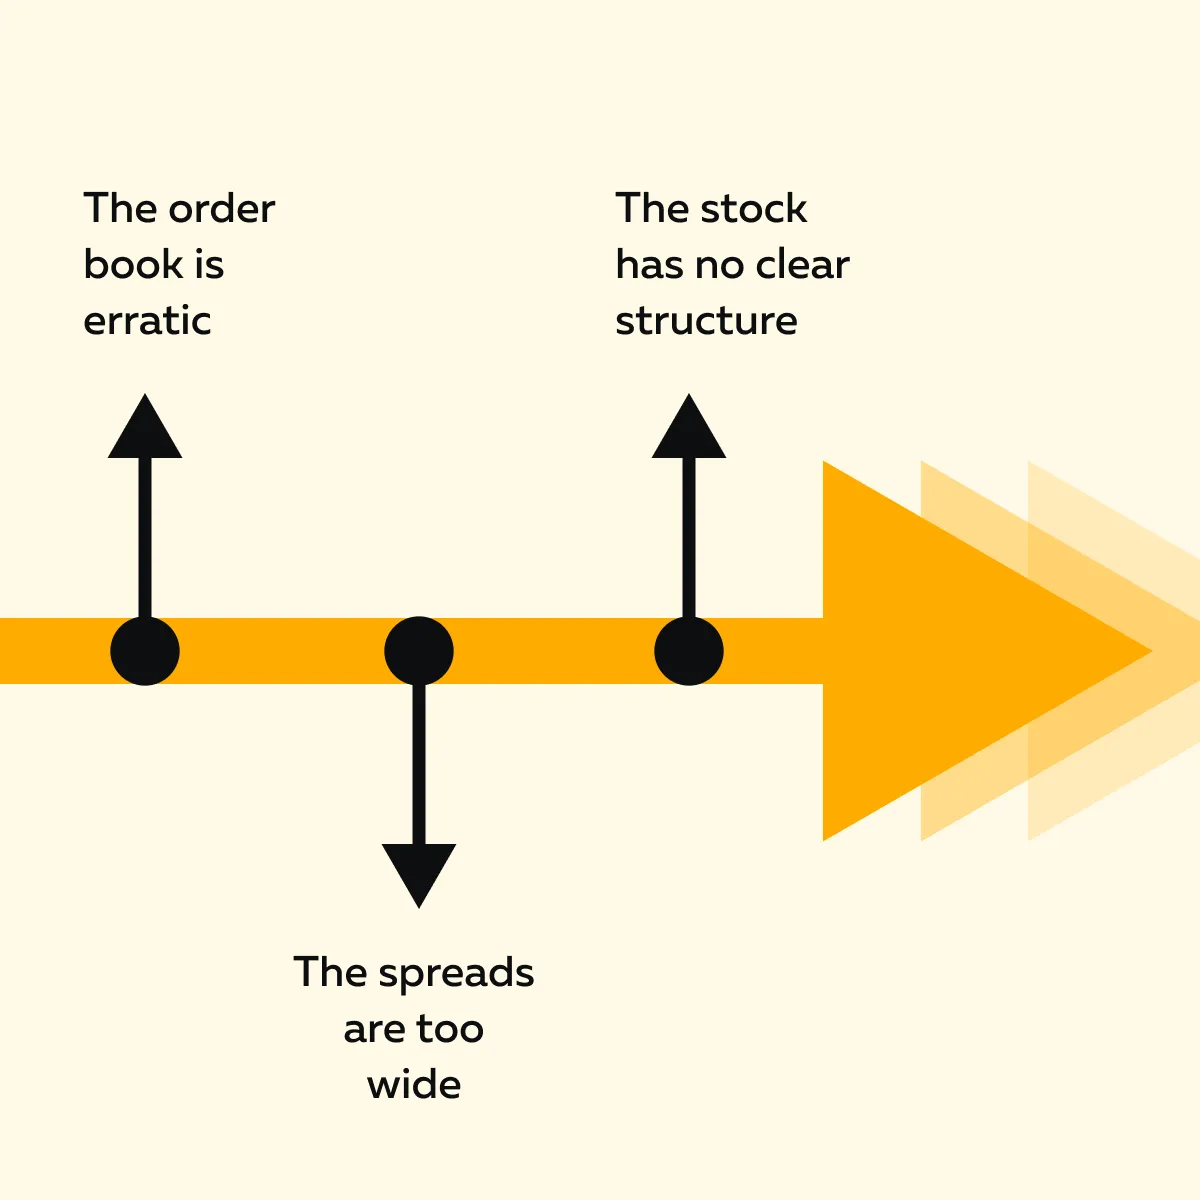
Remember that trading in a high-volatility environment without a plan can lead to unnecessary losses. Thus, even “not trading” is a valid position (particularly during earnings season).
Conclusion
Do you trade earnings by guessing the numbers? No! It is about understanding how the market reacts once the news is out. The real edge comes from reading price action, watching how liquidity shifts, and waiting for the structure to form after the initial move.
Please realize that big gaps or flashy headlines can be misleading! What matters is how buyers and sellers respond in real-time. Ideally, you should prepare for key levels and track order flow. This lets you avoid emotional traps and trade with more control.
The best tool to track order flow is our avant-garde market analysis tool, Bookmap. Using it, you can see where the real intent is building (not just noise). So, do you want to be more consistent in trading decisions during the Q2 earnings season? Don’t get trapped during earnings season—track liquidity shifts with Bookmap.
FAQ
1. Why is earnings season so volatile for stocks?
Earnings reports bring new information that can surprise traders, such as:
- Better or worse profits,
- Future plans, and
- Expected risks.
This causes stocks to fluctuate as traders adjust their expectations. As a result, during these times, prices jump or drop suddenly (called “gaps”). Also, buy/ sell orders disappear or shift fast. That’s why earnings season often leads to big moves and sudden changes in liquidity.
2. What is a “gap and fade” after earnings?
A “gap and fade” happens when a stock opens much higher than the day before (usually on good earnings news), but then starts falling during the regular session.
Mostly, this happens because:
- Traders may have expected even better results
or
- The stock was already priced for great news.
When reality doesn’t meet the hype, many sell to take profits. As a result, the stock fades back down.
3. How does order flow help during earnings reactions?
Order flow shows how real buyers and sellers behave after earnings. You can track this on our Bookmap and see if:
- Strong buyers are stepping in
or
- Sellers are blocking moves.
This lets you avoid false breakouts and only trade when there’s real support behind the price. It’s like seeing what’s happening under the surface, not just the chart!
4. When is the best time to trade a stock after earnings?
The first few minutes after the market opens are usually wild. During these times:
- Prices jump,
- Spreads are wide, and
- Volume is noisy.
Thus, ideally, you should wait for 5 to 15 minutes and let the market settle. After this initial period, liquidity usually rebuilds, and support and resistance levels become clearer. Now, you can better judge whether a move will last or reverse.
5. How can Bookmap improve my earnings trading strategy?
Our Bookmap shows real-time activity in the order book. Using it, you can see:
- Where buyers and sellers are placing large orders
and
- How volume flows at key levels.
During earnings, this also lets you see whether price moves are strong (supported by real demand) or fake (driven by emotion but lacking support). Additionally, you can spot areas where trades are being absorbed or rejected. This lets you enter or exit with more confidence.
Sign Up Now