See open interest more clearly in real time.
Compare plans to access deeper market visibility for open interest.
Futures
August 6, 2024
Updated
SHARE
Interpreting Open Interest in Futures Markets for Better Trades

Understanding open interest is a game-changer. Yes, several successful traders analyze changes in open interest to identify trends and market sentiment. Have you learned the art yet?
This article aims to explain what open interest is, how it differs from trading volume, and why it’s a crucial indicator for traders. You’ll learn how to analyze changes in open interest to understand market dynamics and identify trends. We’ll cover practical applications, such as spotting breakout opportunities and recognizing seasonal patterns.
Additionally, we’ll see how combining open interest with other technical indicators, like moving averages and volume, can refine your trading strategies. By the end, you’ll know how to use open interest data to confirm market strength, anticipate reversals, and distinguish between speculative trading and hedging. Let’s begin.
What is Open Interest in Futures Trading?
Open interest in futures trading refers to the aggregate count of outstanding futures contracts that have not been settled. These contracts remain active in the market. This means they have not been:
- Closed out,
- Expired, or
- Fulfilled by delivery.
Open interest is updated at the end of each trading day. It must be noted that open interest differs from trading volume, and both these metrics measure different aspects of market activity:
| Open Interest | Trading Volume |
|
|
Let’s understand this with the help of the given scenario:
- Assume that two traders create a new futures contract.
- One buys the futures contract, and the other sells.
- In this case, both the trading volume and the open interest increase by one unit.
- If an existing contract is closed out,
- The trading volume increases by one unit
but
- The open interest decreases by one unit.
Furthermore, Open interest is a vital indicator for traders. That’s because it provides insights into the:
- Market’s strength
and
- Potential future movements.
Let’s see how open interest signals market strength or weakness:
| Increasing Open Interest | Decreasing Open Interest |
|
|
How to Analyze Open Interest to Understand Market Dynamics

Analyzing open interest helps traders make informed decisions. By observing changes in open interest, traders can infer:
- Different market scenarios
and
- Potential future movements.
Let’s have a look at the different market scenarios indicated by changes in open interest.
- Rising Prices and Increasing Open Interest
- This combination indicates a strong bullish trend.
- It shows that new money is supporting the upward price movement.
- Rising Prices and Decreasing Open Interest
- This combination signals a potential reversal.
- The rise in prices is not supported by new positions.
- This market situation suggests that the upward movement may be losing momentum.
- Falling Prices and Increasing Open Interest
- This combination shows a strong bearish trend.
- It indicates that new money is supporting the downward price movement.
- Falling Prices and Decreasing Open Interest
- This combination suggests a potential bottom or reversal.
- That’s because the drop in prices is not supported by new positions.
- A potential weakening of the downward trend is indicated.
Besides prices, traders combine open interest with trading volume to gain insights. Let’s see how:
| Market Scenario | Explanation | Implication |
| High Volume and Increasing Open Interest | A high volume of trades with increasing open interest indicates strong participation and interest in the current trend, whether it’s up or down. | This is a sign of a robust trend supported by both:
and
|
| High Volume and Decreasing Open Interest | High trading volume with decreasing open interest suggests that the market is experiencing significant position liquidation. |
|
| Low Volume and Increasing Open Interest | Low trading activity but increasing open interest indicate that new positions are being established quietly, without much trading noise. |
|
| Low Volume and Decreasing Open Interest | Low trading volume combined with decreasing open interest suggests a lack of interest in:
and
|
|
What are Rollover Periods?
Rollover periods are critical times in futures trading. It reflects a period when:
- Contracts are near expiration
and
- Traders roll their positions from the expiring contract to a new one.
Mostly, this is common in longer-term positions.
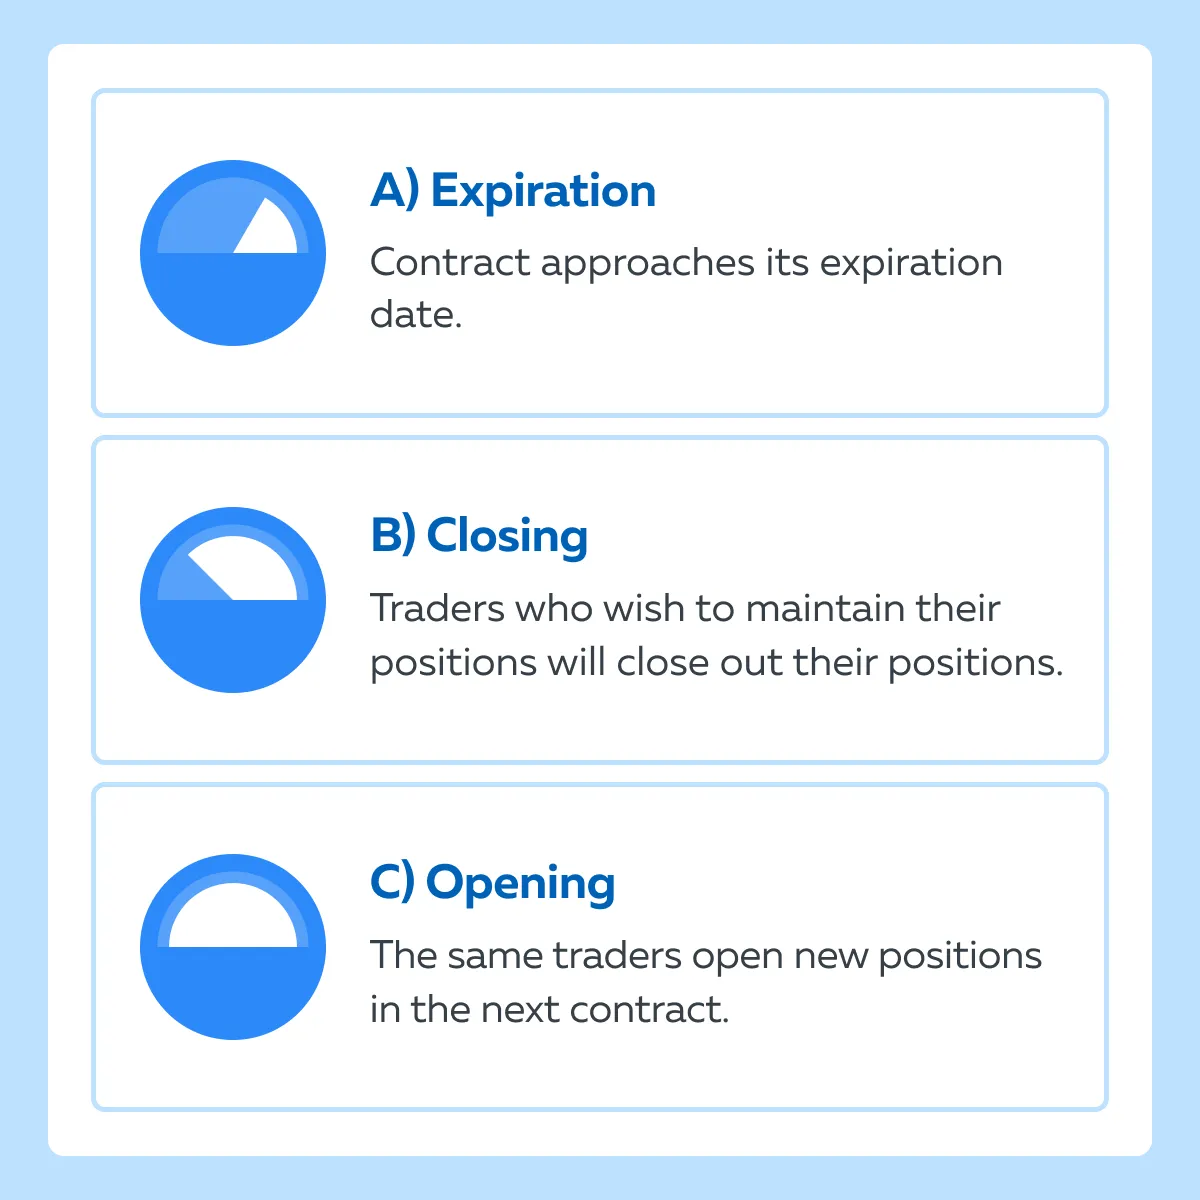
Traders must significantly note that, during rollover periods,
- You often see a spike in both:
- Trading volume
and
- Open interest
- This activity is not necessarily indicative of new market sentiment.
- However, it indicates that traders are making technical adjustments to maintain their positions.
How to Analyze Open Interest to Understand Market Dynamics?
Most traders analyze open interest in conjunction with:
- Price movements
and
- Trading volume.
Understanding these relationships helps traders interpret market strength and potential reversals. Additionally, it also distinguishes between speculative trading and hedging activities. Let’s understand this in detail:
Increasing Open Interest + Rising Prices
When both open interest and prices are increasing, it generally indicates that new money is entering the market. This is seen as a sign of market strength. It also suggests that the upward trend is well-supported and likely to continue. For example,
- Say the price of the E-mini S&P 500 (ES) futures contract has been rising over the past week.
- The price rise is accompanied by a steady increase in open interest.
- This activity shows that new buyers are entering the market.
- There exists a bullish trend.
Decreasing Open Interest + Rising Prices
If prices are rising but open interest is decreasing, it suggests that the uptrend is not well-supported. This activity often indicates liquidation. Here, the existing long positions are being closed out, rather than new positions being added.
But why is the price rising? Possibly, the rise in prices may be driven by short covering rather than genuine demand. For example,
- Assume that the ES futures contract price increases but open interest declines.
- This activity is a warning sign that the rally is due to short sellers buying back their positions rather than new buying interest.
- It also signals that the uptrend could be short-lived.
Decreasing Open Interest + Falling Prices
When both open interest and prices are falling, it suggests that the market is losing momentum. This scenario often indicates a potential reversal as traders close out their long positions. The declining open interest suggests that traders are not interested in maintaining their positions at lower prices. For example,
- Say the ES futures contract price drops and the open interest also decreases.
- This activity shows that traders are exiting their long positions.
- The bearish trend is weakening, and a reversal might be imminent.
How can traders distinguish between speculative trading and hedging by analyzing the combination of open interest and volume?
| Parameters | High Volume and Increasing Open Interest | High Volume and Stable or Decreasing Open Interest |
| Scenario | This situation indicates “speculative interest,” especially if there are pronounced price movements. | This situation suggests “hedging activities”. |
| Implication |
|
|
| Example |
and
|
|
How Does Volume Help in Confirming Open Interest Signals?
When both volume and open interest increase, it confirms that new money is supporting the current trend. This is a strong signal that the trend is likely to continue. See the graphic below:
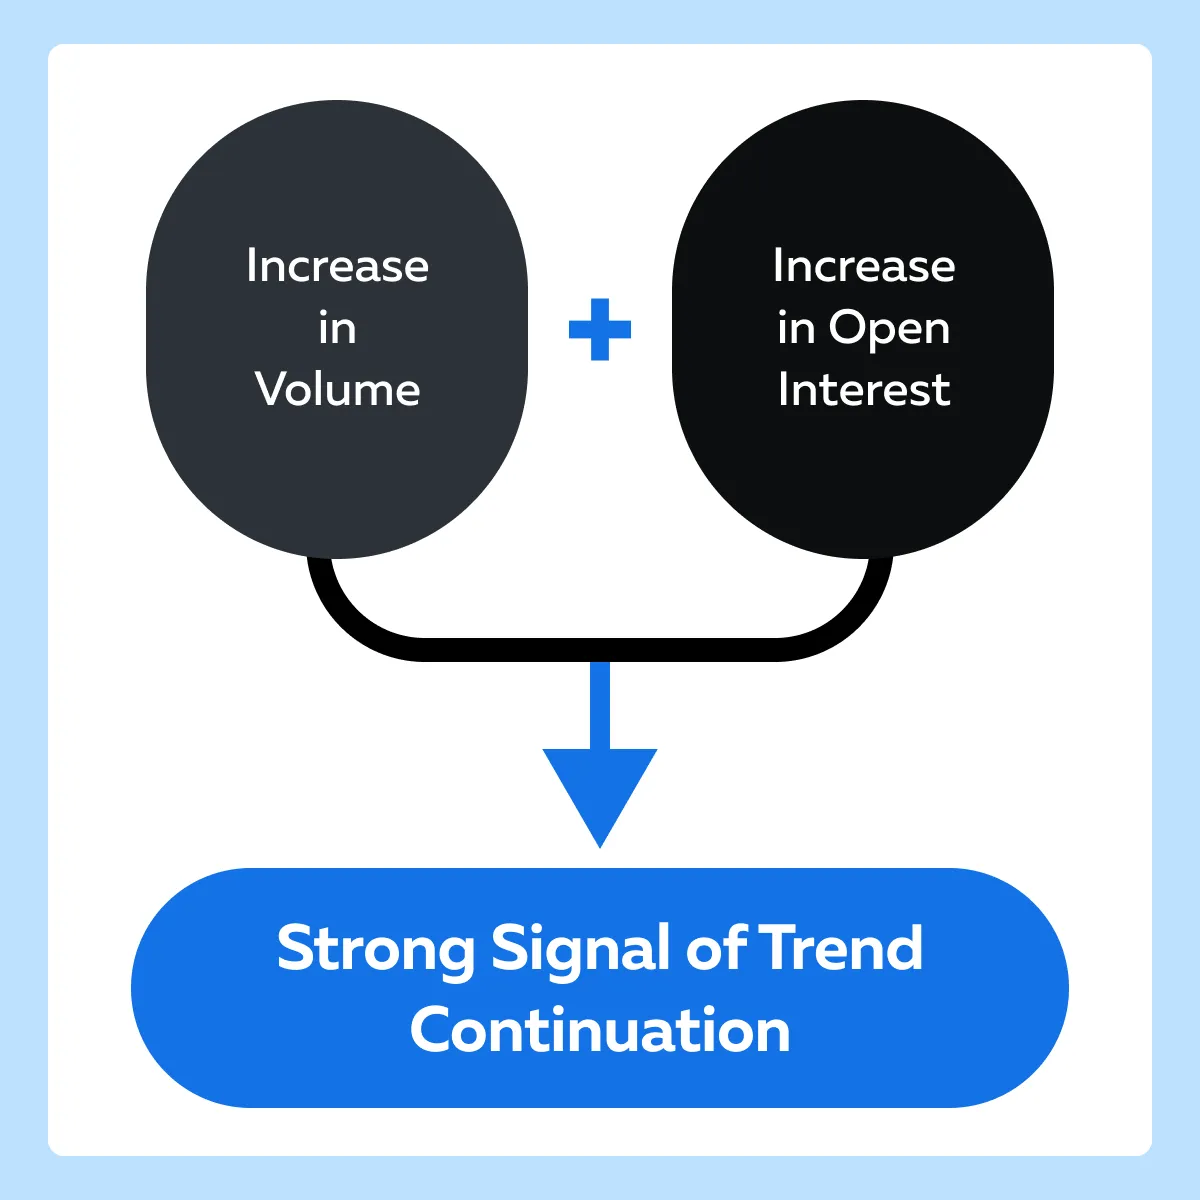
For example,
- Let us assume that there is a significant market announcement or geopolitical event.
- Both volume and open interest in the ES futures contract spike.
- This event suggests strong entry signals from new traders.
- These traders are entering the market based on the news.
Practical Example with ES Futures Contract
The Scenario
For over a week, the ES futures contract has been experiencing a market rally. Analysts observe the following:
| Day | Price rise (%) | Increase in Open Interest (contracts) | Level of Volume |
| Monday | 1.5% | 2,000 | Above average |
| Tuesday | 1% | 3,000 | High |
| Wednesday | 0.80% | 1,500 | High |
| Thursday | 1.20% | 2,500 | Above average |
| Friday | 1.10% | 3,000 | High |
The Interpretation
-
- The consistent increase in both volume and open interest during the market rally indicates strong bullish sentiment.
- It is supported by new speculative buying.
- Traders interpret this as a signal that the upward trend is robust and likely to continue.
The Trading Strategy
- Based on this data, a trader decides to enter long positions in the ES futures contract.
- They anticipate that the rally has strong support and will persist.
- They might also set tighter stop-loss orders to protect against potential volatility.
Practical Applications of Open Interest in Trading Strategies
Open interest is a versatile tool. Traders use it in various ways to enhance their trading strategies. Let’s have a look at some practical applications of open interest:
Application I: Identifying Market Strength or Reversal
Traders can use changes in open interest to confirm market sentiments and predict potential reversals:
| Bullish Sentiment | Bearish Sentiment | Potential Reversal |
|
and
|
|
Application II: Seasonal and Cyclical Trends
Open interest analysis helps traders identify and take advantage of:
- Seasonal patterns
or
- Cyclical trends.
This holds especially in commodities markets. Let’s see how:
| Agricultural Products | Energy Futures |
|
|
Application III: Open Interest Breakouts
Traders spot breakout opportunities by monitoring “sudden spikes” in open interest. Usually, these spikes signal the start of a new trend.
| Identifying Breakouts | False Breakouts |
|
|
Application IV: Sentiment Analysis with Open Interest
Combining sentiment analysis tools with open interest data provides a more comprehensive view of market emotions and potential directional biases. To gauge the market’s mood, you can use sentiment indicators (such as the Commitment of Traders (COT) report) alongside open interest.
Furthermore, extreme levels of open interest sometimes act as contrarian signals. For example,
- Very high open interest indicates overbought conditions.
- Contrarily, very low open interest suggests oversold conditions.
How to Implement Open Interest Data in Daily Trading
To effectively use open interest data in daily trading, you must combine it with other technical indicators. This combined usage will help you refine entry and exit points. Let’s have a look at some strategies for incorporating open interest data into your trading routine:
Strategy I: Combining Open Interest with Moving Averages
In this strategy, you have to use moving averages in conjunction with open interest data. This will help you:
- Confirm trends
and
- Identify potential reversals.
Let’s study the two most probable scenarios:
| Parameters | Rising Open Interest and Price Above Moving Average | Rising Open Interest but Price Below Moving Average |
| Scenario | When open interest is rising and the price is above a key moving average (e.g., 50-day or 200-day MA), it suggests a strong upward trend. | If open interest is increasing but the price falls below the moving average, it indicates that the trend is losing strength and could reverse. |
| Action |
|
but
|
For example:
- Assume that the price of the E-mini S&P 500 (ES) futures contract is above its 50-day moving average.
- Also, the open interest is rising steadily.
- This activity confirms a strong bullish trend.
- A trader enters a long position and expects the uptrend to continue.
- Conversely,
- A weakening trend is signaled if:
- The price drops below the 50-day moving average
- A weakening trend is signaled if:
and
- Open interest continues to rise.
- In this situation, the trader set a stop-loss order or considered shorting the market.
Strategy II: Combining Open Interest with Volume
In this strategy, you have to use volume data alongside open interest. This will help you confirm:
- Market sentiment
and
- Its strength.
Below are the two most common scenarios:
| Parameters | High Volume and Increasing Open Interest | Low Volume and Increasing Open Interest |
| Scenario | High volume coupled with rising open interest generally indicates strong participation in the current trend. | Increasing open interest with low volume indicates a stealth build-up of positions. |
| Action | Enter positions in the direction of the trend. That’s because this combination suggests robust support. | Be cautious! The low volume suggests that the trend is not widely supported. Always look for additional confirmation from other indicators before making a move. |
For example:
- Assume that the ES futures contract shows a sharp increase in volume.
- Also, there is rising open interest during an uptrend.
- This situation indicates strong bullish sentiment and robust market participation.
- A trader can confidently enter a long position.
- Conversely,
- Say the volume is low, but open interest increases
- In this case, the trader should be cautious and look for further confirmation before acting.
Strategy III: Combining Open Interest with Relative Strength Index (RSI)
In this strategy, you have to use RSI in conjunction with open-interest data. This will help you identify overbought or oversold conditions. Read the two most common scenarios:
| Parameters | Increasing Open Interest and RSI in Overbought Territory | Increasing Open Interest and RSI in Oversold Territory |
| Scenario | If open interest is rising and the RSI is above 70, it indicates that the market is overbought. | If open interest is rising and the RSI is below 30, it suggests that the market is oversold. |
| Action | Consider taking profits or setting tight stop-loss orders to protect against potential reversals | Look for potential buying opportunities, as the market might be poised for a rebound. |
For Example:
- The ES futures contract has an RSI of 75 (overbought) and rising open interest.
- While the trend is strong, the overbought RSI suggests a potential pullback.
- A trader can take profits or set stop-loss orders.
- Conversely,
- Say the RSI is 25 (oversold) with rising open interest.
- Now, traders can look for a reversal opportunity to enter long positions.
Conclusion
Open interest is a valuable tool for enhancing futures trading strategies. By analyzing open interest alongside price movements and other technical indicators like moving averages and volume, traders can confirm market trends, anticipate reversals, and distinguish between speculative trading and hedging.
Also, rising open interest with rising prices often indicates a strong trend, while falling open interest with rising prices signals a weakening trend. When traders combine open interest with sentiment analysis, they can precisely gauge market emotions.
Thus, by incorporating open interest analysis into your trading toolkit, you can predict market movements and manage risks effectively. For more on futures trading strategies and risk management, check out this article on Day Trading Futures.
FAQ
What is open interest in futures trading and how is it different from volume?
Open interest represents the total number of active, unsettled contracts, while volume measures the number of contracts traded during a specific period. Open interest shows market participation and trend strength, whereas volume reflects trading activity on a particular day.
How can rising or falling open interest help traders understand market strength?
Rising open interest with rising prices suggests a strong, sustainable trend supported by new money entering the market. Falling open interest, even if prices are rising, often signals weakening momentum or short covering, hinting at a possible trend reversal.
How can traders use open interest to confirm breakouts or reversals?
Traders watch for sudden spikes in open interest combined with strong price moves to confirm breakout opportunities. Conversely, a drop in open interest during a price rise or fall can warn of a weakening trend and signal a potential reversal.
Why combine open interest with indicators like volume or RSI in trading?
Combining open interest with volume or RSI improves the accuracy of trading signals. High volume and rising open interest confirm strong trends, while RSI highlights overbought or oversold conditions, helping traders better time entries and exits.
Sign Up Now