
Is PlanB’s Stock to Flow Model Broken?
Written By: Owain Higham
The anonymous crypto personality known as PlanB on Twitter faces some criticism as his mathematical model that managed to accurately predict BTCUSD’s price trajectory for nearly 3 years now misses its target by over $41,000.
What Is PlanB’s Stock-to-Flow Model?
The Stock-to-Flow model attempts to predict the price of Bitcoin based on its scarcity. It’s a commonly advertised fact that there will only ever exist 21 million coins on the Bitcoin blockchain, and putting aside complexities such as forks for now, this means that Bitcoin is a deflationary currency.
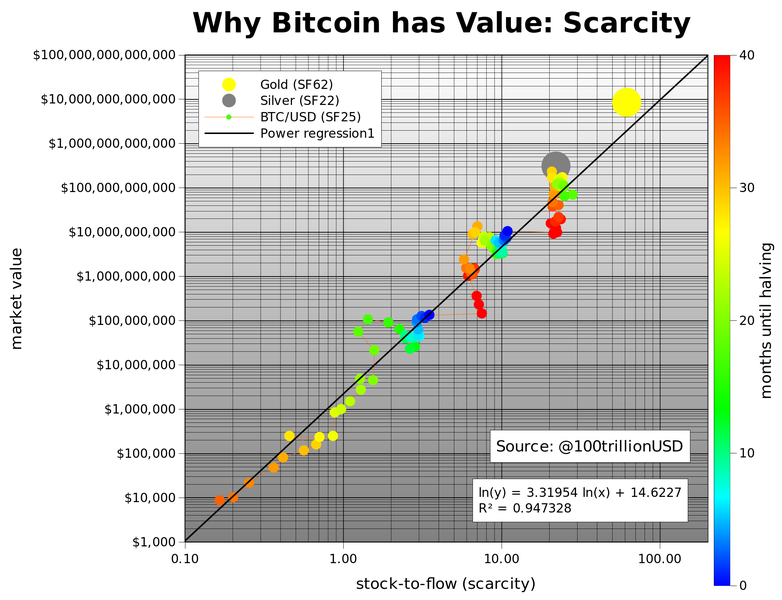
PlanB’s Stock-to-Flow model.
Since the coins are released at a predictable rate, this has made PlanB’s model fairly accurate.
Until now.
The model predicted a close of at least $98k (his worst-case scenario), however the month of October closed at $57k.
Critics of the model often point to the lack of any calculations for demand in the equation, although demand is a given for BTC proponents, with PlanB himself referring to an imminent “wave of liquidity”.
What Happened in November?
Despite BTC often being touted as an escape from central bank policy, ultimately it can still be highly influenced by central bank decisions. More specifically, by the decisions of the Federal Reserve, one of the most important central banks and the other side of the BTCUSD pair.
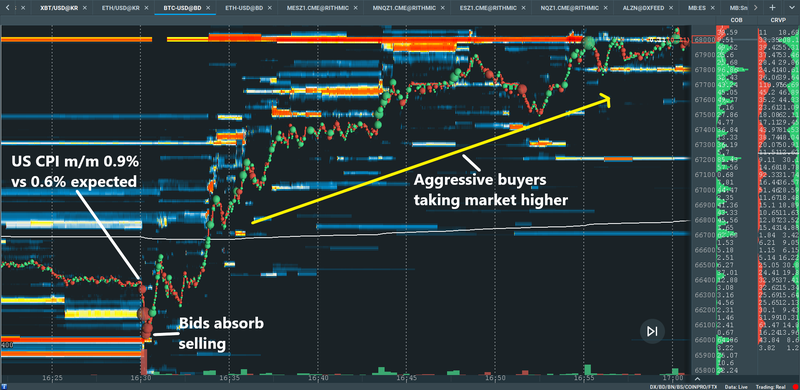
BTCUSD’s reaction to US m/m CPI data.
On the 10th of October this year, US CPI (month over month inflation) came in hotter than expected. This signaled to the market that the Federal Reserve may be forced to raise rates sooner than anticipated, which generally is negative for risk assets.
But for BTC, it looked as if the virtual currency was acting as an inflation hedge. Almost immediately after the data was released, huge bids at $66,000 absorbed large sellers and the pair went on to make all time highs within an hour.
However, ultimately this price level turned out to be the high of the month. The pair ended up trading down to as low as $53.3k before the end of the month, a drop of over 10%.
Will BTCUSD Make New All Time Highs?
It is impossible to make accurate long-term predictions, and order flow trading isn’t really about that. But taking a look at the bigger picture on the heatmap may lead to some clues as what is next in store for BTCUSD.
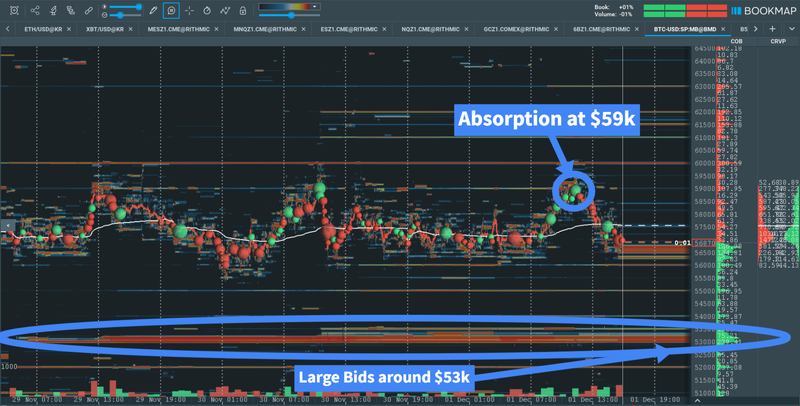
Current picture of BTCUSD order flow.
As we can see on the Bookmap heatmap above, current prices are trading below the VWAP (Volume-Weighted Average Price), after offers @ $59k absorbed larger buyers earlier in the day. Those offers were fully consumed, and now the current large offers sit at $60,000. There are more at $61.5k and $62k.
$55,000 sees some Bids forming, but the next largest level is $53,000. This latter level is also a swing low – the low of November. Whether this level breaks and leads to heavy selling or absorption all depends on the order flow at that moment.
To watch how it unfolds for yourself, download Bookmap for free today (if you haven’t already)!
Disclaimer: This content is for informational purposes only and is not trading advice.
 Twitter
 Facebook