See liquidity tracker pro more clearly in real time.
Compare plans to access deeper market visibility for liquidity tracker pro.
Education
June 3, 2025
SHARE
Liquidity Tracker Pro: See What’s Really Driving Price
Liquidity isn’t just background noise in the market—it’s often the leading force behind price movement. Whether you’re scalping futures or tracking swing setups, understanding how and where liquidity shifts can offer critical clues about market intent.
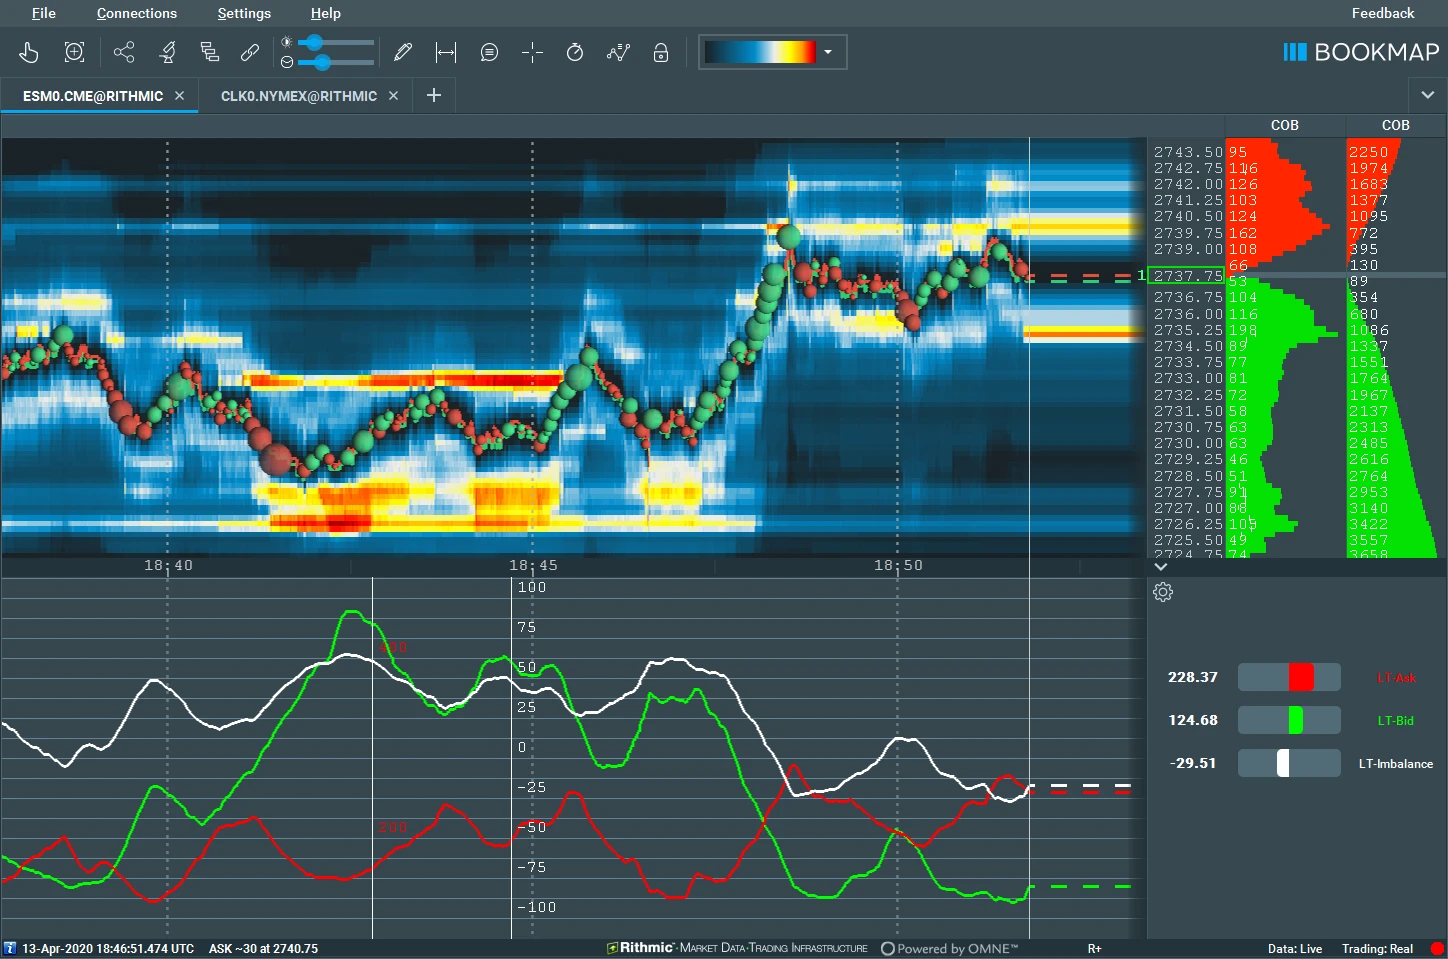
Liquidity Tracker Pro is designed to make these dynamics visible in real time. By tracking resting orders and changes in the order book, this tool reveals where large players may be adding, pulling, or defending liquidity—and how that shapes the next move.
Why Liquidity Matters More Than Most Traders Realize
At its core, price moves where there is the least resistance. That resistance—or lack of it—is shaped by liquidity. When a large concentration of resting orders is pulled, price can jump through a level. When liquidity is added in real time, it can cap a move or signal absorption.
Without proper liquidity tracking, you’re trading blind to this behavior. You may enter a breakout just as resting sell orders pile in—or fade a move just before passive buyers step in to support it.
Understanding liquidity is essential for:
- Timing entries and exits more accurately
- Recognizing spoofing or fake liquidity
- Identifying key zones of interest where institutions act
But most platforms only show static snapshots. Liquidity Tracker Pro lets you see how it evolves.
What Liquidity Tracker Pro Does
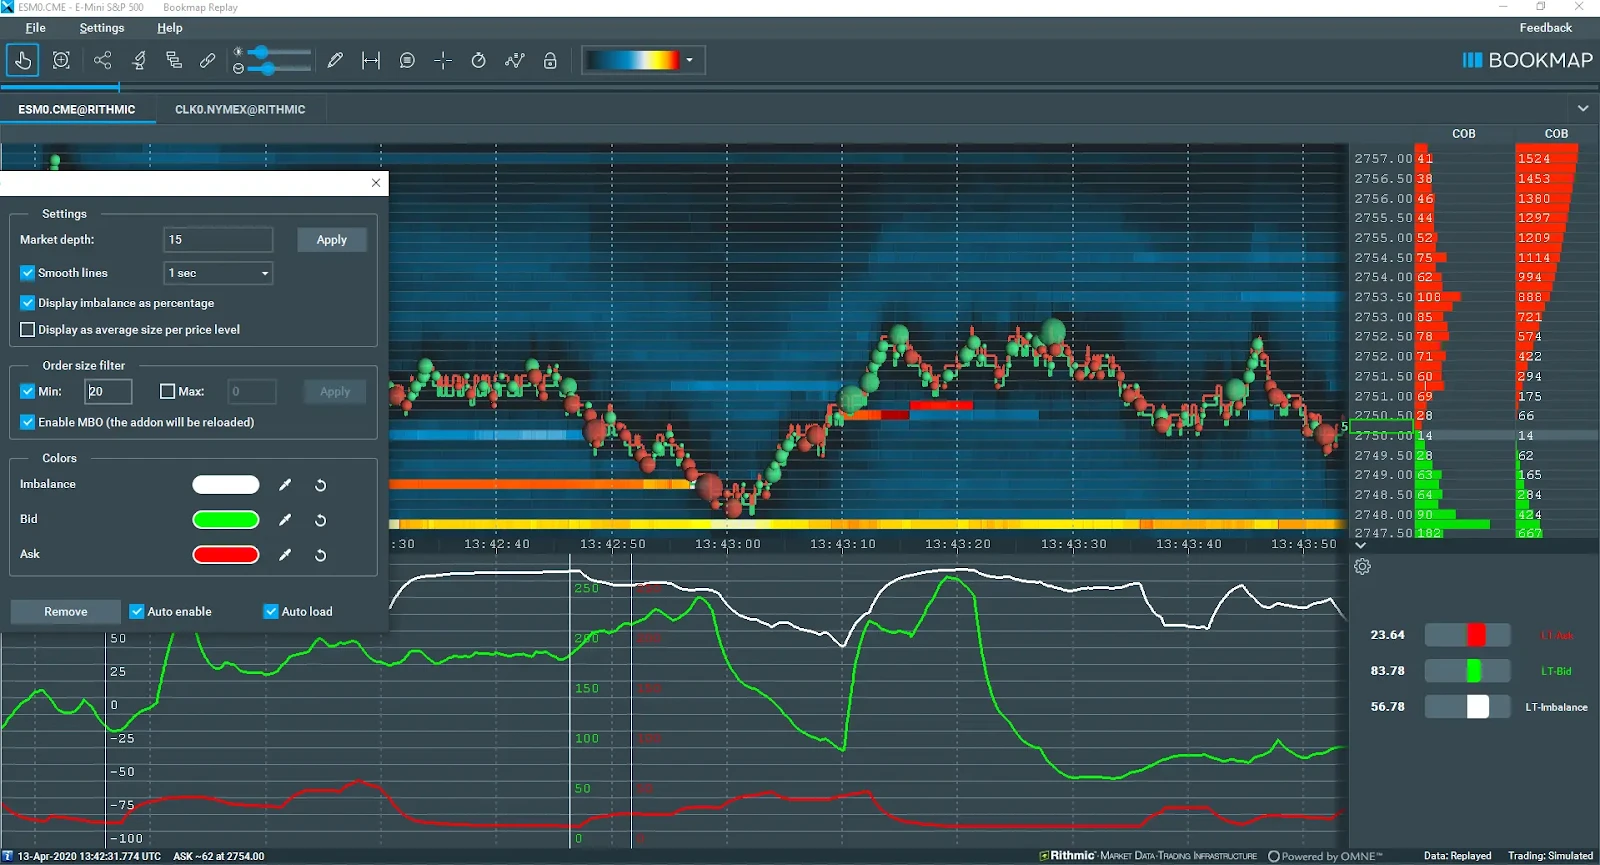
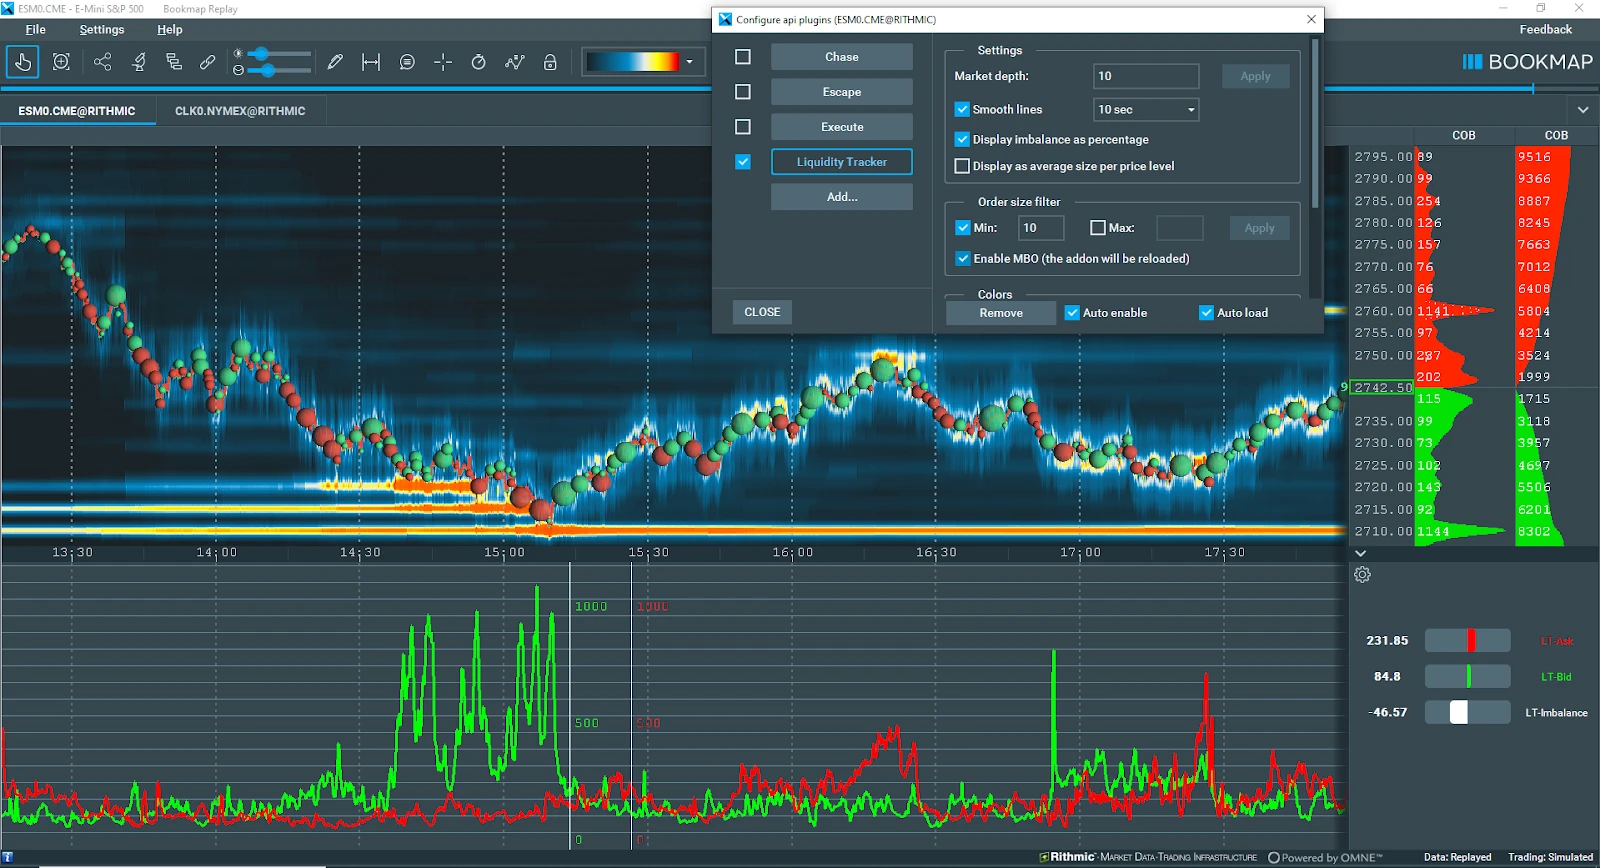
This add-on analyzes Market-by-Order (MBO) data to track changes in the order book. Unlike the standard heatmap, which displays resting liquidity at a moment in time, Liquidity Tracker Pro measures:
- Order Book Additions: where passive liquidity is being added
- Order Pulling/Cancelations: where liquidity is being removed
- Layered Behavior: how deep in the book activity is stacking
It plots these changes as a dynamic sub-chart, giving traders real-time insight into the evolving structure behind price.
For setup instructions and parameters, visit the Knowledge Base article.
How to Interpret Liquidity Shifts
Let’s break down a few ways traders read the signals:
Liquidity Pulling Before Breakouts
Before a key breakout, Liquidity Tracker Pro may show a sharp reduction in resting sell orders just above the current price. This suggests a vacuum forming—no one wants to stand in the way of a move higher. Price often accelerates into this gap.
Passive Liquidity Stacking
If large buy orders are being added repeatedly below price, this may indicate absorption. Sellers are being met with strong passive interest, and if price holds or grinds upward, it’s often the start of a controlled accumulation phase.
Spoofing Detection
Seeing large orders appear and quickly disappear repeatedly? Liquidity Tracker Pro flags this with clear cancelation spikes. This behavior may be an attempt to manipulate price perception—and gives savvy traders a chance to wait it out or trade against the bluff.
Pairing with Other MBO Tools
Liquidity Tracker Pro shines when used alongside:
- Stops & Icebergs: See if stop runs or hidden absorption align with liquidity shifts
- Tradermap Pro: Filter the heatmap to show only meaningful liquidity changes by order size
The combination offers a more complete view of true market structure—not just price, but intent.
What You’ll Need
To use Liquidity Tracker Pro, you’ll need:
- A Bookmap Global or Global+ license
- An MBO-compatible data feed such as BookmapData CME or Rithmic
You can get the add-on directly through the Bookmap Marketplace.
Conclusion
Price action can lie. Liquidity tells the truth.
Liquidity Tracker Pro gives traders a window into how the order book really shifts around key moments—revealing not just where orders sit, but why they’re moving.
It’s not about predicting the future. It’s about seeing the path of least resistance as it forms—live, in the moment.
Learn more about Liquidity Tracker Pro, or explore the full Knowledge Base guide to get started.
Sign Up Now