See data more clearly in real time.
Compare plans to access deeper market visibility for data.
Education
December 4, 2024
SHARE
Market Data Aggregation: Pros, Cons, and Its Role in Visualization
How do the big bulls make money? They make strategic use of real-time
visualizations. These visuals serve as their compass, guiding investment
decisions, and helping them identify anomalies in the market. Market data
aggregation is the key ingredient behind these capabilities.
Using it, you can swiftly detect opportunities and mitigate risks. It’s more
than just collecting numbers; it’s about making those numbers work for you.
By reading this, you will discover how this data-driven technology is
shaping the trading world and why it’s a game-changer for traders
everywhere. Let’s delve deeper.
Understanding Market Data Aggregation
Market data aggregation is a fundamental process that involves collecting
and summarizing various types of financial information obtained from
multiple sources. The primary goal is to provide a comprehensive overview of
the markets so that traders can gain insights into market trends.
Definition and Core Principles
To illustrate this concept, consider the analogy of a consolidated bank
statement:
Imagine you hold multiple bank accounts, each with its transactions and
balances. To gain a comprehensive financial overview, you need to aggregate
the data from all your accounts into a single statement. This consolidated
statement allows you to see your total assets, liabilities, and transactions
in one place. Such an aggregation of data makes it easier for you to
understand your financial situation.
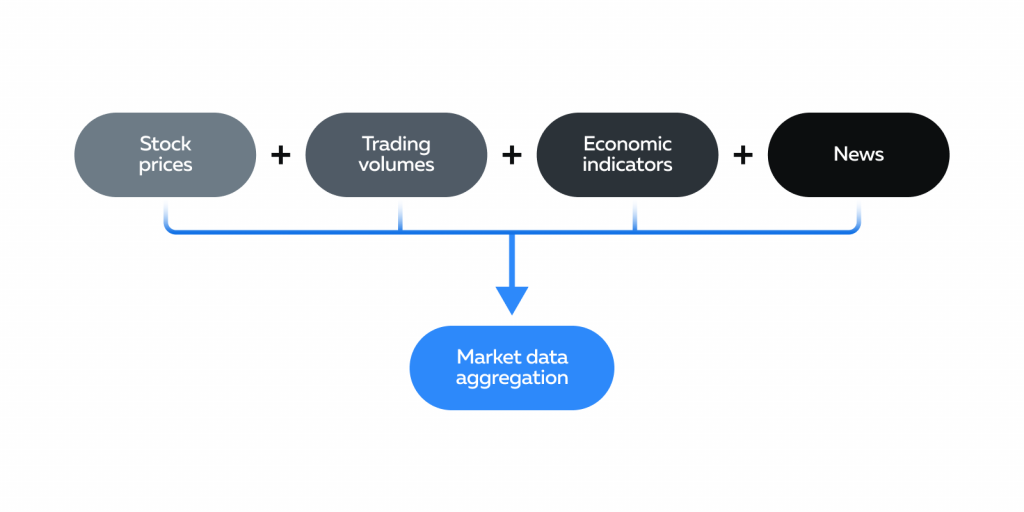
In the world of finance, market data aggregation works similarly. Financial
markets produce a vast amount of data, such as:
-
Stock prices
-
Trading volumes
-
News
-
Economic indicators, and many more.
Market aggregation tools gather, process, and display this information in a
consolidated format.
Historical Perspective: From Manual to Digital
Market data aggregation has come a long way. In the early days of financial
markets:
-
Traders and investors had to manually record and track market data.
-
They used handwritten ledgers and relied on printed newspapers and
reports to stay informed about:-
Stock prices
-
Company news, and
-
Economic data.
-
This method was time-consuming and prone to errors.
What Led To Digitization?
The advent of electronic trading in the late 20th century marked a
significant shift. Traders transitioned from physical trading floors to
computer screens. This transition brought the need for faster and more
efficient ways to access and process market data. Real-time data has become
crucial for making timely decisions in the fast-paced world of electronic
trading.
How Electronic Trading Accelerated The Shift
As electronic trading gained popularity, the need for automation and data
aggregation tools became evident. Financial institutions and traders started
using computerized systems to collect and process data from various sources.
These systems provided real-time market information and allowed for
automated trading strategies.
Additionally, the emergence of
High-Frequency Trading
(HFT), a strategy that relies on executing a large number of trades in very
short timeframes, further emphasized the importance of real-time data
aggregation.
The Many Upsides of Market Data Aggregation
Market data aggregation offers numerous advantages for traders and
investors. Let’s explore some of the key benefits:
A Bird’s-Eye View of the Market
Market data aggregation is like viewing a city from a plane. It provides
traders and investors with a comprehensive perspective of the financial
landscape. Market data aggregation enables you to access a wealth of
financial information from various sources in one place.
This broad view aids in strategy formulation in several ways:
|
The Benefits |
The Meaning |
How It Helps Traders |
|
Understand macrotrends |
Aggregation tools allow traders to see broader market
|
It helps in aligning strategies with the overall market |
|
Perform diversification |
Traders can easily monitor multiple assets in a single |
It helps in optimizing portfolios and managing risk. |
|
Better risk assessment |
By aggregating data on various financial instruments, |
It helps in |
Swift Decisions in Split Seconds
You’re a day trader and see breaking news about a major acquisition that
could impact a company’s stock price. In this situation, quick data access
can make all the difference.
Market data aggregation enhances reaction times by providing:
-
Instant real-time updates of significant market events.
-
Automated trigger alerts based on specific criteria. For instance, a
trader can receive an alert when a stock’s price moves by a certain
percentage. -
Quick execution of buy or sell orders.
Precision-Driven Trades
Aggregation tools offer in-depth analysis capabilities, including;
-
Historical data
-
Technical indicators, and
-
Sentiment analysis
This helps traders in:
-
Basing their decisions on well-founded insights rather than gut
feelings -
Backtesting
and refining their strategies -
Assessing and managing risks more effectively
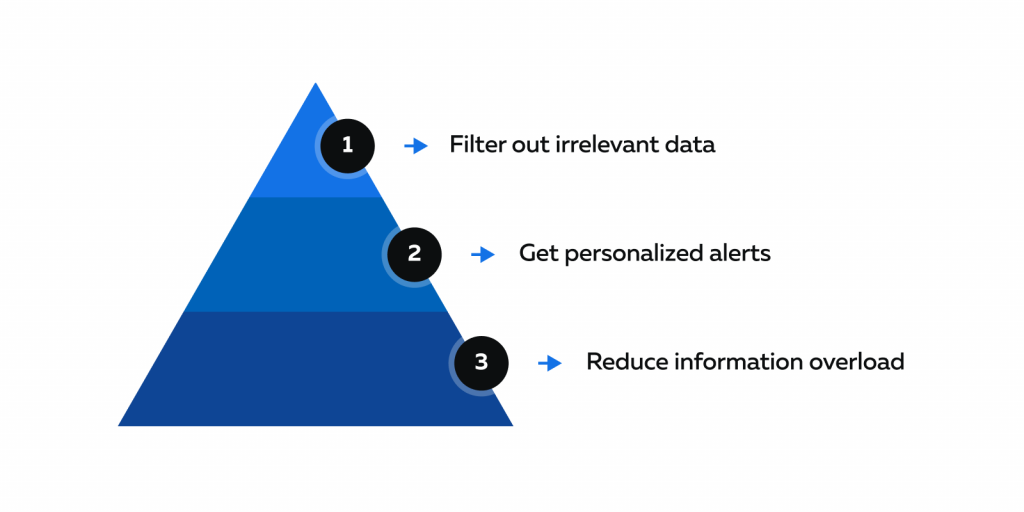
Custom Tailored Datastreams
Aggregation tools often come with a ‘filter’ feature that allows traders to
customize their data views based on their specific needs and strategies.
This customization offers several advantages:
-
See data that matters to you
-
Traders can filter out irrelevant data.
-
For example, a forex trader can filter economic indicators and
news specific to the currency pairs they are trading.
-
-
Personalized alerts:
-
The customization feature also extends to alert settings.
-
These settings enable traders to receive notifications only for
events or price movements that align with their trading
objectives.
-
-
Reduce information overload:
-
By tailoring their data streams, traders can increase efficiency
and reduce information overload. -
This customization makes it easier to spot the most critical
data points.
-
The Inherent Challenges of Market Data Aggregation
Market data aggregation is undoubtedly a valuable tool. However, it comes
with its share of challenges. Let’s understand some common ones:
A) Drowning in a Sea of Data
With a constant influx of information from various sources, traders can
become overwhelmed by the sheer volume of data available. This situation can
create a paradox where more data doesn’t always translate to better clarity.
Too much data can:
-
Lead to analysis paralysis
-
Distract traders from their primary objectives and trading
strategies -
Lead to cognitive biases
However, there are solutions, such as:
-
Implement prioritized filtering to focus on key data points and
reduce noise. -
Utilize data visualization tools to condense and represent data in a
more digestible manner. -
Set customized alerts to notify of significant market changes,
preventing constant manual sifting.
B) Navigating the Minefield of Data Integrity
Data integrity is critical, as acting on faulty or inaccurate data can have
severe consequences.
Consider this hypothetical scenario:
-
A trader receives inaccurate financial statements for a company
they’re interested in investing in. -
Acting on this information, they invest a significant sum, only to
discover that the data was erroneous. -
This can lead to substantial financial losses.
How Can Traders Ensure Data Reliability and Accuracy?
-
Double-check the credibility of the data sources.
-
Always use reliable and reputable sources, as they are less likely
to provide erroneous information. -
Compare data from multiple sources to identify inconsistencies or
outliers. -
Ensure that data is up-to-date, as outdated information can be as
detrimental as inaccurate data.
C) Balancing Cost and Value
Market data aggregation tools are expensive. In most cases, you will be
paying the following:
-
Subscription Costs:
-
Many premium data sources charge subscription fees, which can be
a significant financial burden, especially for smaller traders.
-
-
Hardware and Software Expenses:
-
Maintaining the necessary hardware and software for data
aggregation can be costly. -
The need for robust computing power and real-time data feeds can
strain budgets.
-
Note: Traders must perform a cost-benefit analysis to determine whether the
advantages of data aggregation, such as faster decision-making and better
analysis, outweigh the expenses involved.
D) Staying within the Regulatory Lines
The regulatory landscape for financial markets undergoes constant
transformation. Regulators now place heightened emphasis on transparency to
maintain equitable and trustworthy markets. Furthermore, stringent data
protection regulations, including GDPR and CCPA, have elevated the standards
for safeguarding sensitive financial information.
How Can You Remain Compliant?
-
Ensure that your data aggregation practices comply with the latest
rules. -
Navigate various regulatory regimes, in case of cross-border trades.
-
Stay agile and responsive to legal and regulatory changes to avert
potential legal complications.
Making Aggregated Data Visual and Intuitive

Visualizing aggregated data is a powerful way to make sense of complex data.
When it comes to trading, transforming complex datasets into visual
narratives can greatly aid in understanding the market. Let’s understand how
visual elements can help you:
A) Translating Data into Visual Stories
Our brains are wired to process visual information with remarkable speed and
efficiency. Visual elements, such as charts, graphs, and heatmaps, prove to
be more effective in conveying information compared to raw data. They
stimulate both the analytical and creative faculties of the brain,
simplifying the absorption and interpretation of data for traders.
How Do Heatmaps Help?
-
Heatmaps, in particular, serve as a powerful tool for translating
data into visual representations. -
They use color-coding to represent data points, which makes it easy
to identify patterns and trends. -
For instance, a heatmap of stock prices can quickly show:
-
Which stocks are performing well (in green) and
-
Which are underperforming (in red)
-
Additionally, traders can also
customize heatmaps
to align with their specific needs and preferences. This tailoring ensures
that the information presented is relevant to their trading strategies.
B) The Power of Real-time Visual Monitoring
Real-time visualizations allow traders to instantaneously comprehend the
market’s current dynamics, facilitating the swift identification of
opportunities. Let’s understand some advantages of visualizing live data:
-
Immediate Market Insights: Real-time visualizations offer traders
immediate and clear insights into prevailing market conditions. -
Enhanced Pattern Recognition: Visual representations highlight
patterns, trends, and anomalies that might not be as apparent in
numerical data. For example, candlestick charts can reveal price
patterns, while volume charts show trading activity. -
Objective Decision-Making: Visuals provide traders with a clear and
objective view of the market. This can reduce
impulsive decision-making
driven by fear or greed.
C) Detecting the Unusual in the Usual
Visual anomalies in aggregated data can hint at market opportunities or
threats. Here are some tips on how to spot and act on these visual cues:
|
Visual Cue |
How to spot it? |
What do they signal? |
|
Contrasting Colors on a Heatmap |
Look for areas with stark color contrasts. |
These areas signal significant price movements or shifts
|
|
Volume Spikes |
Look for a sudden spike in trading volume, represented |
It signals:
|
|
Breakouts from Trendlines |
Look for price breaking out from a trendline.
|
It signals a change in the established trend. |
|
Irregular Patterns |
Look for unusual patterns on charts, such as:
|
It signals potential reversals or continuations in price |
Conclusion
Market data aggregation has transformed modern trading by changing the way
traders and investors access, analyze, and utilize financial information. It
offers a comprehensive view of the market, enabling traders to monitor
multiple asset classes effectively.
The customization and visualization features of aggregation tools have made
data more accessible and intuitive, enhancing the decision-making process.
While market data aggregation offers numerous advantages, it is not without
its challenges. Some common limitations include data overload, the critical
need for data integrity, and cost considerations.
Nonetheless, it remains an indispensable component of modern trading and
helps traders in numerous ways. Are you eager to explore more on market data
aggregation and its impact on visualization?
Begin your journey and gain access to a platform optimized for in-depth
market insights.
Experience Bookmap’s market data aggregation capabilities now
.
Sign Up Now