See stop run more clearly in real time.
Compare plans to access deeper market visibility for stop run.
Trading Basics
August 8, 2025
SHARE
Running the Stops: How It Happens—and How to Trade the Aftermath

In trading, your stop-loss is like your parachute. Just make sure it doesn’t open at the worst possible moment! Ever wondered why the price seems to hit your stop and then go in your direction? You may have just been caught in a stop run!
Want to avoid this trap? In this article, you’ll learn exactly what running the stops trading means, how to spot stop runs in futures, and the difference between stop hunting vs stop run. More importantly, you’ll understand how to trade stop runs smartly – by waiting for structure, watching for absorption, and avoiding the trap.
Read this article till the end to stop being the hunted. Instead, start trading with the hunters!
What Does “Running the Stops” Actually Mean?
Most traders place stop-loss orders (automatic exits) just below or above key levels like:
- Previous highs/ lows,
- VWAP, and
- Round numbers.
These areas are like tripwires! When the price hits them, it triggers a wave of automatic selling or buying. This sudden surge is what we call a stop run.
So, “running the stops” in trading means intentionally pushing the price through these levels to trigger those stop-loss orders. It’s not about starting a new trend. Instead, it’s about:
- Flushing out weaker traders
and
This temporary volatility allows larger players (institutions, pros) to get in at better prices without much resistance. However, please note that a stop run is just an event (like a spark). What really matters is what happens after! Let’s have a look at some post-stop-run reactions you must observe:
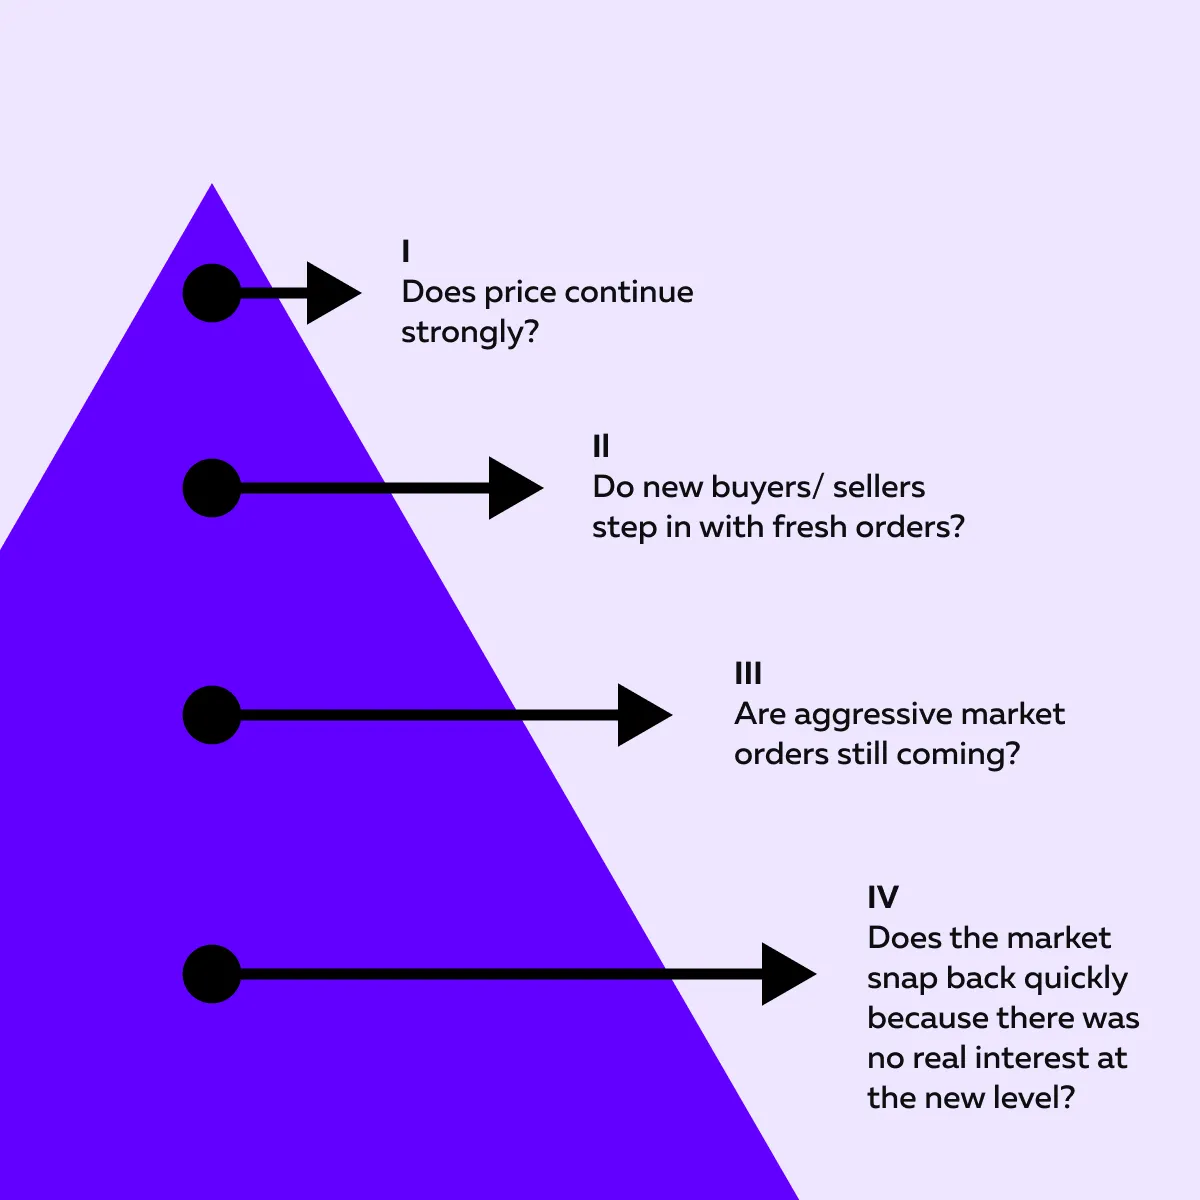
By observing these post-stop-run reactions, you can find real trading clues. So, if you want to learn how to trade stop runs, don’t focus just on the stop run itself. Focus on what the price does after the run. That’s where the edge lies!
Key Signs of a Stop Run in Real-Time
When you’re watching the market in real-time:
- Some moves are just noise
while
Thus, as a trader, you must recognize the signs that stops are being triggered. Let’s check out the three popular signs you can consider:
1. Sudden Spike Through a Known Level
One of the clearest signs of a stop run in futures trading is when the price suddenly bursts through an obvious level (like a prior high or low) by just a few ticks.
These levels are stop magnets. Many traders place their stop-loss orders just beyond these areas. So, when the price crosses them even slightly, it triggers a chain reaction of stops getting hit.
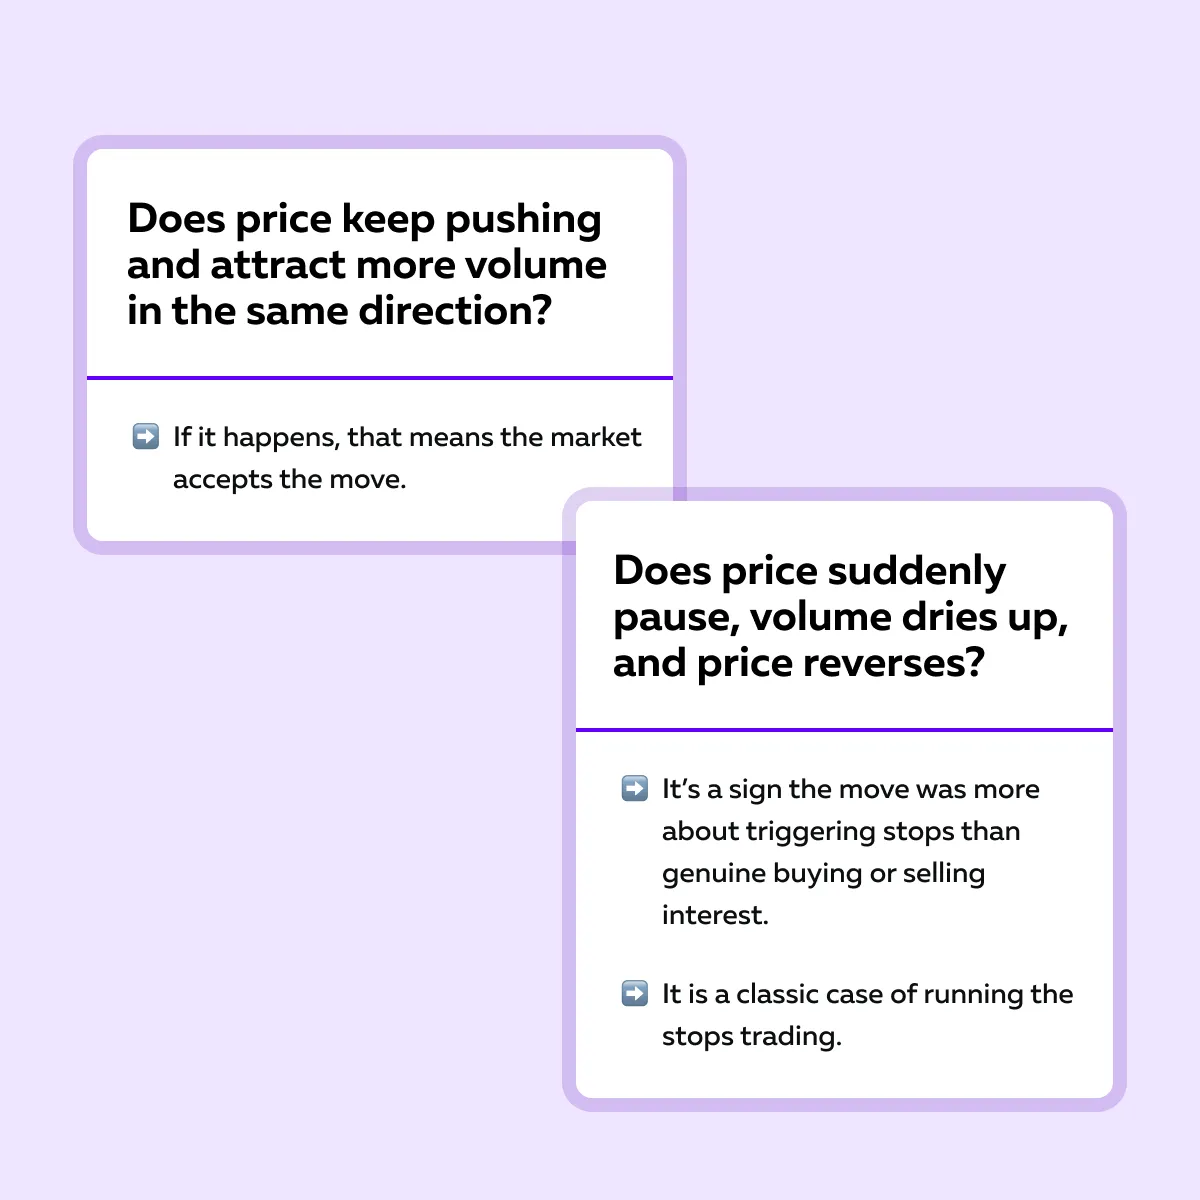
But Here’s the Twist!
Just because the price broke the level doesn’t mean a trend is starting. What really matters is how the market responds after that surge. Observe the following:
For more clarity, let’s study an example:
- Suppose NQ (Nasdaq futures) breaks the premarket low by 4 ticks.
- With Bookmap, you observe a sudden burst of red volume (indicating lots of selling).
- But instead of continuing lower, the price stalls.
- Later, it snaps back up.
- That’s a likely stop run followed by absorption.
- This shows big buyers are stepping in to buy the selloff.
So, the next time you see a quick break of a well-watched level, don’t chase it immediately! Watch how the price behaves next.
2. Thin Liquidity at the Break
Before a stop run happens, you’ll often notice the liquidity starts to disappear right around the key level (like a prior high/ low). Let’s understand what that means:
- The order book looks “thinner” near the level.
and
- Big resting orders (visible bids or offers) pull away or cancel.
Both these events create a gap or soft spot in the book! This makes it easier for the price to jump quickly through the level and hit stop-loss clusters with little resistance.
A Strong Visual Clue for Traders Using Bookmap
On Bookmap, our advanced real-time market analysis tool, you can observe the heatmap. In such a situation, heatmap zones (those bright-colored bands showing limit orders) fade just before the spike.
That fading tells you liquidity is vanishing! It is a classic sign before a stop run. Keep in mind that such a setup gives large traders a clean shot to push prices into stop zones. By doing so, they can trigger “running the stops” trading with minimal effort.
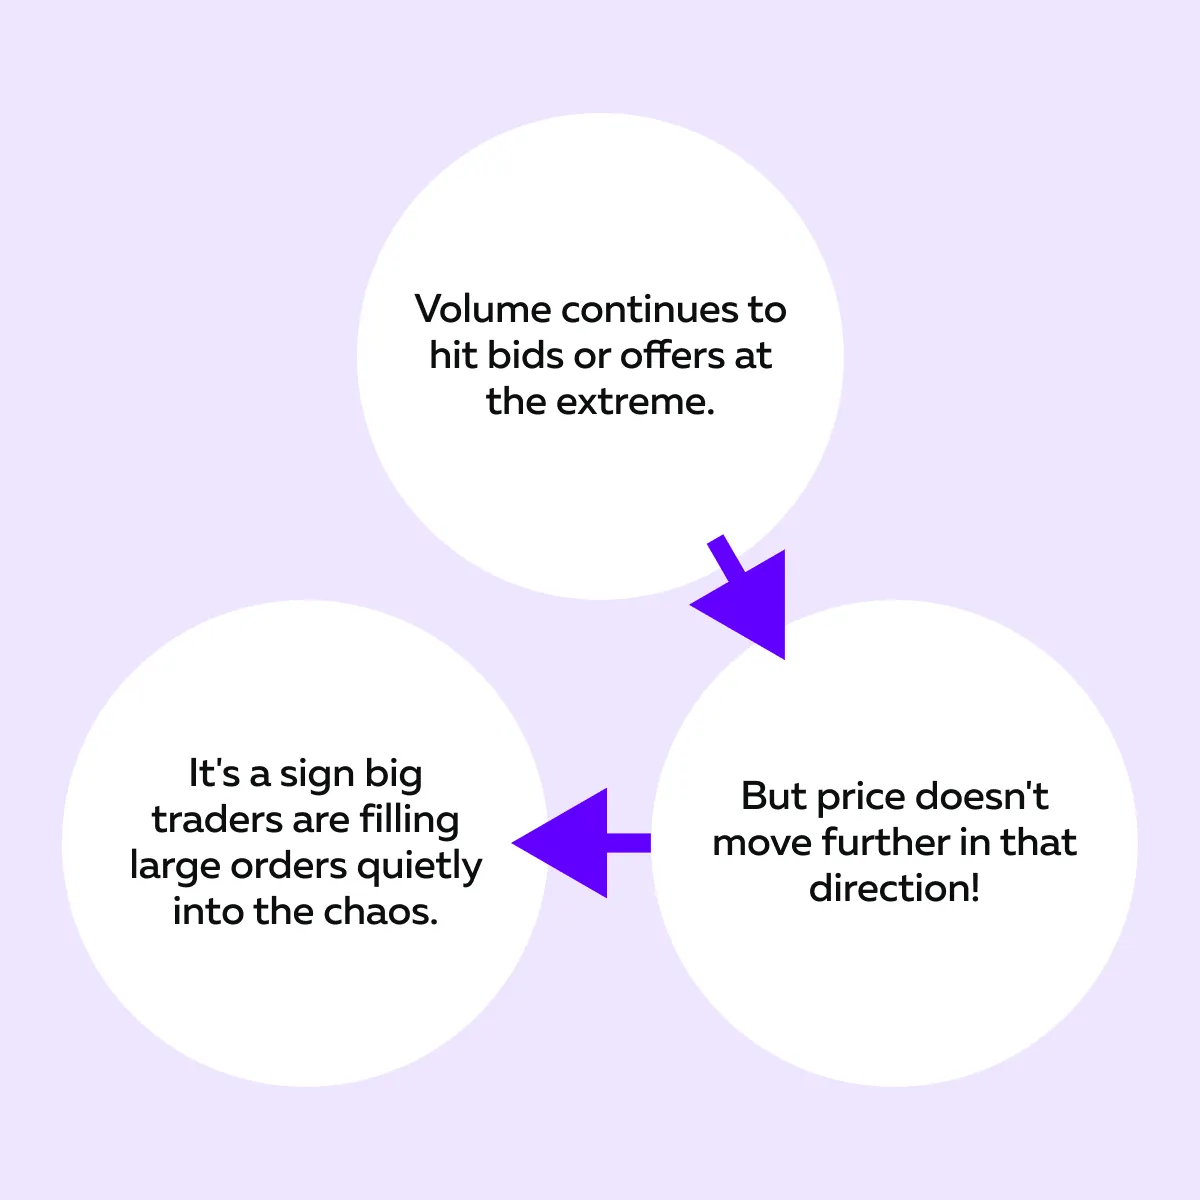
3. Absorption After the Spike
Now comes the key moment – What happens after the spike?
Once the stop orders are triggered and the price has pushed through the level, you’ll often see it pause or hesitate. It may even reverse sharply! This tells you that larger players are absorbing the stop flow. They are taking the other side of all that panic selling or buying.
Want to spot it? Learn what you should observe:
A Strong Visual Clue for Traders Using Bookmap
Look for large volume dots on our tool, Bookmap, at the turning point. In particular, check out when there’s no follow-through after the spike. That’s strong evidence of absorption! It means someone big was waiting to scoop up those stop orders.
Don’t chase fake breakouts—trade with the large players after the stops are run. → Compare Plans
Common Places Stop Runs Happen
Stop runs don’t happen randomly. They tend to occur at well-known price levels—like swing highs, lows, or round numbers—where stop-losses cluster. These areas attract larger players who use that liquidity to execute sizable orders.
By knowing where these traps are, you can avoid them or even profit from them. Let’s become aware of these common places:
1. Prior Day Highs & Lows
These are classic hunting grounds! Why? Because a lot of traders use the previous day’s high or low to:
- Set their stop-losses
or
- Breakout entries.
That makes these levels highly “crowded.” Let’s check out the graphic below to learn what often happens:
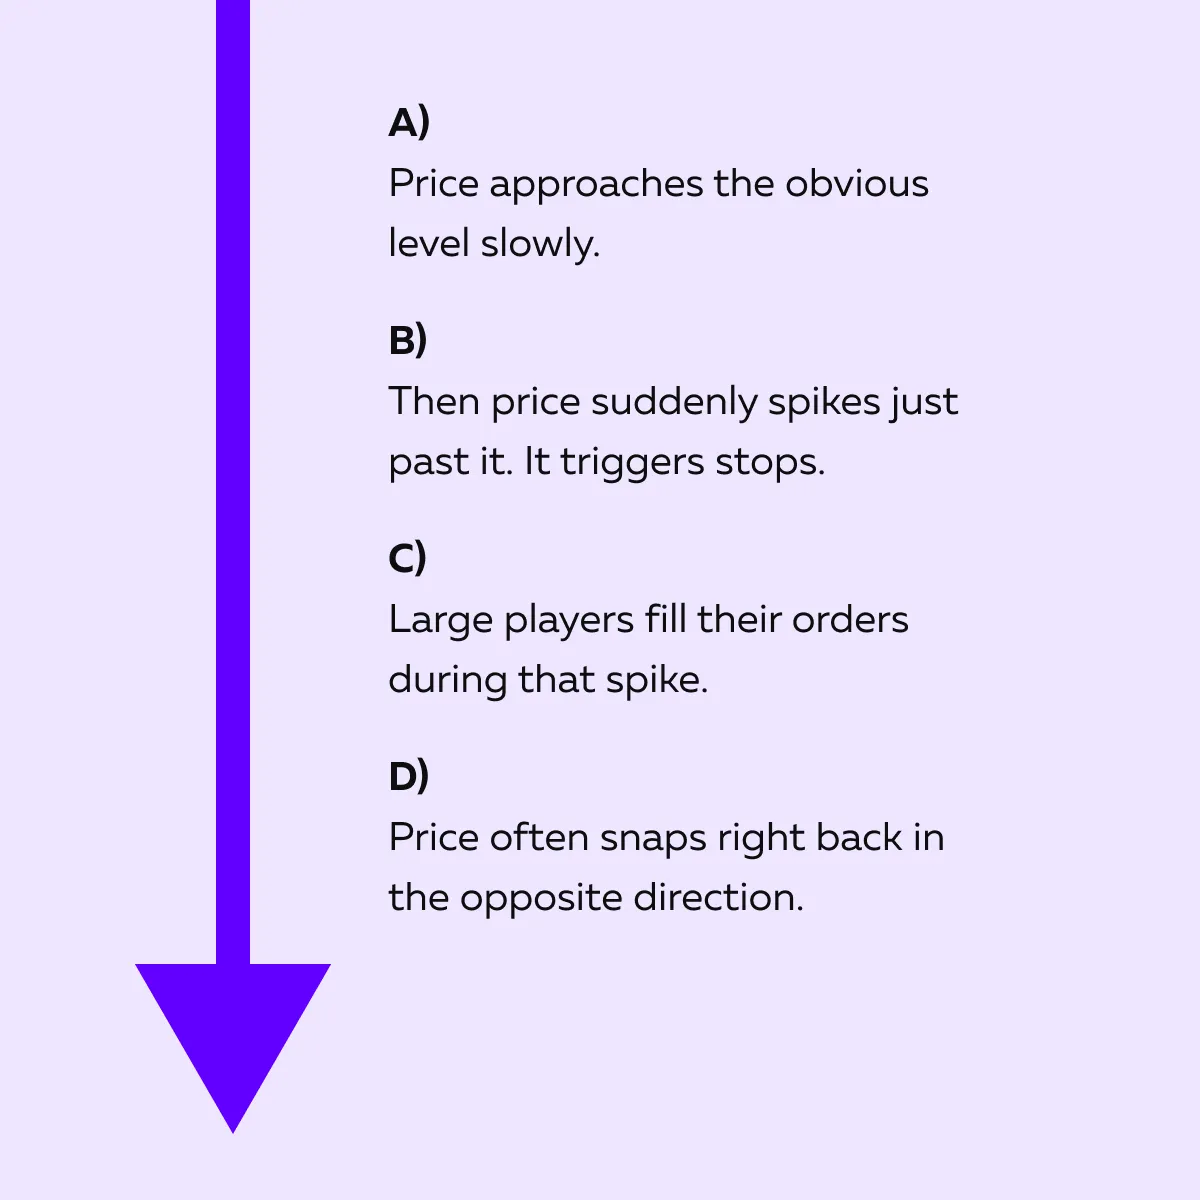
This is one of the most common patterns in running the stops trading! Please realize that it’s all about clearing out weak hands before the real move begins.
2. Round Numbers / Psychological Levels
These are big and clean price levels, like:
- ES 4300,
- BTC 70,000, and
- NQ 15000.
Traders naturally cluster orders around these levels! Most retail traders place stops just beyond them. And institutions know this. Thus, they often push the price through by a few ticks.
After the stops get taken out, the price reverses sharply. What looks like a breakout is often nothing more than a stop run, driven by the need to access liquidity around a key psychological barrier.
3. VWAP and Key Session Levels
The VWAP (Volume Weighted Average Price) and other intraday markers (like open/high/low of the session) are magnet levels for stop placement.
Let’s understand why:
- Many day traders use VWAP as a guide to trend bias.
- Stops build up just outside the:
- VWAP zone
or
- Morning range extremes.
- Stop runs often sweep these levels quickly!
- The true market direction emerges after this sweep.
So, if you want to master how to trade stop runs, keep your eyes on these zones! Don’t react to the first spike. Instead, watch how the market behaves after it clears the level.
How to Trade the Aftermath of a Stop Run

A stop run is just a quick and emotional move to flush out traders! Please note that:
- The real opportunity isn’t in the spike.
- Instead, it’s in what the market does after that moment of chaos.
Thus, you, as a trader, must focus on whether the price accepts the move and builds momentum or rejects it and reverses. Want to do it like a pro? Study the points below:
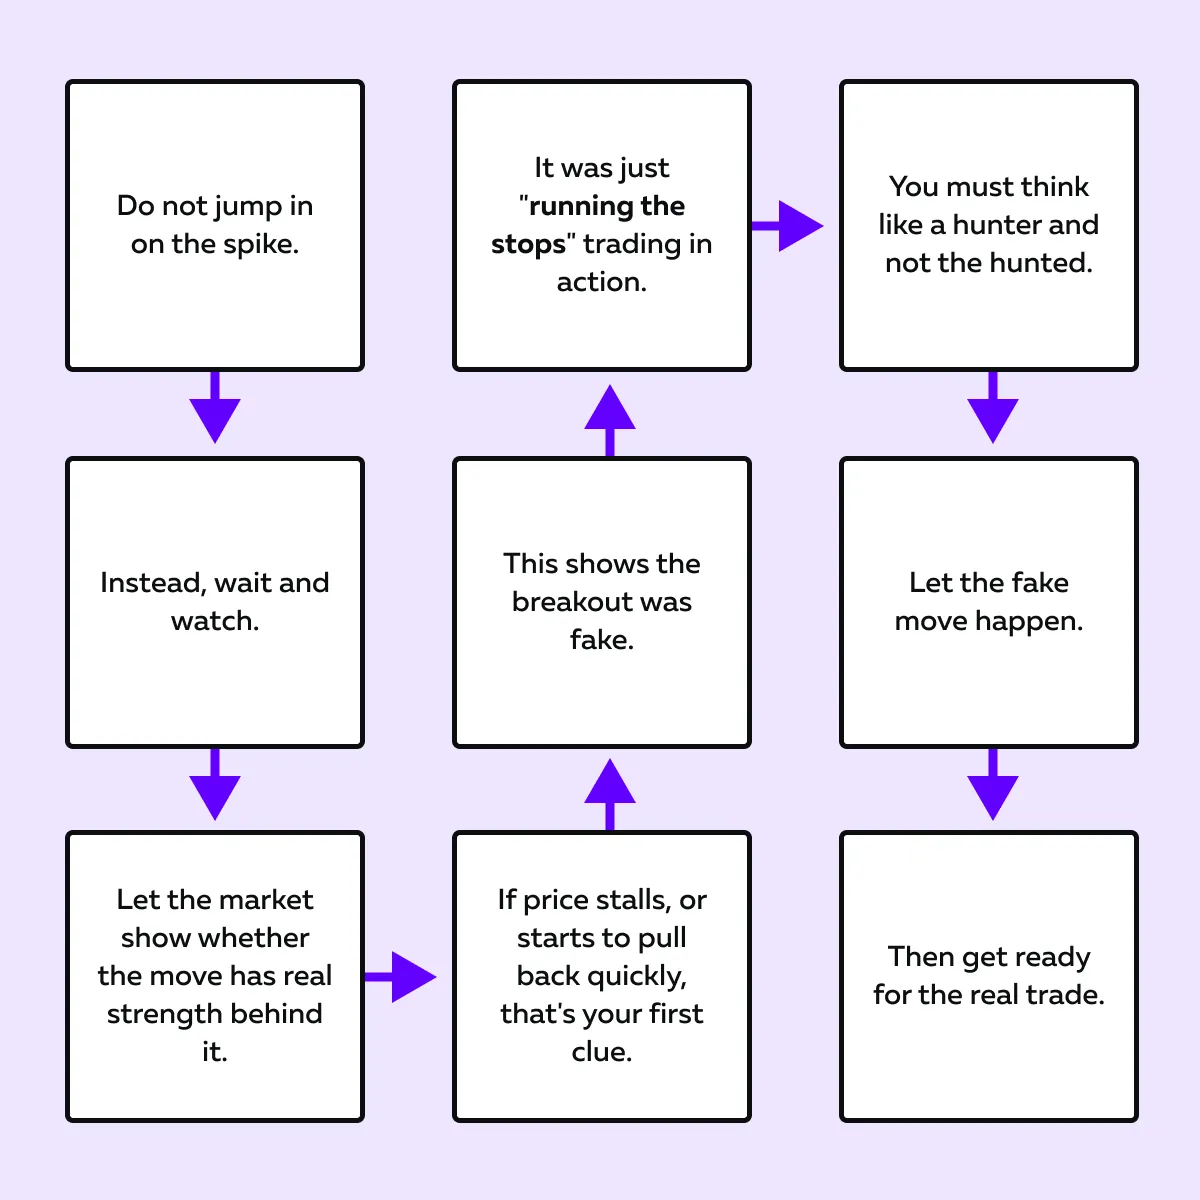
1. Don’t Chase the Initial Spike
The first move after the stop run is often a trap. It looks like a breakout, but it’s really just “liquidity hunting.”
This is what you should do:
Then, get ready for the real trade.
2. Watch for Absorption + Rebuild of Liquidity
After the stops are triggered, you must look for these two signs:
| Sign I: Absorption | Sign II: Liquidity Rebuild |
|
|
These two signs together tell you:
- The trap has likely been set
and
- Price is now more likely to revert in the opposite direction.
Want to see this behavior clearly? You should use our avant-garde market analysis tool, Bookmap. Using it, you can do a detailed DOM (Depth of Market) analysis. On Bookmap, you can easily see:
- Large volume dots forming at the extreme
or
- New liquidity appears just above/below the spike level.
By doing so, you can understand the market’s true intention. Watch stops getting triggered in real-time—see where the real move starts. → Compare Plans
3. Join the Reversal or Continuation Once Structure Forms
Once the stop run has played out, it’s time to focus on whether the price wants to reverse or continue. Be careful — don’t enter the trade blindly. You must wait for the structure to form. Let’s understand how it works:
There are Two Main Outcomes After a Stop Run:
| Outcome I: Reversal (Trap and Fade) | Outcome II: Continuation (Real Breakout) |
|
|
Pro Tip – Use the Re-test as Your Entry
Often, after the spike, the price will come back to re-test the level where the stop run ended. Now, let’s say:
- This re-test fails to break through again
and
- The price gets rejected.
That’s your low-risk entry! You can enter with a tight stop just beyond the extreme of the stop run. Let’s understand better through an example:
-
- Say ES futures spike above 4300 in a stop run.
- Then, it falls back into the range.
- Later, the price goes back up to test 4300 again.
- However, the price can’t break it and starts to drop.
- That’s a strong sign the stop run was a trap.
- Now, if you enter short there, it gives you a clear edge.
- You enjoy:
- A tight stop,
- Defined risk, and
- Enough room to ride the reversal.
So, if you’re learning how to trade stop runs, this is the final step! Always wait for structure, don’t guess. Let the market show you its hand, and then join the side that has real intent (whether that’s a sharp reversal or a clean continuation).
Conclusion
Stop runs are not just random spikes or market tricks! It’s all part of the natural mechanics of the market. Big players need liquidity to enter or exit large positions, and triggering stop-loss orders is a smart way to find it. Please realize this isn’t manipulation; instead, it’s smart execution!
If you learn to spot stop runs in real-time, and more importantly, wait for what happens after, you can avoid falling into the trap yourself. Instead of being part of the crowd that gets shaken out, you can position yourself with the side that’s actually in control.
Want to stay one step ahead? Start using our advanced real-time market analysis tool, Bookmap. Using it, you can easily see the volume, liquidity shifts, and absorption that reveal a stop run’s true intent! Tired of being the liquidity? Learn to spot stop runs as they happen. → Compare Plans
FAQ
1. What’s the difference between stop hunting and a stop run?
Stop hunting and stop runs are often used interchangeably. That’s because they refer to very similar market behavior! In both concepts, the price is pushed through key levels where many traders have placed their stop-loss orders.
Please note that the goal is to trigger those stops, which adds a burst of buying or selling to the market. This gives larger players the liquidity they need to enter or exit big positions.
If we still talk about some differences, then it is in the tone:
- “Stop hunting” implies someone intentionally causing the move
while
- “Stop run” happens naturally due to crowded order flow.
Either way, the effect is the same! A fake-looking spike, followed by either reversal or continuation.
2. How can I spot a stop run before it’s over?
To catch a stop run while it’s happening (and avoid getting trapped), you need to spot two key things:
| Observation I | Observation II |
|
|
If the spike lacks follow-through, and price stalls or reverses, that’s a strong sign it was a stop run.
Additionally, watch for no new support or resistance rebuilding after the move. That signals it was just a short-term push to:
- Trigger stops
and
- Tap into liquidity.
3. Are stop runs illegal?
No, stop runs are not illegal. In fact, markets need stop-loss orders as they add liquidity. They help big traders enter or exit large positions.
These large players often operate in areas where stop orders are clustered. Why? Because it helps them find the other side of the trade. This can look like manipulation, but it’s simply how institutional trading works!
As long as there’s no false information or deceptive tactics involved, stop runs are entirely within the rules.
4. Can Bookmap help identify stop runs?
Yes, Bookmap is one of our best tools for spotting stop runs in real-time. It visually shows you:
- Liquidity zones (where orders are sitting),
- Volume spikes, and
- Order flow behavior.
You can literally watch liquidity pulling away just before a spike and see the cluster of stops getting triggered. Next, you can clearly observe whether:
- Price continues
or
- Gets absorbed and reverses.
This knowledge allows you to avoid chasing the trap!
Sign Up Now