See stop order more clearly in real time.
Compare plans to access deeper market visibility for stop order.
Education
October 20, 2024
Updated
SHARE
How to Spot Stop Order Clusters & Understand Their Impact on Market Movements?

Financial markets are complex, and often influenced by factors such as market liquidity and volatility. But how can you deal with these complexities and do better trading? Understanding the concept of “stop order clusters” is important.
In this article, we will explain the concept of stop orders, how they function, and how clusters can impact market movements. You’ll learn about the expected market reactions when clusters are triggered and how to anticipate and trade around these events.
We will also explore the modern tools available for detecting stop order clusters, like Bookmap’s Stops & Icebergs indicators and volume and order flow analysis. Moreover, some practical strategies for trading around these clusters will be discussed, including breakout strategies and risk management techniques.
Lastly, real-world examples demonstrate how these strategies work in practice. These examples will help you to apply these concepts to your own trading activities. Let’s begin!
What Are Stop Order Clusters?
Firstly, let’s understand “stop orders”. They are automated instructions placed by traders to buy or sell a security once its price reaches a specified level. These orders help manage risk by automatically exiting a position when the price hits a predetermined level.
For example,
- Say a trader holds a stock at $100.
- They set a stop order at $95.
- Now, the position will be sold if the price drops to $95.
- In this way, the trader’s loss gets limited.
Now, “stop order clusters” occur when a large number of stop orders are placed around the same price level. Usually, this happens because many traders identify similar key levels, like support or resistance, and place their stop orders around these areas. It must be noted that stop orders mostly cluster at these two locations:
- Just below support levels, where traders aim to protect against a likely breakdown
or
- Just above resistance levels, traders seek to secure profits before a possible reversal.
Additionally, be aware that these clusters often trigger significant market movements. That’s because they cause multiple orders to execute simultaneously.
How to Detect Stop Order Clusters?
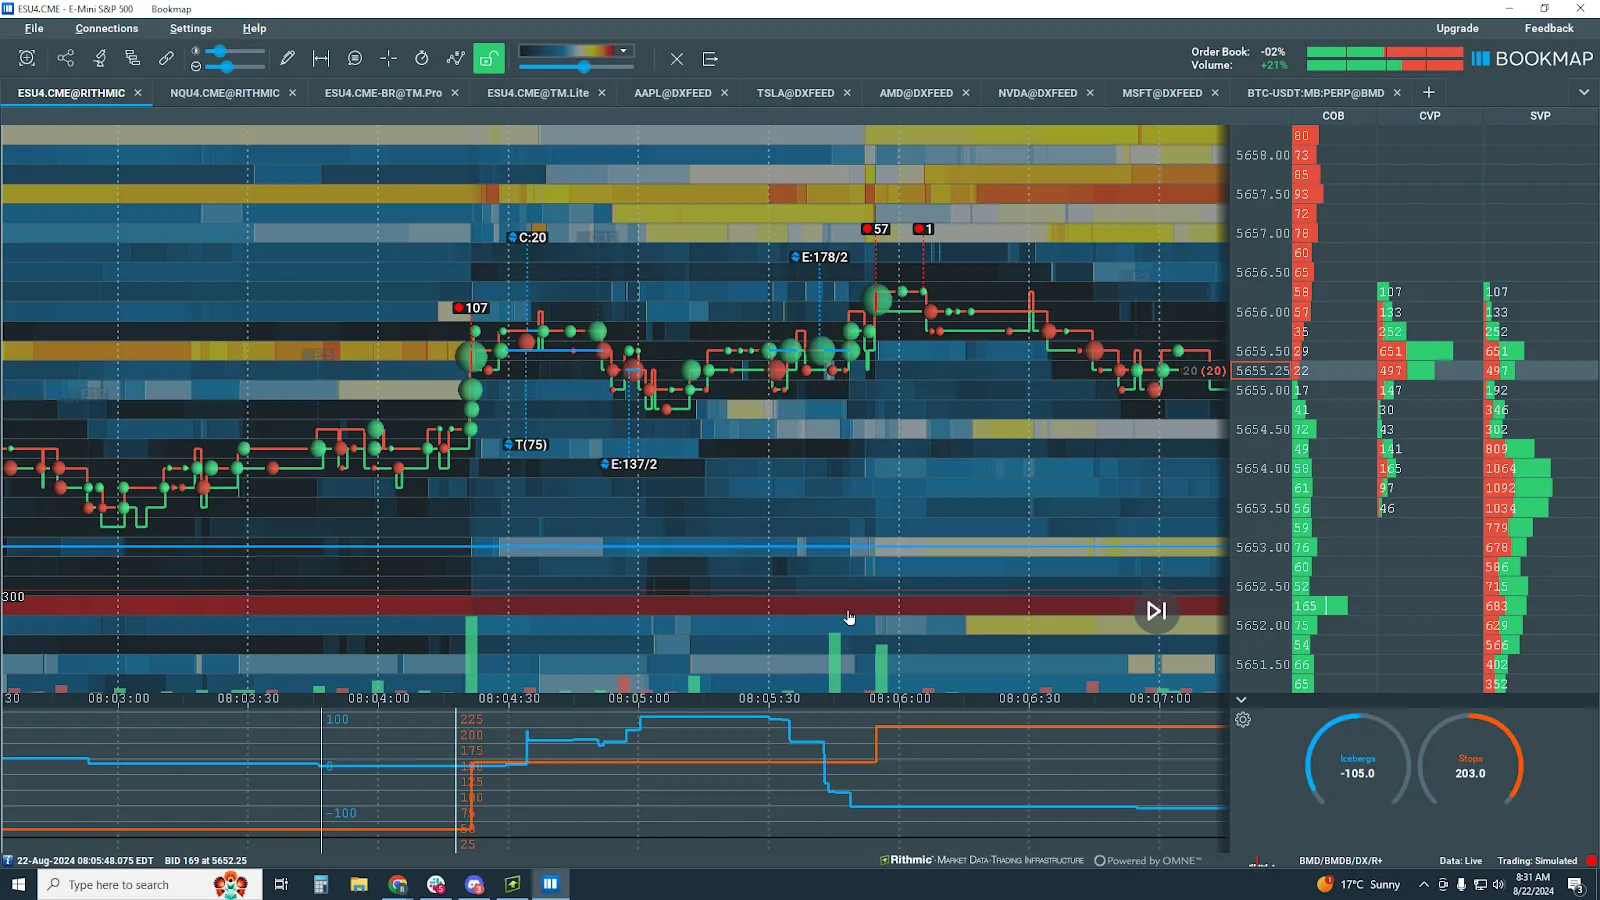
To accurately detect stop order clusters, you can use advanced market analysis tools like Bookmap. See the graphic below to check what modern tools are offered by Bookmap:
Now, let’s study each of these tools in detail:
- Bookmap’s Stops & Icebergs add-ons
These powerful tools allow traders to detect stop order clusters in real-time. These indicators visually represent where stop orders and iceberg orders (hidden large orders) accumulate.
In this way, traders gain insights into likely market movements. Moreover, by analyzing these clusters, traders can also anticipate where significant price actions might occur due to the execution of numerous stop orders.
- Stops & Icebergs Sub-Chart Indicator in Bookmap
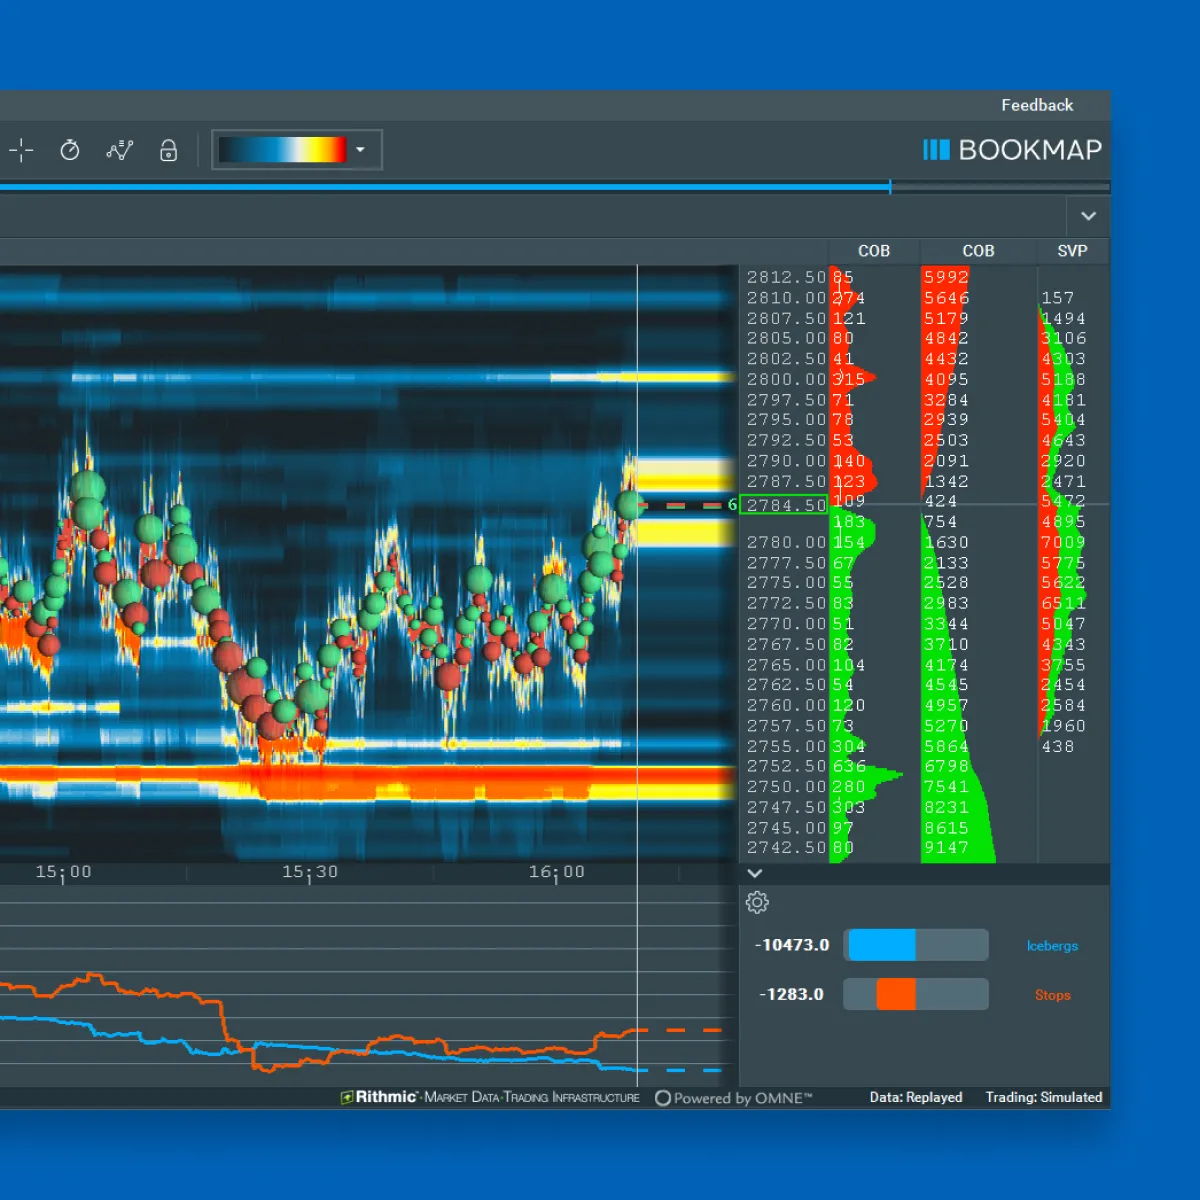
This tool provides a detailed view of stop orders at various price levels. Most traders use it to identify significant clusters of stop orders at key levels, such as below support or above resistance. By recognizing these clusters, traders can better predict the expected price movements and set their orders strategically.
- Volume and Order Flow Analysis
Traders can also detect stop order clusters through volume and order flow analysis. By monitoring sudden increases in trading volume or analyzing specific order flow patterns, traders can spot areas where stop orders are likely being triggered. Mostly, at first, there is a sharp increase in volume at a particular price level. Then, this increase is followed by a rapid price movement. Usually, traders interpret this as the activation of a stop order cluster.
For more clarity, let’s study an example
Say a stock trades around $100 with significant support at $95. Assume many traders have placed stop orders just below $95. There is a sudden spike in volume, and the price drops to $94.50.
This situation indicates that these stop orders are being triggered. Moving forward, this activation leads to a rapid decline in the stock price, which more evidently signals the presence of a stop order cluster.
Understand the market impact of stop orders with Bookmap. Get started here!
The Market Impact of Stop Order Clusters
It is worth mentioning that when a stop order cluster is activated, it usually leads to sudden and significant price movements. This happens due to the influx of orders being executed at once. For a greater understanding, let’s check how this event unfolds in the market practically:
-
- Firstly, a large cluster of “sell-stop orders” gets triggered below a key support level.
- Now, a sudden surge in selling activity overwhelms the market.
- It drives the price sharply downward.
- Also, it spikes volatility, which significantly impacts liquidity.
- These rapid price changes cause market participants to pull their orders.
- Such a pullback further exacerbates the price move.
Now, let’s study an example where sell-stop orders are triggered just below support:
- Say a stock has strong support at $100.
- Several traders place their sell-stop orders just below this level.
- Now, if the price breaks below $100, these stop orders get triggered.
- As a result, the market experiences a sharp decline as the selling pressure increases rapidly.
- This sudden drop catches traders off guard and leads to a cascade of further selling as more stop orders get triggered.
- This pushes the price even lower.
How Does Market Manipulation Happen Around Stop Order Clusters?

When studying stop order clusters, it is necessary to understand the associated “market manipulation.” That’s because sometimes these clusters are targets for market manipulation, especially by large traders or institutions. These entities attempt to “hunt” stop orders by deliberately driving the price toward a known cluster. By doing so, they trigger the orders and profit from the subsequent price movement.
For example,
- Say a large trader pushes the price of a stock down to just below a support level where many sell stop orders are clustered.
- Once these orders are triggered, the trader capitalizes on the rapid downward price move.
- They do so by buying back the stock at a lower price.
Now, the question arises of how traders can observe such aggressive moves towards stop clusters. To make such an observation, traders must try to spot a sudden and aggressive push towards a known stop order cluster. Usually, this push precedes a rapid price movement, and this aggressive action indicates manipulation.
Be aware that through this act, an instigator aims to:
- Trigger the cluster
and
- Profit from the resulting volatility.
By understanding this behavior, traders can protect their positions or even take advantage of the situation by anticipating the market’s next move. Spot and analyze stop order clusters using Bookmap – Join now!
Strategies for Trading Around Stop Order Clusters
Trading around stop order clusters requires careful planning. Traders can capitalize on significant price movements only by:
- Anticipating the market’s reaction to these clusters
and
- Using breakout strategies
Also, effective risk management is important as it helps better deal with the volatility accompanying these trades. Now, let’s check out the various trading strategies around stop order clusters:
Strategy I: Anticipating Market Reactions

One effective strategy for trading around stop order clusters is related to anticipating how the market will react once these orders are triggered. Following this strategy, traders can position themselves to take advantage of the heightened volatility that often follows the activation of these clusters.
For example,
- Say a trader identifies a cluster of sell-stop orders below a key support level.
- They place a buy order slightly below this cluster.
- Here, the idea is to capture a quick rebound after the stop orders are triggered.
- This situation causes the price to dip temporarily before recovering as the selling pressure subsides.
Refine your trading strategy with our tools for detecting stop orders. Sign up today!
Strategy II: Using Stop Order Clusters for Breakout Strategies

Similarly, traders can use their knowledge of stop-order clusters to execute breakout strategies. By knowing where these clusters are located, traders can anticipate significant price moves once the clusters are triggered.
For example,
- Say there is a known cluster of buy-stop orders just above a resistance level.
- A trader enters a long position before the price reaches this level.
- As the price breaks through the resistance and triggers the buy-stop orders, the trader benefits from the resulting surge in price.
- In this way, the trader positions themselves to capitalize on the breakout.
For more clarity, let’s study a scenario related to trading a buy-stop order cluster above resistance:
Say a trader is analyzing a stock consistently hitting resistance at $150. The trader identifies a buy-stop order cluster just above this level. This suggests that if the price breaks through $150, a wave of buy orders could be triggered, which could push the price higher.
Next, anticipating this breakout, the trader decides to place a buy order at $151, just above the resistance level. The logic is that once the price crosses $150 and hits the buy-stop orders clustered around $151, the increased buying pressure will drive the price up quickly. This price surge will allow the trader to profit from the momentum.
How to Manage Risk?
One must be aware that trading around stop order clusters can be profitable, but it comes with heightened risks due to the increased volatility. Therefore, traders must use tight stop-loss orders to protect their positions.
In the above scenario, the trader places a stop-loss order at $148, just below the resistance level to manage risk. This ensures that the trader’s losses are minimized if the price fails to break out and instead falls back.
Additionally, if the trader were shorting the market and identified a sell-stop order cluster, they might place their stop-loss just above the cluster. This placement would protect them against a likely rebound after the sell-stop orders are triggered and ensure they don’t get caught in a rapid price reversal.
Examples of Trading Around Stop Order Clusters
For a greater understanding of the concept, let’s study the various examples showing how to trade around stop order clusters:
Example 1: Profiting from a Sell Stop Order Cluster
-
- A Bookmap platform trader spots a significant sell-stop order cluster just below a strong support level at $120.
- The heatmap reveals that many traders have set their sell-stop orders around $119.50.
- They expect the price to be above $120 in support.
- However, the trader anticipates that the stop orders will be triggered if the price dips below $120.
- This will lead to a sharp downward move due to the sudden increase in selling pressure.
- Now, to capitalize on this, the trader decides to enter a short position at $119.75, slightly above the cluster.
- As the price drops the $120 support, sell-stop orders are triggered.
- Resultantly, the price quickly falls to $118.50.
- The trader exits their short position at this lower price.
- In this way, they secure a profit from the downward move triggered by the stop order cluster.
Example 2: Avoiding a Losing Trade by Recognizing a Buy-Stop Order Cluster
- A trader plans to go long on a stock testing a resistance level at $200.
- The trader notices a large buy-stop order cluster just above this resistance level at around $201 on the Bookmap platform.
- This indicates that many traders expect the price to break above $200.
- Such a situation can trigger buy-stop orders and increase prices.
- However, the trader is cautious. They consider the possibility of a “fakeout,” where:
- The price temporarily spikes above $200
- Triggers the buy-stop orders, and
- Then quickly reverses.
- To avoid a loss, the trader decides to hold off on their long position and instead waits for the price to break above $200 and reach $201.
- Once the stop orders are triggered and the price spikes, the trader observes the price action closely.
- As anticipated, the price quickly reversed after hitting $201.
- The trader then enters a short position at $200.75.
- By doing so, the trader takes advantage of the reversal and profits as the price drops below $200.
- In this way, by recognizing the stop order cluster, the trader successfully avoids losing trade and even turns the situation into a profitable one.
Conclusion
Detecting stop order clusters and understanding their impact on the market are necessary trading skills for any trader. That’s because stop order clusters, whether they are buy or sell orders, often lead to significant price movements when triggered. This creates opportunities for profit or potential risks. By recognizing these clusters, traders can anticipate market reactions and plan breakout strategies. Also, they can avoid getting caught in manipulations like “fakeouts.”
Moreover, traders must understand that risk management is important when trading around stop order clusters due to the increased volatility they can cause. By placing tight stop-loss orders and carefully observing market conditions, traders can protect their capital while dealing with these volatile situations.
To gain an edge in making informed decisions, traders must understand how stop order clusters form, their common locations around key price levels, and their effects on market liquidity and volatility. Furthermore, if you want to improve your trading strategies and gain a competitive edge, consider using our modern tools. Sign up today and take the next step in enhancing your trading skills.
Sign Up Now