See small cap more clearly in real time.
Compare plans to access deeper market visibility for small cap.
Stocks
March 28, 2025
SHARE
Small-Cap Momentum Strategies: From News Catalysts to Breakouts with Order Flow

Momentum waits for no one; either you ride the wave or get left behind! Yes, small-cap stocks offer some of the most explosive opportunities, but only if you know how to trade them right. Many traders jump into breakouts without a clear plan. By doing so, they get trapped in false moves or caught off guard by liquidity risks.
Want to avoid them? Read this article till the end to avoid those mistakes and develop a structured approach to trading small-cap momentum stocks. In this article, you’ll learn how to identify high-potential momentum stocks, track critical catalysts like earnings announcements or FDA approval, and make an order flow analysis to confirm breakouts.
You will also understand how using our market analysis tools, Bookmap, features (heatmaps, liquidity trackers, and volume dots) can help you anticipate price moves before they happen. Are you ready to refine your skills and take advantage of small-cap momentum? Let’s begin.
What Are Momentum Stocks, and Why Focus on Small Caps?
Momentum stocks are those that experience significant price movements. These movements are usually driven by:
- High trading volume,
and
- Strong market sentiment.
These stocks often gain traction when a clear trend forms. They attract traders who want to capitalize on price momentum. By making a well-planned momentum stocks trading strategy, you can identify stocks that are already moving in one direction. In this way, you can ride the trend for likely gains.
Small Caps are the Real Big Guns!

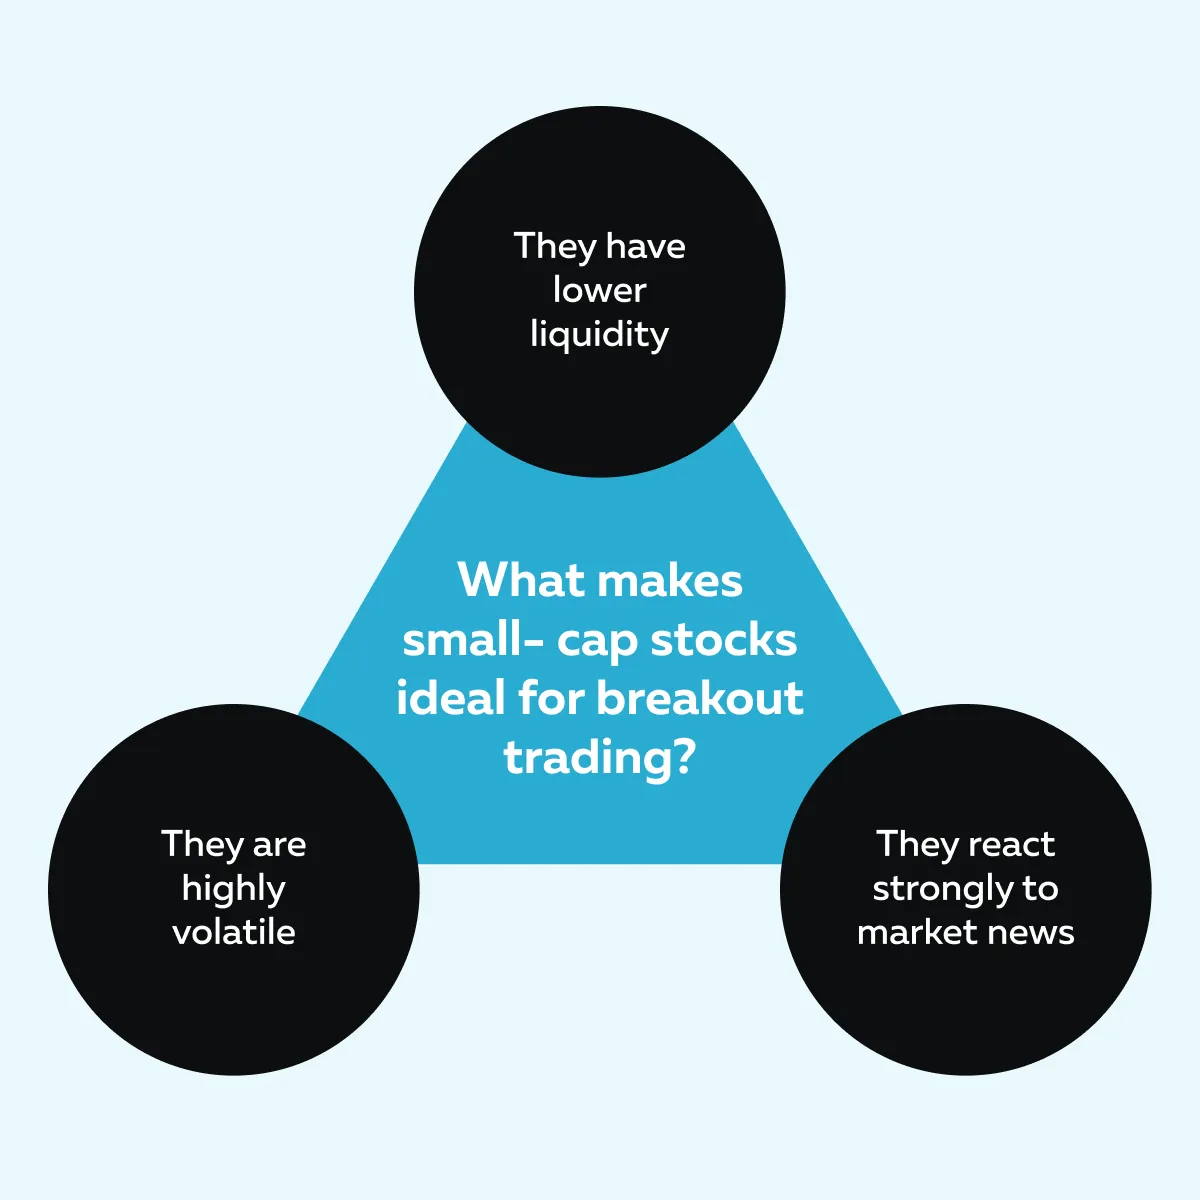
Please note that small-cap stocks are particularly attractive for momentum trading. That’s because they have:
- Higher volatility, and
- Lower liquidity.
Also, these stocks are not as widely followed by large institutions. Thus, they experience sharper price swings when demand increases. This creates opportunities for breakout trading in small caps. In this technique, you look for stocks breaking through key resistance levels with strong momentum.
Additionally, market inefficiencies (such as limited analyst coverage and price discrepancies) make small-cap stocks more likely to experience sudden price surges. This gives you frequent setups to exploit.
Momentum Stocks React to Catalysts
Momentum stocks often react strongly to specific catalysts. Check the graphic below to learn about some common examples:
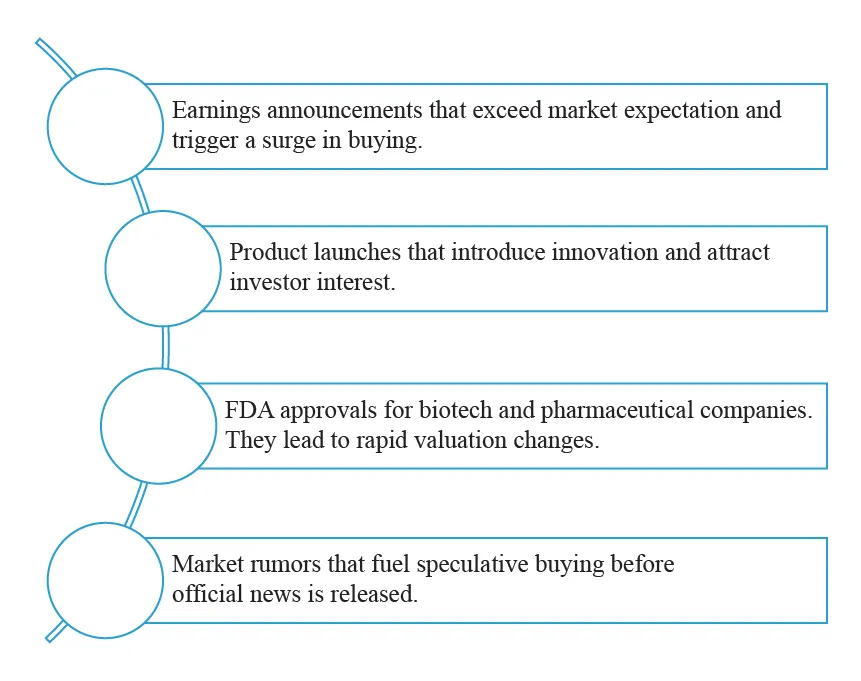
As a trader, if you want to capitalize on momentum, you should monitor:
- News sources,
- Earnings calendars and
- Social media.
This monitoring will allow you to track stocks gaining traction. Moreover, try to understand the order flow in momentum trading. This will help you analyze real-time buying and selling activity and confirm whether a stock has the strength to sustain its move.
Through an objective momentum trading guide, you can easily develop structured strategies for identifying high-potential setups.
Identifying Momentum Opportunities: News and Volume Indicators
To identify profitable opportunities while trading momentum stocks, you can track news filters and analyze volumes. Let’s see how:
News Filters

One of the best ways to find momentum stocks is by tracking news events, as these events trigger strong price moves. Most traders use financial news aggregators like Bloomberg, CNBC, and Benzinga. Using these sources, they filter for key market catalysts such as:
- Earnings surprises,
- Mergers, and
- Industry developments.
For breakout trading small caps, try to stay updated on company announcements and insider activities. Also, refer to analyst upgrades, as these stocks often react sharply to news. By setting up alerts on trading platforms or using social media sentiment tools, you can catch early signals of momentum before a stock makes a major move.
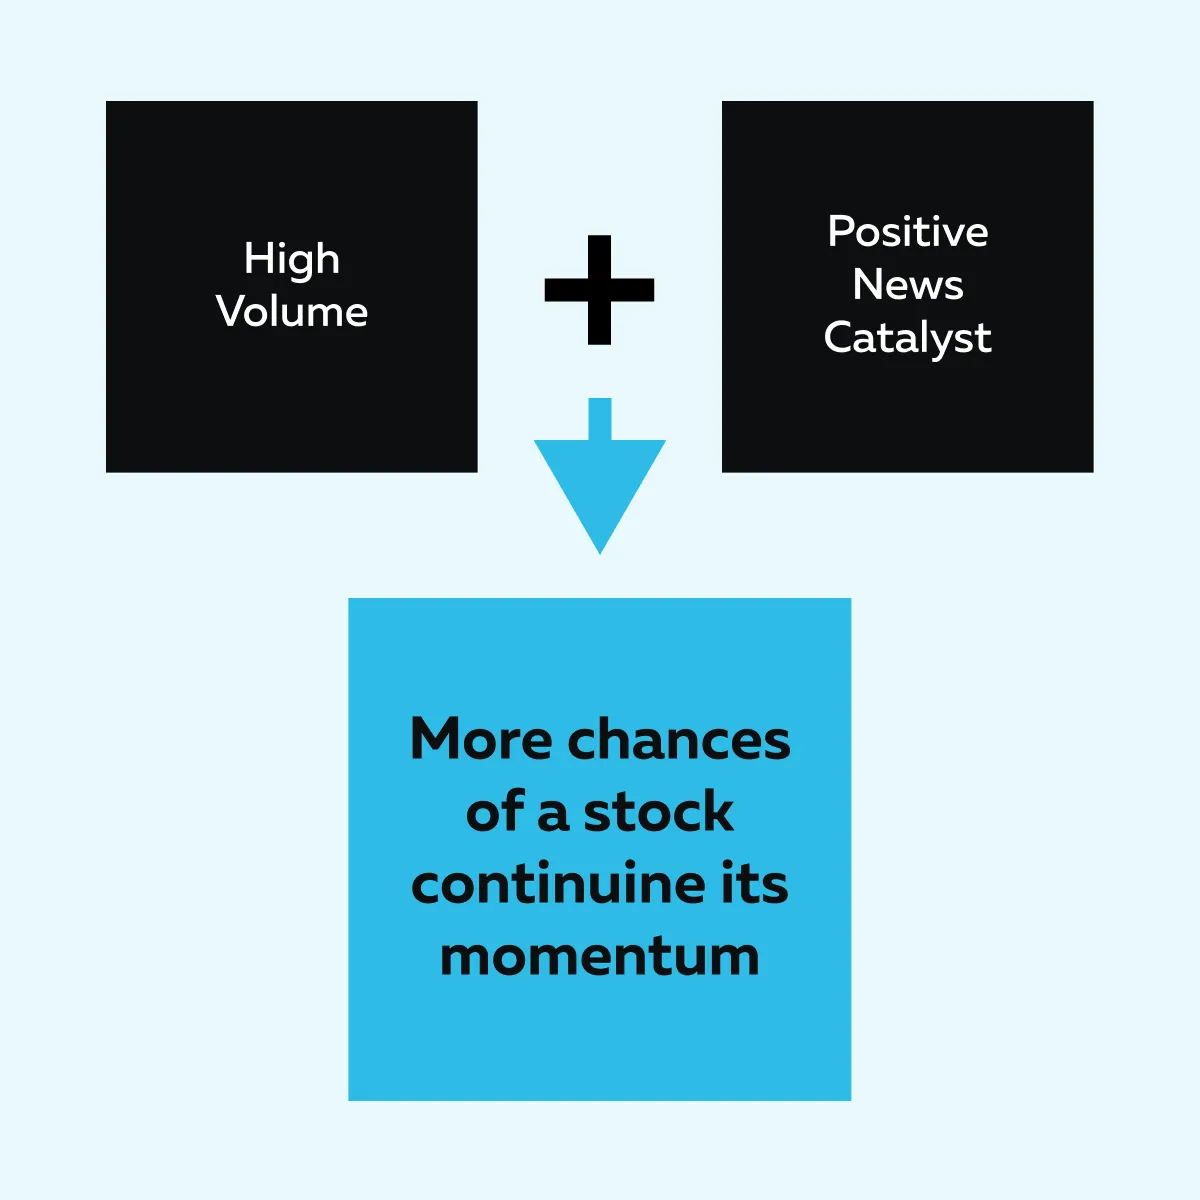
Volume Spikes
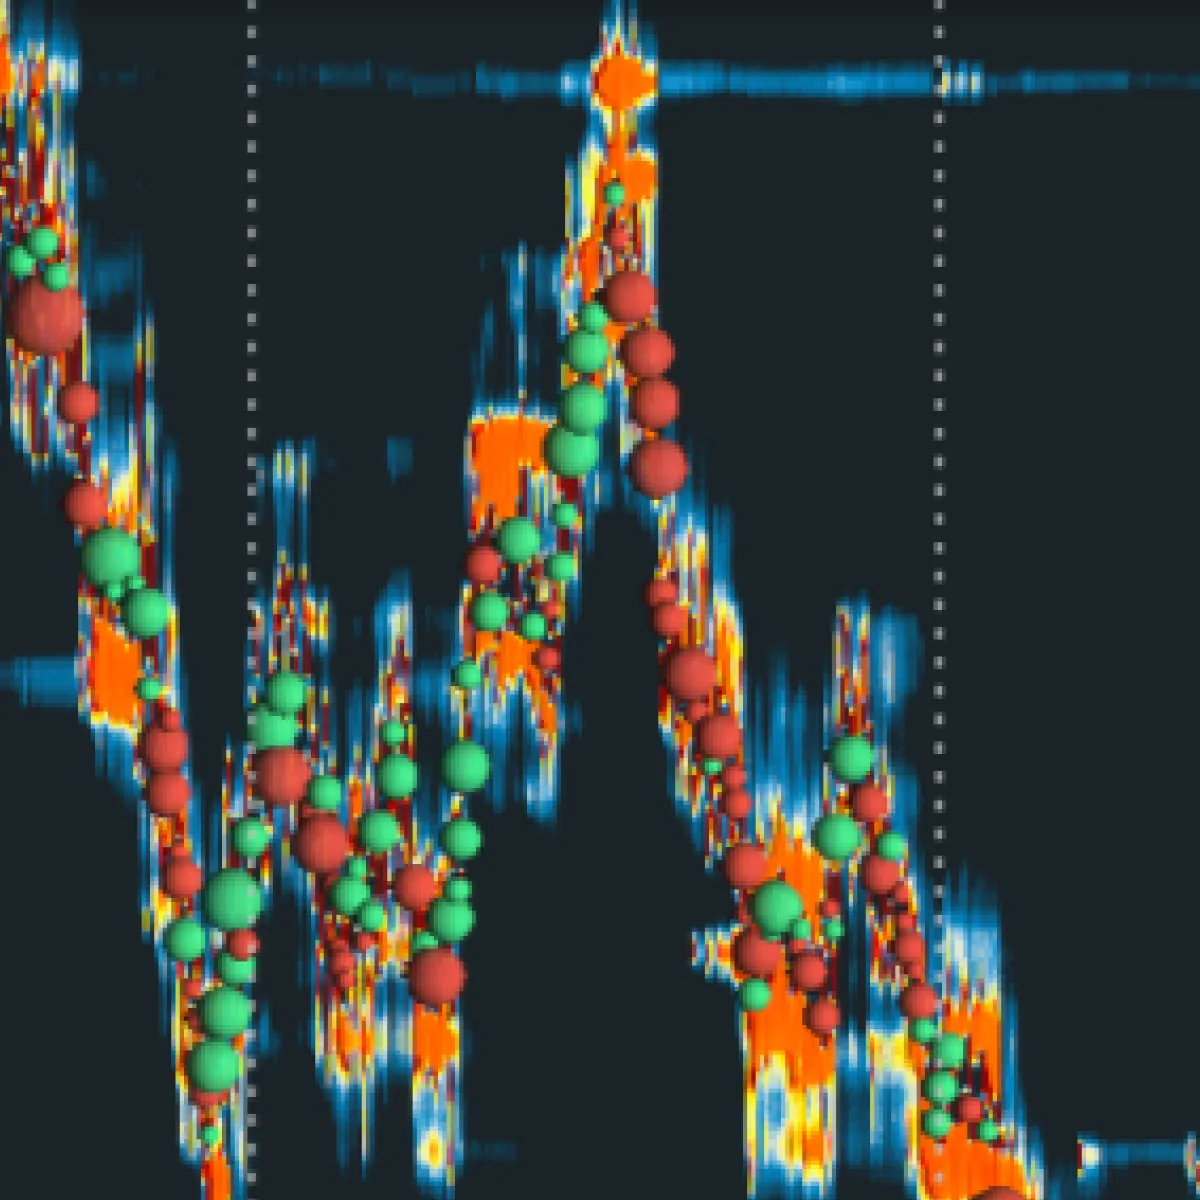
Using volume indicators, you can confirm the strength of a price move. For example,
- Say a stock is experiencing a 200% increase in pre-market trading volume.
- Now, this suggests heightened investor interest.
- This interest can lead to a strong breakout once the market opens.
In this way, by monitoring order flow in momentum trading, you can see whether buying pressure is strong enough to sustain the uptrend. Let’s see how through the graphic below:
As a tip, start using an objective momentum trading guide. It will help you get strategies for analyzing volume trends and filtering stocks that have the best potential for sustained movement.
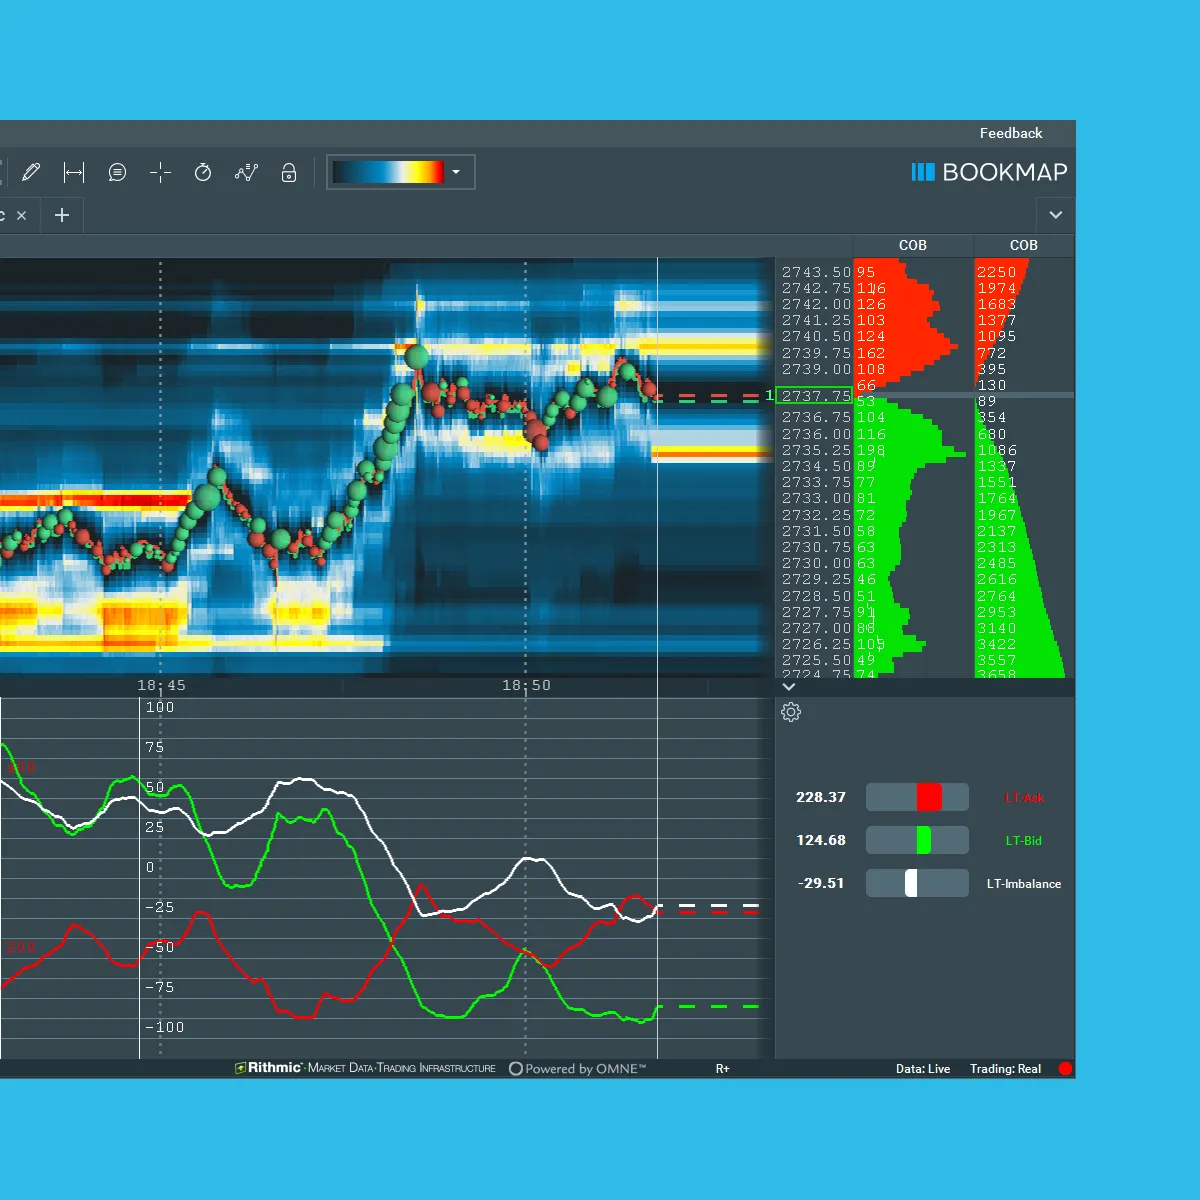
Analyzing Momentum with Order Flow and Liquidity Tools
To trade profitably in volatile market conditions, you need to understand order flow in momentum trading. Real-time order flow allows you to see whether buying or selling pressure is increasing. Using this information, you can gauge market sentiment.
Furthermore, by analyzing order flow, traders can confirm whether a stock’s momentum is supported by strong demand or if it may face resistance. One of the best platforms for this type of analysis is our advanced market analysis tool, Bookmap. It offers you several tools to visualize market liquidity:
| Heatmap | Liquidity Tracker | Volume Dots |
|
|
|
Analyze market liquidity and make informed trading decisions using Bookmap.
How Traders Use Bookmap to Confirm Breakouts

Using Bookmap, you can monitor Level 2 Data and flurries of activity. You can focus on short bursts of aggressive buying or selling. This helps you determine if a breakout is gaining strength. Be aware that a common sign of a breakout is when large market orders continuously hit the asking price. This shows that buyers are stepping in aggressively.
For example:
- Say you are doing breakout trading in small caps.
- Now, on Bookmap, you see a surge of buy orders rapidly consuming available sell orders.
- This event signals strong momentum and suggests that the stock could push higher.
- This makes it a high-probability setup for momentum traders.
Context Matters: Price Structure + Liquidity + Volume Flows
In Bookmap, you can interpret order flow using a combination of key factors:
- Price Structure: You identify key resistance and support levels where breakouts may occur.
- Liquidity: You watch where large orders are placed. This helps you understand if buying pressure can sustain the move.
- Volume Flows: You observe how volume interacts with price movements. This helps you confirm whether the breakout is real or likely to fade.
By combining these insights, you can create an objective momentum trading guide. This will help you to better deal with volatile markets (with data-driven confidence).
Visualize Liquidity Zones and Get Breakout Confirmations
For the unaware, “liquidity zones” are areas where major resting orders either support or absorb price action. As a trader using Bookmap’s heatmap, you can visualize these liquidity pockets. This will help you to identify whether a breakout is likely to succeed.
Let’s understand how through the graphic below:
Spot the Flurry of Activity and Use it to Confirm Real Momentum
Please note that a sudden increase in transaction volume at key levels confirms strong momentum. In momentum stocks trading strategy, this flurry of activity helps traders distinguish between a false breakout and a real one. When volume surges at resistance and buyers continue to step in, it suggests genuine strength in the move.
Let’s understand better through an example:
- A trader identifies a consolidation zone in a small-cap stock.
- As the price approaches resistance, Bookmap’s volume dots start increasing in size.
- This signals that aggressive buyers are entering.
- Liquidity on the ask begins to thin out.
- Now, market orders start clearing the order book.
- This confirms a potential breakout.
- The trader then takes a long position as they anticipate the continuation of momentum.
How to Identify Liquidity Zones for Breakouts
By using our Bookmap’s heatmap, you can locate key liquidity levels where a breakout or resistance might occur. For example, if a stock is trading near a liquidity pocket and that level gets cleared, it often triggers a strong upward move.
By using these insights, you can follow an objective momentum trading guide that relies on real-time data rather than guesswork. This significantly improves your ability to capitalize on momentum opportunities.
Tracking Retests on Short Time Frames
In momentum stocks trading strategy, tracking retests of liquidity levels helps traders confirm whether a breakout is strong or likely to fail. Please note that when a stock breaks through a key resistance level, it often pulls back to test that level again. If buyers step in at this point, it signals that the level has turned into support, increasing the chances of continued momentum.
Let’s understand better through an example:
- A small-cap stock experiences a breakout.
- It clears a major resistance level.
- After an initial flurry of buying, the price pulls back to retest the breakout zone.
- Now, buyers defend this level, and volume increases again.
- This confirms that momentum is still strong.
- The stock resumes its upward move.
- This allows traders to enter with confidence.
Common Challenges in Small-Cap Momentum Trading
Small-cap momentum trading is profitable but comes with several challenges:
A) Liquidity Risks
One major challenge is low liquidity. Small-cap stocks often have fewer buyers and sellers. This means large orders can cause sudden price jumps or drops. This can also lead to slippage, where orders get filled at a worse price than expected, or there are unexpected reversals as there aren’t enough buyers to support the breakout.
How to Mitigate?
- Use smaller position sizes to avoid moving the market with large trades.
- Set tight stop-loss orders to manage risk in case of sudden price swings.
- Monitor order flow in momentum trading and see if buyers and sellers are actively supporting the move.
B) False Breakouts
Small-cap stocks are prone to false breakouts. In these breakouts, the price briefly moves above resistance but quickly reverses. This traps traders. These fake moves often happen due to low liquidity or market manipulation.
How to Mitigate?
- Use order flow data to confirm a breakout.
- Look for aggressive buyers stepping in and clearing sell orders at resistance.
- Watch Bookmap’s liquidity tracker to see if liquidity is thinning out. This signals an actual move.
C) News Volatility
Stocks moving on the news can be highly volatile. It becomes difficult to manage risk in them. Also, a stock reacting to earnings, FDA approvals, or rumors may see sharp price swings within seconds.
How to Mitigate?
- Monitor Bookmap’s order book to avoid entering trades when the price is stretched too far from liquidity zones.
- Avoid chasing moves that are likely to reverse.
- Follow an objective momentum trading guide to ensure traders focus on data-backed decisions instead of emotional trading.
Breakout Trading: Capitalizing on Momentum in Small-Cap Stocks
“Breakout trading” is a strategy where traders enter positions when a stock moves:
- Above a resistance level
or
- Below a support level (with strong volume and conviction)
Here, the idea is to catch the stock as it starts a strong trend and profit from its momentum. Be aware that a successful breakout is confirmed when the price stays above the breakout level and continues to move in the same direction.
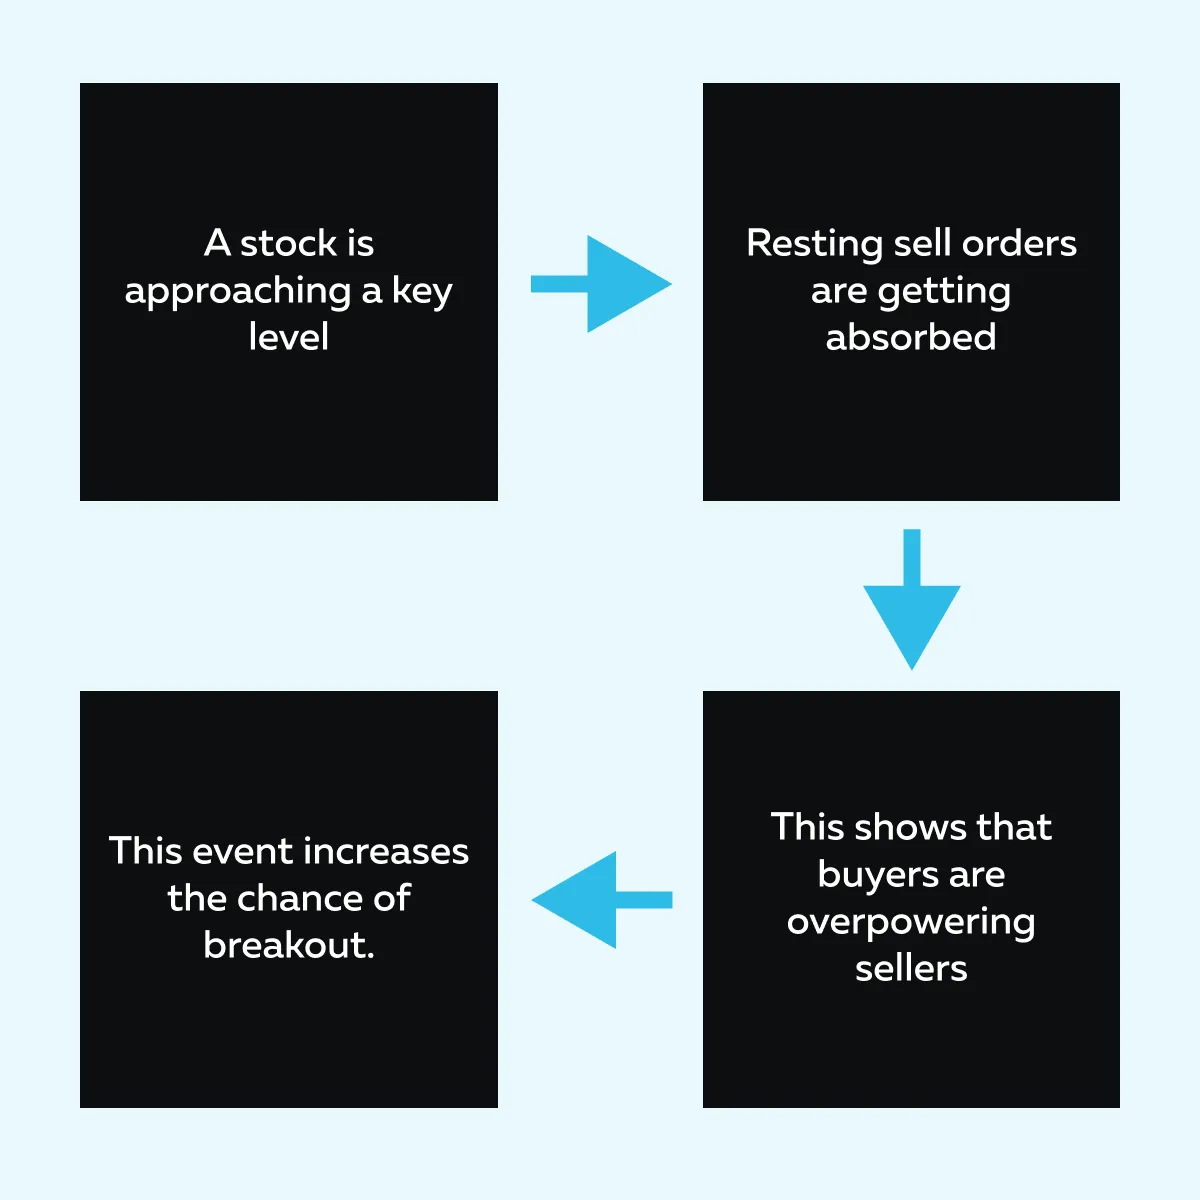
Why Small-Cap Stocks Are Ideal for Breakout Trading?
Small-cap stocks are perfect for breakout trading. Let’s see why through the graphic below:
Since these stocks aren’t heavily traded by large institutions, their prices can move rapidly when demand increases. This creates frequent breakout opportunities and allows traders to capitalize on strong momentum shifts. Filter momentum stocks efficiently and time your entries with Bookmap’s advanced heatmap features.
How to Identify Breakout Opportunities
News often serves as the primary trigger for breakouts in small-cap stocks. Some examples include:
- A biotech company announcing FDA approval. This leads to a sudden spike in buying interest.
- A small-cap tech firm securing a significant contract. This drives up demand as traders anticipate future growth.
Since news can drive massive price swings, most traders use it to confirm if buyers are stepping in aggressively.
Additionally, you can refer to volume spikes. Most breakouts are also preceded by unusual volume activity. A sudden increase in volume suggests that large traders or institutions are entering positions. This can push the stock higher. By using our real-time market analysis tool, Bookmap, you can analyze real-time volume changes. Watching volume surges allows you to confirm real interest before entering a trade.
How to Use Order Flow to Confirm Breakouts
You can do this in the following two ways:
| Aspects | Method I: Liquidity Analysis | Method II: Aggressor Activity |
| Meaning |
|
|
| Example |
|
|
How to Manage Trade Entry and Exit

If we talk about the entry timing, the best time to enter a trade is after the breakout is confirmed with strong volume. For example:
- Say a trader waits for Tesla to breach $150 with sustained buy-side volume before taking a long position.
- Here, entering too early can lead to being trapped in a false breakout.
Now, to lock in profits, traders scale out of positions (exit) incrementally. By doing so, they keep some exposure for further gains.
For example,
- Say you are monitoring Bookmap’s liquidity levels to detect signs of fading momentum.
- Now, if large sell orders appear above the breakout level, it may indicate a reversal is coming.
How to Deal with False Breakouts
To protect yourself from false breakouts, you can use confirmation techniques. Start using multiple indicators like:
- Order flow,
- Volume, and
- Retests.
This will help you confirm if a breakout is real. For example, say a stock breaks resistance at $20. It then retests this level as new support before moving higher. This confirms the breakout is valid.
How to Manage Risk
By placing stop-loss orders slightly below breakout levels, you can minimize losses in case of a reversal. For example:
- For a breakout at $25, a trader sets a stop-loss at $24.80.
- This reduces the risk if the move fails.
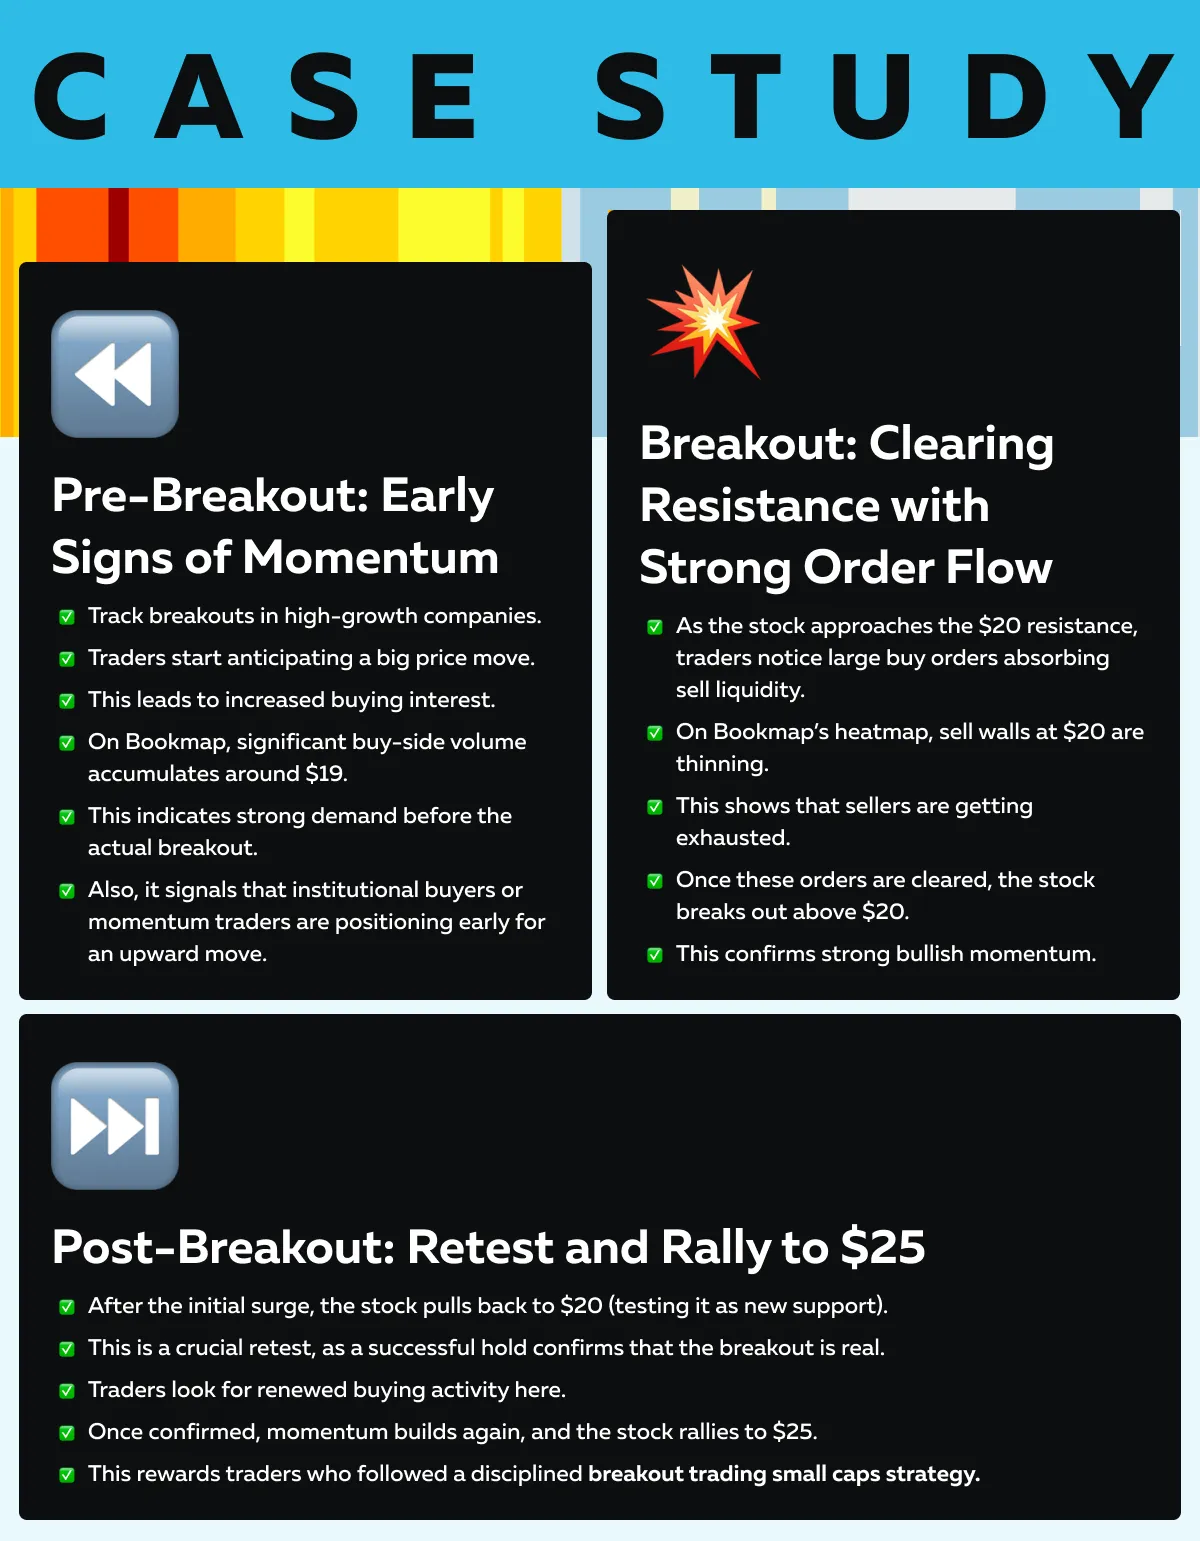
Case Study
Here’s a case study of a small-cap biotech stock breakout after FDA approval:
Conclusion
To successfully engage in momentum trading in small caps, you should focus on catalyst analysis. That’s because news events like earnings reports or FDA approvals often trigger momentum. Additionally, volume tracking is important, as unusual volume spikes indicate growing trader interest and potential breakout opportunities.
Additionally, monitor order flow to confirm whether a breakout is real by seeing the balance between buyers and sellers. To do this, you can start using our advanced market analysis tool, Bookmap. Using it, you can analyze liquidity levels and spot areas where price movements are likely to gain momentum.
However, through the heatmap, you can see resting orders, while real-time volume data confirms if buyers are aggressively pushing prices higher. This helps you refine your entries and avoid false breakouts. Discover breakout opportunities with Bookmap’s real-time order flow and liquidity tools.
Sign Up Now