See position size more clearly in real time.
Compare plans to access deeper market visibility for position size.
Education
August 6, 2024
SHARE
Smart Trading: How to Scale into a Trade

Smart trading is not about predicting the future. It’s about managing risks effectively. Most successful traders practice robust risk management strategies to limit their potential losses and optimize their overall portfolio returns.
“Scaling in stock trading” is an effective way to manage risk and maximize returns. This article will cover various scaling methods, including equal increments and percentage-based approaches, and explain how they can be applied in different market conditions.
Additionally, we’ll discuss the importance of defining clear objectives for scaling, such as minimizing market impact and capitalizing on price movements. We will also learn how to select scale-in points based on technical analysis and market sentiment using tools like support/resistance levels and trend confirmation signals.
Understanding Scaling: Concepts & Strategies
Scaling into trades is a strategic approach used by traders. It helps them manage exposure and increase the potential for returns by gradually entering positions rather than making a single, large investment. This method:
- Helps reduce the overall trading risk
and
- Allows traders to adjust their strategies based on market conditions.
Let’s have a look at the different scaling methods:
Method I: Equal Increments
Equal increments involve:
- Dividing the total desired investment into several equal parts
and
- Entering the market at different price levels.
This method is straightforward and helps to average out the entry price. Let’s understand its practical application better using a hypothetical example:
For example:
- Suppose a trader wants to invest $10,000 in a stock currently trading at $100.
- Instead of buying all at once, they decide to scale in with equal increments.
- They decided to buy:
- $2,000 worth of stock at $100,
- $2,000 worth of stock at $95,
- $2,000 worth of stock at $90,
- $2,000 worth of stock at $85, and
- $2,000 worth of stock at $80.
- This way, the average entry price is $90.
Method II: Percentage-Based Increments
In percentage-based increments, the trader increases their position by a certain percentage of the current market price. This method allows the investment to be adjusted dynamically according to market conditions. Further, traders must note that this approach:
- Reduces the average cost per unit over time
and
- Helps traders benefit from the lower prices.
Let’s see an example:
- Assume that a trader wants to invest in a cryptocurrency trading at $50.
- They decide to scale in by buying an additional 10% of their remaining capital at each 5% drop in price.
- Say the initial purchase occurred oat$1,000 at $50.
- If the price drops to $47.50 (5% drop), they buy $1,100 (10% of remaining capital).
- If the price drops further to $45.125 (another 5% drop), they buy $1,210.
- The trader continues this process as long as the price keeps dropping.
Method III: Volume-Based Increments
Volume-based increments involve scaling into trades based on trading volume rather than price levels. This strategy is often used in highly volatile markets where volume spikes may indicate significant price movements. Let’s see an example:
- A trader decides to invest in a stock based on volume spikes.
- They plan to invest a total of $10,000.
- They allocate their funds as follows:
- 20% of the capital when the volume increases by 50%,
- Another 20% when the volume increases by 75%,
- An additional 20% when the volume increases by 100%,
- Further 20% when the volume increases by 150%, and
- Final 20% when the volume increases by 200%.
How Can You Apply Each Method In Different Market Conditions?
| Bull Market | Bear Market | Volatile Market |
|
|
|
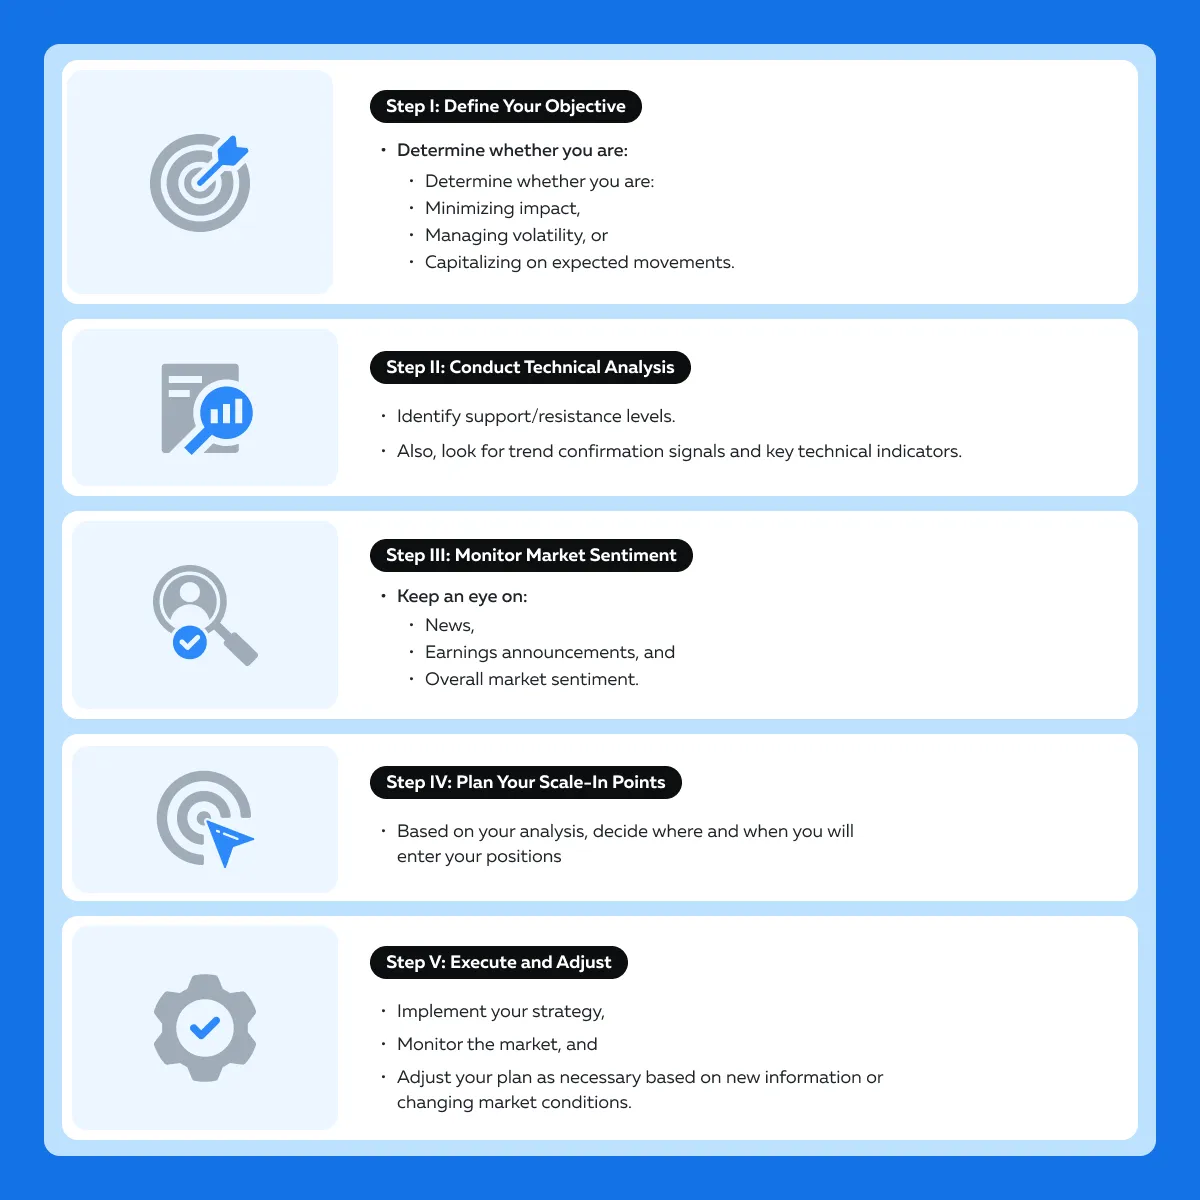
Setting Up Your Scaling Strategy
To establish a clear and effective scaling strategy, traders must:
- Thoroughly understand their objectives
and
- Develop a well-defined approach to selecting scale-in points.
When it comes to defining clear objectives for your scaling strategy, it is crucial to align your trading actions with your overall goals. Some common objectives include:
- Minimizing Market Impact
-
-
- Gradually entering positions to avoid significant price movements that can occur with large, single trades.
-
- Managing Volatility Exposure
-
-
- Reducing risk by spreading investments over time, especially in volatile markets.
-
- Capitalizing on Expected Price Movements
-
- Strategically entering positions based on:
- Anticipated market trends
- Strategically entering positions based on:
or
- Reactions to specific events.
It is pertinent to note that clear objectives help determine the appropriate scaling method and make disciplined trading decisions.
How to Select Scale-In Points Based on Technical Analysis and Market Sentiment?
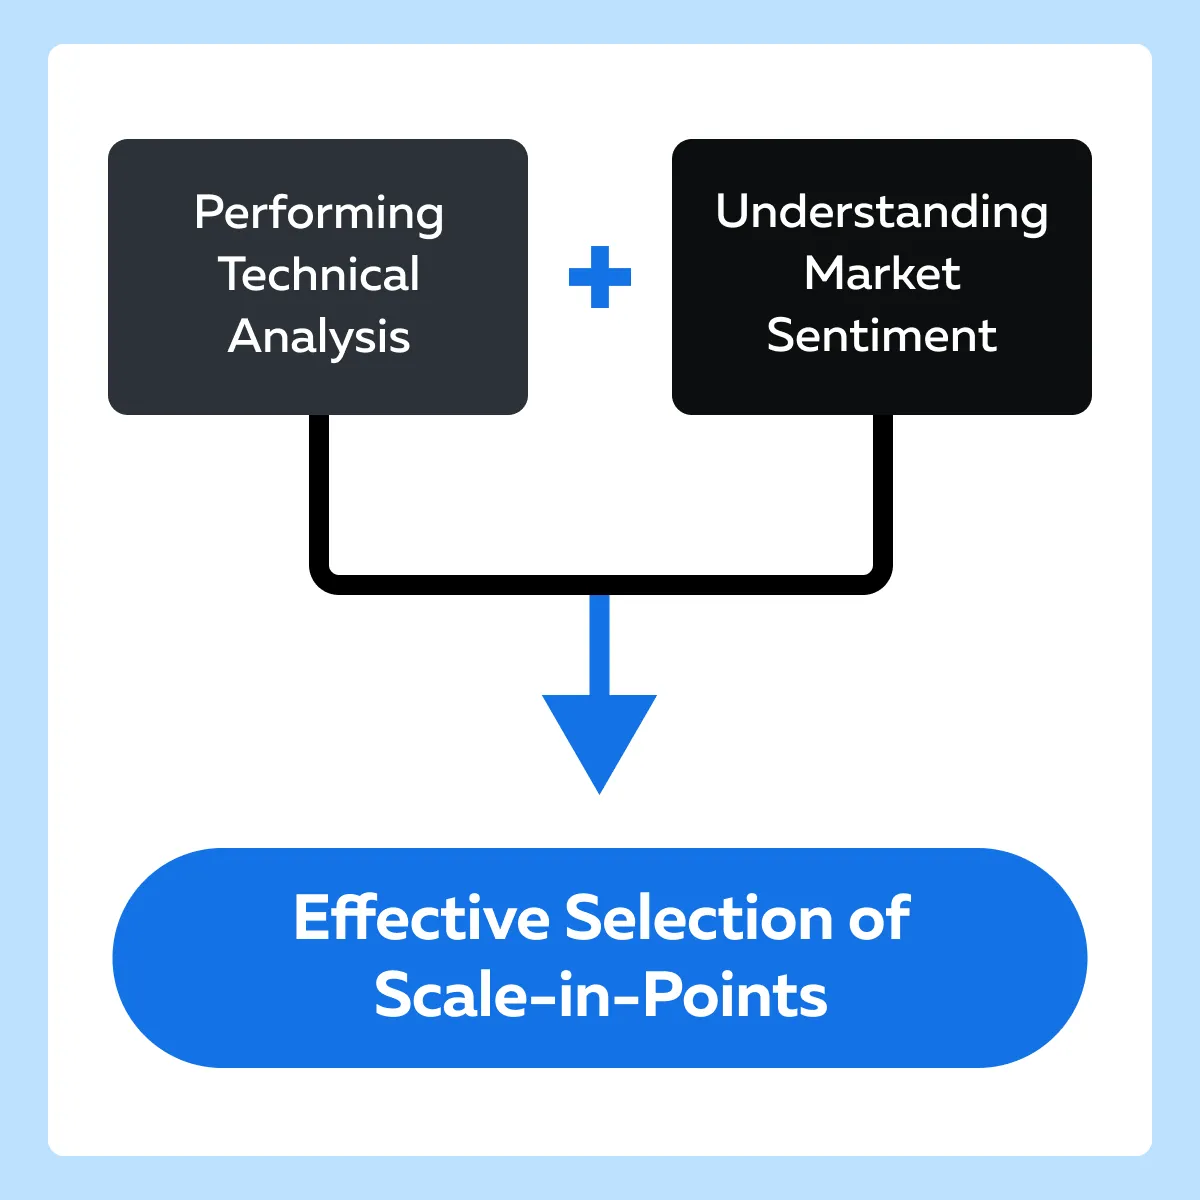
Selecting effective scale-in points involves a combination of technical analysis and understanding market sentiment. Let’s have a look at some key factors and examples to consider:
- Support/Resistance Levels
-
- Support is a price level where a stock tends to find buying interest
- Resistance is a level where selling pressure is expected.
- For example:
- A stock is trading in a range between $50 (support) and $60 (resistance).
- A trader looking to scale it can:
- Buy 20% of their position at $50,
- Buy another 20% if the price bounces off $50 again,
- Buy 20% more if the price breaks above $60 (resistance turning into support), and
- Continue scaling in as the stock moves up and tests new support levels.
- Trend Confirmation Signals
-
- Trend confirmation signals help confirm the direction of the market
- The following are some common indicators:
- Moving averages,
- Trendlines, and
- Momentum indicators (e.g., MACD, RSI).
- For example:
- A trader identifies an uptrend using the 50-day and 200-day moving averages (golden cross).
- To scale in, the trader decides to:
- Buy 25% of the position when the 50-day MA crosses above the 200-day MA.
- Buy another 25% if the price retraces to the 50-day MA and bounces off.
- Buy 25% more if the RSI (Relative Strength Index) indicates a bullish reversal from oversold conditions.
- Buy the final 25% if the MACD (Moving Average Convergence Divergence) histogram shows increasing bullish momentum.
- Reaction to Earnings Announcements or Significant News
-
- Earnings announcements and other significant news drastically affect stock prices.
- Most traders scale based on market reactions to these events.
- For example:
- A company is expected to release its quarterly earnings.
- A trader plans to scale in based on the outcomes.
- Let’s see how they plan to scale:
- Buy 30% of the position before the announcement (anticipating positive results).
- If earnings beat expectations and the stock jumps, buy 30% more on the first pullback after the initial surge.
- If the stock consolidates after the jump, buy another 20%.
- Buy the remaining 20% if the stock breaks out of the consolidation range on high volume.
How to Implement a Scaling Strategy in Live Markets
The plan serves as the foundation for implementing a scaling strategy. Traders must note that a well-defined plan helps ensure discipline and consistency in trading. Notably, a plan is distinct from “a strategy”, which includes more specific setups. See the graphic below showing what a plan outlines:
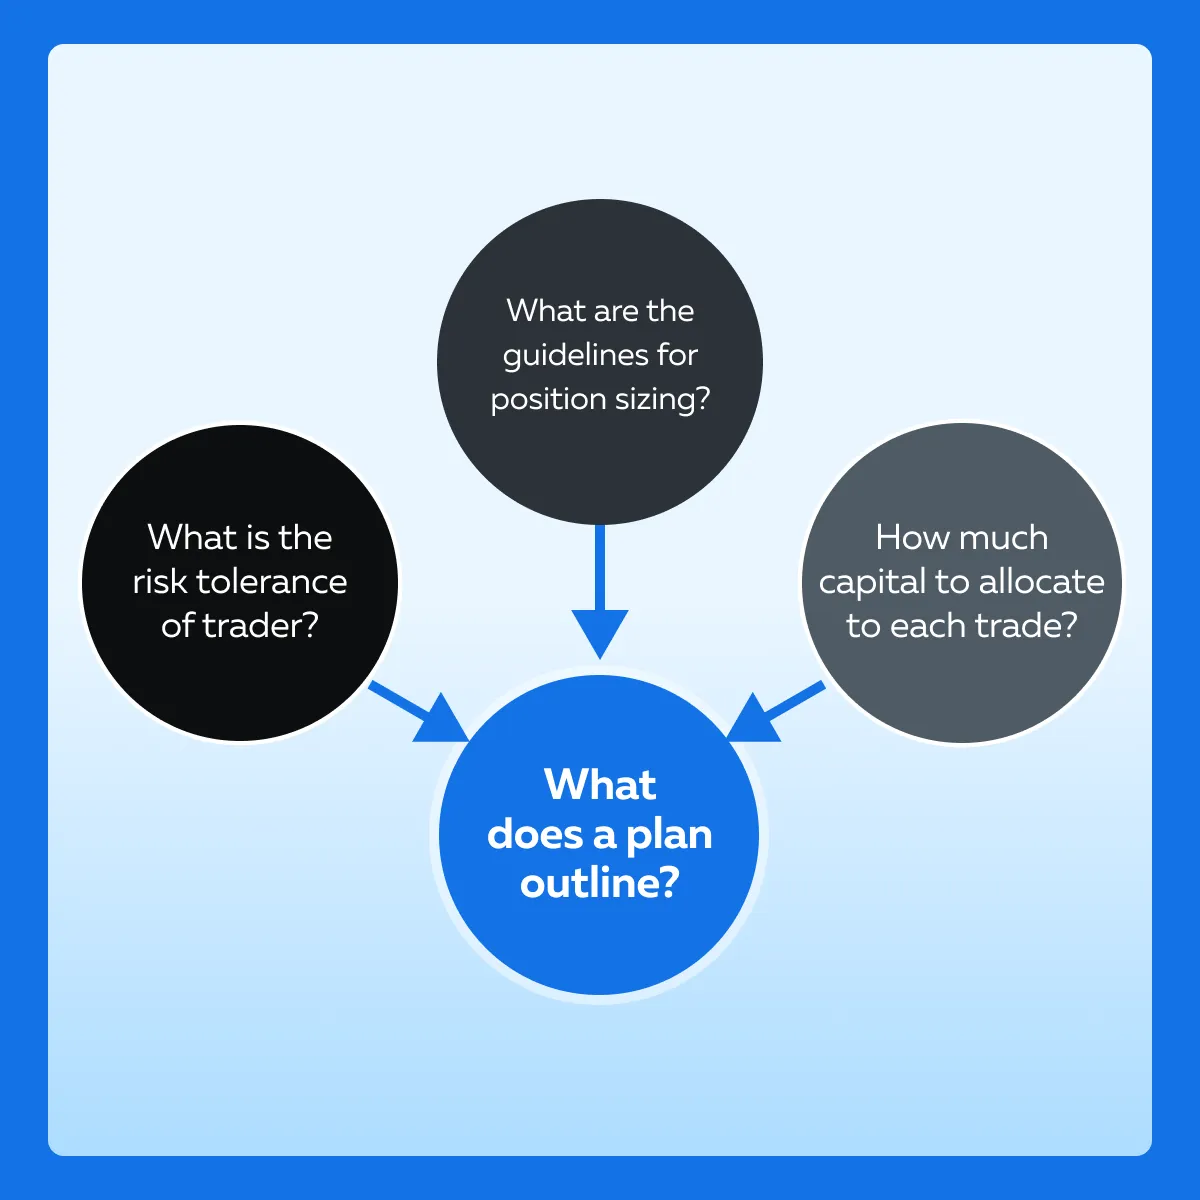
Let’s understand what a plan usually includes:
A) Risk Tolerance
Risk tolerance refers to the amount of loss a trader is willing and able to endure within their portfolio. The following are some of its common components:
- Percentage of Portfolio at Risk
- Decide what percentage of the total portfolio can be risked on any single trade.
- For example, a common rule is to risk no more than 1-2% of the total portfolio on one trade.
- Maximum Drawdown Limits
- Establish a maximum drawdown limit to avoid significant losses.
- This limit is the maximum loss from a peak to a trough in the portfolio value that a trader is willing to tolerate before taking action.
B) Matrix on How Much to Bid
This matrix determines the amount of capital to allocate to each trade based on various factors, such as:
- Risk tolerance
and
- Stock volatility.
Components:
- Initial Position Size
-
- Calculate the size of the initial position based on the:
- Risk per trade
- Calculate the size of the initial position based on the:
and
- Volatility of the stock.
- For instance, use the Average True Range (ATR) to adjust the position size according to the stock’s usual price movements.
- Incremental Additions
-
-
- Define how much to add to the position as the trade progresses and conditions meet specific criteria.
- For example, adding a certain percentage of the initial position when the stock retraces to a moving average or breaks through a resistance level.
-
- Scaling Points
-
- Identify key points for scaling into or out of positions.
- These points might be based on technical indicators, such as:
- Moving averages,
- Support and resistance levels, and
- Other signals.
What is a Strategy?
The strategy involves specific setups and market conditions. These setups dictate when and how to scale into trades. Commonly, it helps in adjusting position sizes based on volatility and includes:
- Technical analysis
and
- Market sentiment.
How Can Traders Determine Initial Position Size?
Determining the initial position size requires considering both the:
- Overall portfolio risk tolerance
and
- Specific volatility of the stock.
Let’s understand in detail:
| Overall Portfolio Risk | Stock Volatility |
| If a trader’s risk tolerance allows for a maximum of 2% of the portfolio to be risked on a single trade, the initial position size should be calculated accordingly. | Consider the stock’s typical price movements. If a stock typically moves 5% daily, the initial position size might need to be smaller to accommodate potential volatility. |
It is vital to recognize that the average true range (ATR) is an effective method for adjusting position sizes based on a stock’s volatility.
Let’s study the ATR formula:
Position Size=Risk Per TradeATR x Multiplier
Where:
- Risk per Trade = The dollar amount the trader is willing to risk on the trade
- ATR = The average true range of the stock
- Multiplier = A factor to adjust the position size based on the desired risk level. Commonly, this might be set between 1 and 2.
To understand the concept better, read this hypothetical example:
- Assume the trader has a $100,000 portfolio.
- They want to risk 2% per trade, equating to $2,000.
- Suppose the ATR of the stock is $2.
- The trader chose a multiplier based on risk preference; in this case, it is 1.5.
- Position Size=$2,000$2 x 1.50=666.67
- This means the initial position size should be approximately $667 worth of the stock.
Some Popular Guidelines for Adjusting Position Sizes
| Reduce Position Size in High Volatility | Increase Position Size in Low Volatility | Reassess Regularly |
|
|
and
|
Also, it is crucial to acknowledge that based on market conditions, scaling can evolve into two distinct strategies:
- Catching a Reversal and
- Scaling into a Continuation Pattern.
Let’s understand them in detail:
Strategy I: Catching a Reversal
In a reversal strategy, traders aim to capitalize on the change in trend direction. To practice this strategy, traders must:
- Clearly define risk parameters, such as setting stop-loss orders below significant support levels,
- Enter the market with a small position as the reversal pattern unfolds, and
- Increase the position as the new trend confirms.
For example:
- A trader identifies a potential bottom in a stock forming a double-bottom pattern.
- Now, they decide to:
- Enter 20% of the intended position at the first sign of a bounce from the second bottom.
- Add another 30% once the price breaks above the pattern’s neckline.
- Continue adding to the position as the stock confirms the new uptrend by forming higher highs and higher lows.
Strategy II: Scaling into a Continuation Pattern
In a continuation pattern, traders add to their position as the trend continues. This involves moving stops up to lock in profits and reduce risk. To practice this strategy, traders must:
- Use technical analysis to determine scale-in points, such as:
- Breakouts above resistance levels
or
- Pullbacks to support levels.
- Move the stop-loss order to the new support level as the trend continues to protect gains.
For example:
- A trader is already in a stock that has been in an uptrend and forms a bull flag pattern.
- They can decide to:
- Add to the position as the price breaks out above the flag pattern on increased volume.
- Move the stop-loss order to the lower boundary of the flag pattern to protect gains.
How to Plan and Execute Incremental Entries?
Numerous studies have shown that market events, such as earnings reports or product launches, provide opportunities for scaling into trades. Let’s understand how you can scale into a technology stock around a product launch:
- Before the Launch: Start with a small position anticipating a positive reaction.
- After Initial Reaction: Add to the position based on the market’s reaction to the announcement or early sales data.
- Technical Analysis: Use support/resistance levels to time additional entries.
Hypothetical example:
-
- A trader plans to invest in a tech company launching a new product.
- They might:
- Buy 20% of their intended position a week before the product launch.
- If the product launch is well-received and the stock breaks above a key resistance level on high volume, buy another 30%.
- If the stock pulls back to the new support level and holds, buy an additional 30%.
-
- Monitor the stock and add the final 20% if:
- Positive early sales data is reported
- Monitor the stock and add the final 20% if:
and
- The stock continues to rise.
How to Use Technical Analysis for Timing?
Traders use several technical analysis tools to guide incremental entries. Some of them are listed below:
- Breakouts above resistance levels,
- Rebounds from support levels, and
- Volume analysis.
Let’s learn the practical usage through a hypothetical example:
- Assume that a stock breaks above a significant resistance level at $100 on high-volume
- A trader enters an initial position as the stock breaks above $100.
- They add to the position if the stock pulls back to $100 and rebounds.
- They continue adding if the stock forms higher highs and higher lows (which confirm the uptrend).
How to Use Market Indicators?
To enhance the scaling process, market indicators such as volume analysis and momentum oscillators are used frequently. Let’s see why:
| Volume Analysis | Momentum Oscillators |
|
|
Hypothetical Example:
- A trader uses the MACD to confirm the momentum of a stock.
- They enter an initial position as the MACD line crosses above the signal line.
- Add to the position if the MACD histogram shows increasing bullish momentum.
- Use volume analysis to confirm strong buying interest during these entries
Case Studies: Scaling Strategies
Let’s analyze a detailed scenario of scaling into a position in a high-growth tech stock, focusing on an:
- Initial conservative entry
and
- Subsequent additions as the stock confirms an upward trend continuation.
Background
- A trader is interested in a rapidly growing tech stock, ABC Inc.
- The company has recently announced significant expansion plans.
- The announcement has sparked increased interest and trading volume.
Initial Entry Point
- The stock price has just broken out above a key resistance level of $150.
- The trader buys a smaller-than-usual position.
- They invest $5,000 out of a total $100,000 portfolio, representing 5% of their portfolio.
Adding to the Position
-
- The stock continues to trend upward.
- This trend is confirmed by higher lows and robust trading volumes.
- The trader adds to the position at each retracement to a significant moving average, such as the 21-day EMA.
First Addition
- After the initial breakout, the stock retraces to the 21-day EMA at $155.
- The price rebounds off the 21-day EMA, showing continued strength.
- The trader buys an additional $5,000 worth of shares, increasing their position to $10,000.
Second & Third Addition
-
- The stock continues to rise.
- It makes higher highs and then retraces to the 21-day EMA, now at $160.
- The stock once again bounces off the 21-day EMA.
- The trader buys another $5,000 worth of shares, increasing their position to $15,000 (third purchase).
Protecting Gains with Stop-Loss Orders
- With each additional purchase, the trader raises their stop-loss order to just below the latest significant low to protect gains.
Stop-Loss Adjustments
| After Initial Entry | After First Addition | After Second Addition |
| Set a stop-loss at $145 (below the initial breakout point). | Adjust the stop-loss to $150 (below the latest significant low after the first addition). | Adjust the stop-loss to $155 (below the latest significant low after the second addition). |
Adjusting Position Sizes
- The trader adjusts the size of new positions based on the:
- Remaining risk capacity
and
- Updated assessment of volatility.
Calculating Position Size
- The trader’s initial risk tolerance is 2% of the $100,000 portfolio, equating to $2,000.
- If the ATR (Average True Range) is $5, the position size for the next entry can be calculated using a multiplier of 1.5:
- Position Size=$2,000$5 x 1.50=266.67
Monitoring Price Action and Volatility
| Volatility Assessment | Market Sentiment |
| As more data becomes available, the trader continuously reassesses volatility using the ATR. | The trader stays updated with news about ABC Inc.’s expansion plans and market sentiment. |
Conclusion
Scaling strategies in stock trading offer significant benefits. These strategies enable traders to manage risk more effectively and capitalize on market trends gradually. By starting with a smaller position and adding to it as the stock confirms its upward trend, traders minimize initial exposure and adjust their positions based on new information and market conditions.
This method also helps to protect gains by strategically placing and adjusting stop-loss orders. It is essential to note that the key to success with scaling strategies is discipline and systematic planning. Traders must define clear risk tolerance, set precise entry and exit points, and continuously monitor market indicators.
Overall, scaling strategies provide a structured approach to trading and help traders optimize their returns while keeping risks under control. Do you wish to gain a competitive edge? Start trading with Bookmap, an advanced market analysis tool. Read how to do it using our exclusive step-by-step guide.
Sign Up Now