See unusual options activity more clearly in real time.
Compare plans to access deeper market visibility for unusual options activity.
Stocks
August 9, 2024
SHARE
Spotting Unusual Options Activity: Predicting Stock Movements for Trading Success

The popular adage, ‘Unusual Options Activity (UOA) can uncover hidden opportunities,’ frequently echoed in veteran trading circles, holds true. By diligently monitoring Unusual Options Activity (UOA), traders can gain insights into potential market-moving events and position themselves ahead of significant price movements.
This proactive approach allows them to anticipate and capitalize on opportunities others might miss, setting them apart from the rest. In this article, we will delve into the concept of Unusual Options Activity (UOA) and explore how traders can leverage it to forecast stock movements and formulate trading strategies.
You will learn what UOA is and why it is an important indicator. Additionally, you will explore various methods to identify UOA, such as monitoring volume spikes, open interest changes, and large trades.
Moreover, we will explain how to analyze UOA by focusing on the differences between volume and open interest and understanding the put/call ratio. Throughout the article, we will use several case studies to illustrate how UOA can signal upcoming price movements. Let’s begin.
What is an Unusual Options Activity?
Unusual Options Activity (UOA) refers to trading volume in options contracts (calls or puts) that significantly deviates from the typical daily volume. This usually occurs when an unusually high number of options contracts are traded compared to what is typically seen for that stock. UOA suggests that something significant or unusual might be happening with the stock.
This deviation is largely a result of several factors, such as:
- Upcoming news
- Anticipated market-moving events
- Insider information drives traders to buy or sell options at a much higher rate than usual.
Why is Unusual Options Activity (UOA) Important for Traders?
Unusual Options Activity is a crucial indicator for traders because it signals potential upcoming movements in a stock’s price. This activity often reflects the actions of informed traders or institutions who might have advanced knowledge or insights about upcoming events, such as:
- Earnings reports
- Mergers
- Acquisitions, or
- Other significant announcements.
By monitoring UOA, traders can gain insights into future price movements and make more informed trading decisions. Let’s better understand the application of UOA through an example:
Consider a well-known stock like ABC Inc. Suppose there is a sudden surge in the volume of call options for ABC Inc. on a particular day. Normally, ABC Inc.’s call options see around 20,000 contracts traded daily. However, on this day, the volume spikes to 100,000 contracts, which is five times the average volume.
- Before the Surge: The stock is trading steadily at $150 per share, with no significant news affecting its price.
- UOA Detection:
- Traders notice the unusual volume in call options.
- This deviation indicates that investors are betting on the stock’s price increase.
- Subsequent Event
- A few days later, ABC Inc. announces a groundbreaking new product or a highly positive earnings report.
- Price Movement
- Following the announcement, ABC Inc.’s stock price jumps from $150 to $170 per share.
Here, we can clearly observe that the UOA in ABC Inc.’s call options served as an early indicator of the upcoming positive news and the consequent price increase. Traders who chose to respond to the UOA positioned themselves to benefit from the stock’s rise.
How to Identify Unusual Options Activity

Most traders identify Unusual Options Activity by monitoring:
- Monitoring trading volume spikes
and
- Analyzing open interest.
By using these metrics, traders can gain insights into potential stock price movements. These methods usually indicate upcoming events or shifts in market sentiment. Let’s study these key indicators or methods of detecting unusual options activity in detail:
Method I: Monitoring Volume Spikes
Volume spikes represent a sudden, significant increase in the number of options contracts traded compared to the historical average. Large spikes signal substantial individual trades that stand out from typical trading activity. By identifying a volume spike, you can predict future price movements. Let’s see how:
- Monitoring Daily Activity: Keep an eye on the daily trading volumes of options for specific stocks.
- Comparing with Historical Averages: Compare the current trading volumes with historical averages to spot any significant spikes.
- Assessing Context: If there is a sudden increase in volume without any obvious news, it might suggest that informed traders anticipate a significant price movement.
Method II: Analyzing Option Chains
Open interest changes refer to notable increases or decreases in the number of outstanding options contracts. To spot these changes, you must focus on specific strike prices and expiration dates where there is a notable deviation from the average trading volumes. To gauge strong interest or expectation of a price move, specifically, look for strikes and expirations with:
- Unusually high volumes
and
- Significant changes in open interest.
Now, let’s read through an easy step-by-step guide on how you can examine an option chain:
- Select the Stock: Choose a stock you are interested in, such as ABC Inc.
- Access Option Chain Data: Use a trading platform or financial website to access the option chain for ABC Inc.
- Identify High Volume: Look for strike prices and expiration dates with significantly higher-than-average volumes.
For example, if the average volume for ABC Inc.’s options is 10,000 contracts, but you see 50,000 contracts traded at the $160 strike price expiring in two weeks, this is unusual. Now, perform the following steps:
- Check Open Interest:
- Examine the open interest at these strike prices and expirations.
- A substantial increase in open interest alongside high volume suggests new positions are being created.
- Analyze the Context:
- Consider the broader market context and any upcoming events, such as
- Earnings reports
- Product launches, or
- Economic data releases.
- Consider the broader market context and any upcoming events, such as
- Make an Informed Decision:
- Based on the UOA, decide if it aligns with your trading strategy.
- For example, if there’s a high volume of call options at a specific strike, it might indicate bullish sentiment.
Now, after performing the above steps, let’s assume you noticed the following:
- $160 strike call options expiring in two weeks have a volume of 50,000 (average is 10,000).
- Open interest has increased from 20,000 to 70,000.
- No major news has been released yet, but the earnings report is due in a week.
Finally, you decide the following:
- High volume and open interest increase at the $160 strike suggest bullish sentiment.
- You decide to buy call options at the $160 strike, anticipating a price rise following the earnings report.
How to Analyze Unusual Options Activity
Analyzing unusual options activity entails studying sudden spikes in trading volume and changes in the number of active options contracts. By understanding these patterns, traders can get information about future stock price movements. Some key metrics that can help you determine market sentiment and predict possible price changes are:
- Comparing Volume vs. Open Interest
and
- The put/call ratio.
Let’s study them in detail:
- A) Using Volume vs. Open Interest to Analyze UOA
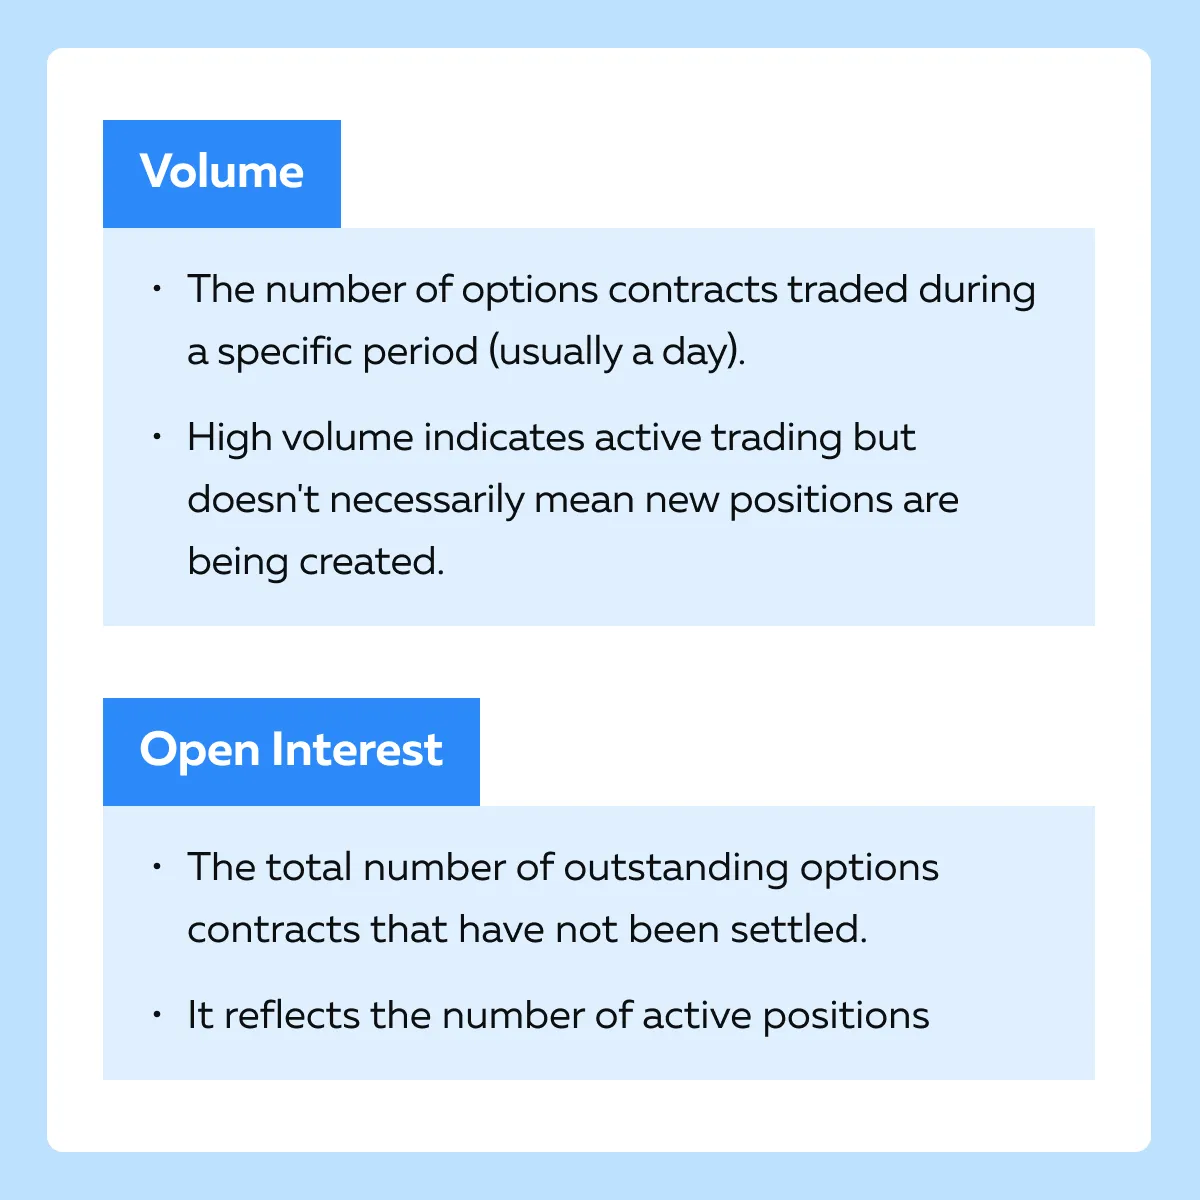
How to Assess Unusual Options Activity
By monitoring volume spikes, you can spot sudden increases in volume. Usually, this indicates unusual activity and potential interest from traders anticipating price movement. Also, a significant increase in open interest, especially alongside high volume, indicates that new positions are being opened, signaling strong market interest. Let’s better understand this through an example:
- Stock: XYZ Corporation
- Normal Volume and Open Interest: Average daily volume of 5,000 contracts and open interest of 10,000 contracts.
- Observed Activity:
- On a particular day, the $50 strike call options have a trading volume of 20,000 contracts.
- Open interest increases from 10,000 to 25,000 contracts over a few days.
- Interpretation
- The significant increase in open interest, combined with high trading volume, suggests that many new positions are being opened.
- This strong market interest indicates that traders expect XYZ Corporation’s stock price to rise above $50 soon.
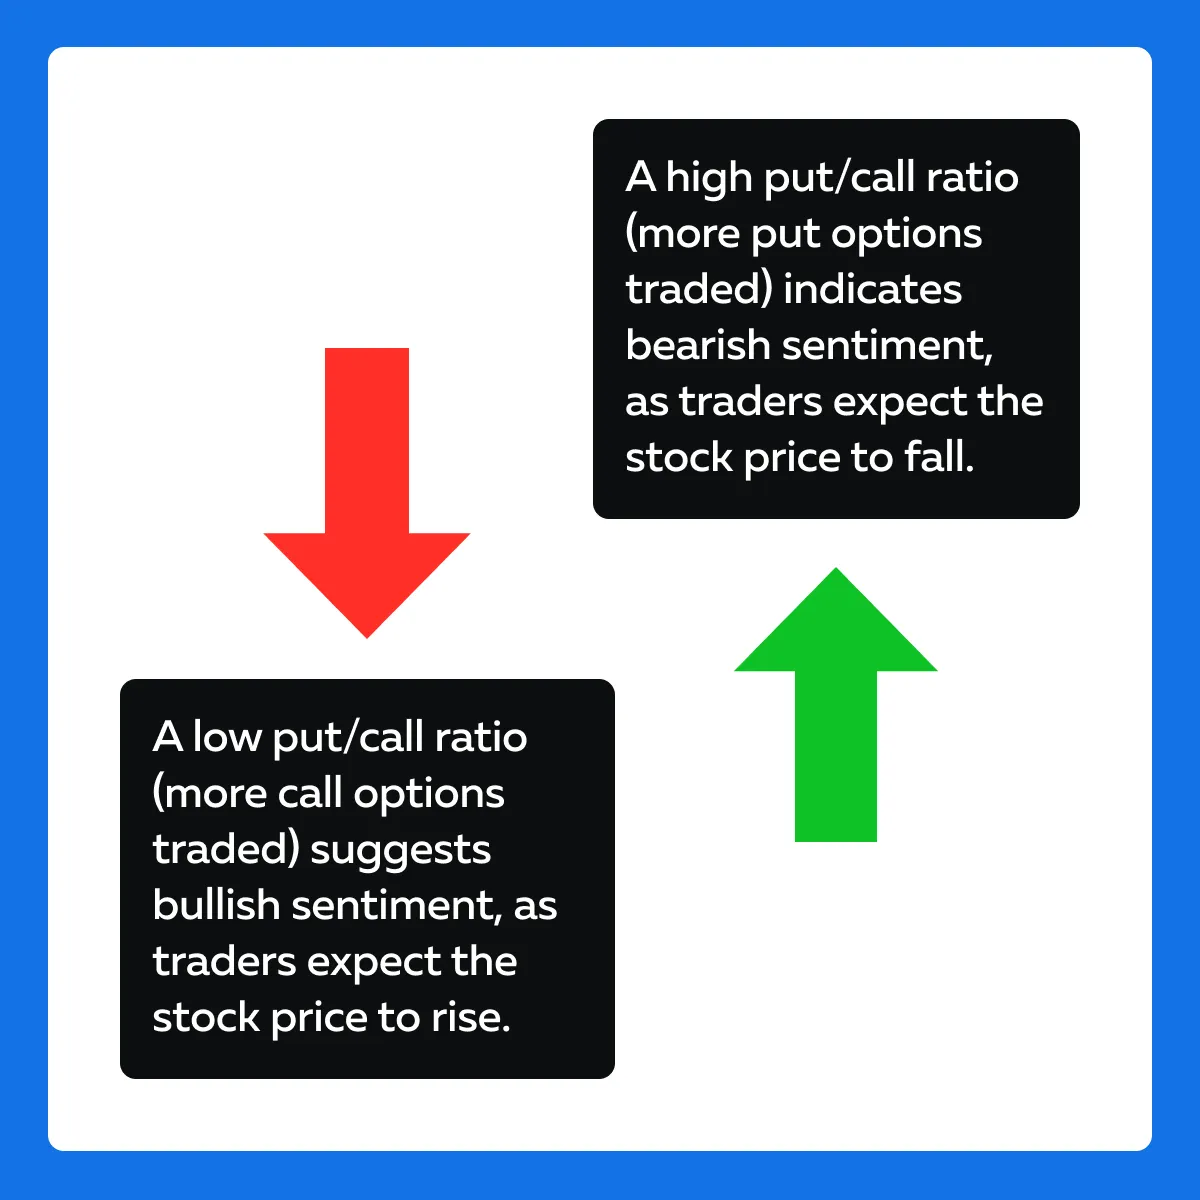
- B) Using the Put/Call Ratio to Analyze UOA
The put/call ratio is the ratio of the trading volume (or open interest) of put options to call options. It is used to gauge market sentiment. See the graphic below to understand its significance:
Let’s understand its practical application better through an example:
- Stock: ABC Inc.
- Normal Put/Call Ratio: Historically, the ratio hovers around 0.7.
- Observed Ratios:
- On a given day, the put/call ratio drops to 0.3, indicating a significant increase in call option trading.
- Over the next week, the stock price rises by 10%.
- Interpretation:
- The low put/call ratio indicated bullish sentiment among traders who are expecting ABC Inc.’s stock price to increase.
- This surge in call options trading and the subsequent rise in the stock price align with the bullish expectations suggested by the low put/call ratio.
Case Studies: Unusual Options Activity and Stock Movements
It is worth mentioning that traders can gain valuable insights into potential price movements by carefully analyzing:
- Volume spikes
- Open interest changes, and
- Market sentiment.
Let’s understand the concept better through case studies:
Case Study 1: Pre-Earnings Announcements
Let’s consider a company, ABC Inc. The earnings announcement date of the company is August 15. Assume an unusual options activity time frame of about two weeks before the earnings announcement. Now, upon analysis, we found the following:
- The trading volume for the $150 strike call options increases dramatically from an average of 5,000 contracts to 25,000 contracts.
- Open interest for the same strike rises from 10,000 to 35,000 contracts.
- The spike in call option volume and open interest suggests that traders are expecting positive news.
Outcome:
| Earnings Report | Stock Movement |
| On August 15, ABC Inc. reports significantly higher-than-expected earnings, driven by robust sales of a new product. | Following the announcement, ABC Inc.’s stock price jumps from $145 to $170 within two days. |
Interpretation:
- The unusual activity in the $150 call options indicated bullish sentiment among traders who anticipated positive earnings.
- This foresight was validated by the substantial price increase following the earnings announcement.
Case Study 2: Mergers and Acquisitions
In this example, consider a hypothetical company, Green Energy Corp. (GEC). There are market rumors that a major competitor, Solar Power Inc. (SPI), is interested in acquiring GEC. Assume the Unusual Options Activity (UOA) time frame of one month before the rumored acquisition announcement.
Now, upon observation, we found the following:
- The trading volume for the $50 strike call options surges from an average of 3,000 contracts to 20,000 contracts.
- Open interest at this strike increases from 5,000 to 30,000 contracts.
- The unusual spike in call option activity suggests that traders are positioning themselves for a potential acquisition.
- They are expecting GEC’s stock price to rise if the deal goes through.
Outcome:
| Acquisition Announcement | Stock Movement |
| Three weeks later, SPI announced its intention to acquire GEC at a premium, valuing GEC’s stock at $55 per share. | GEC’s stock price jumps from $45 to $54 on the day of the announcement. |
Interpretation:
- The significant increase in call option volume and open interest at the $50 strike price indicated that traders were anticipating the acquisition.
- When the acquisition was announced, the stock price reacted positively and aligned with the traders’ expectations.
How to Create Trading Strategies Based on Unusual Options Activity
It is essential to note that by tracking unusual options activity, traders can develop strategies that align with potential significant stock movements. Whether following smart money or employing options strategies like straddles and strangles, understanding unusual options activity (UOA) can significantly enhance trading decisions and profitability.
Let’s study some popular strategies that you can follow to create trading strategies based on UOA:
Strategy I: Following the Smart Money:
This strategy involves tracking unusual options activity to follow the trades of large institutions or “smart money” that may have advanced knowledge or insights about upcoming stock movements.
For Example,
-
- Say there is a hypothetical stock: Global Tech Ltd. (GTL)
- A trader notices an unusually large purchase of $100 strike call options expiring in one month.
- The volume for these call options spikes from an average of 1,000 contracts to 20,000 contracts in one day.
- The trader infers that an institution might be positioning for a significant upward movement in GTL’s stock price.
- The trader buys the $100 call options, aligning their trade with the large institutional activity.
- A week later, GTL announced a major new product launch.
- The stock price jumps from $95 to $110.
- The call options significantly increase in value, which provides substantial profit for the trader.
Strategy II: Straddle and Strangle Strategies:
To begin with, let’s understand their meanings:
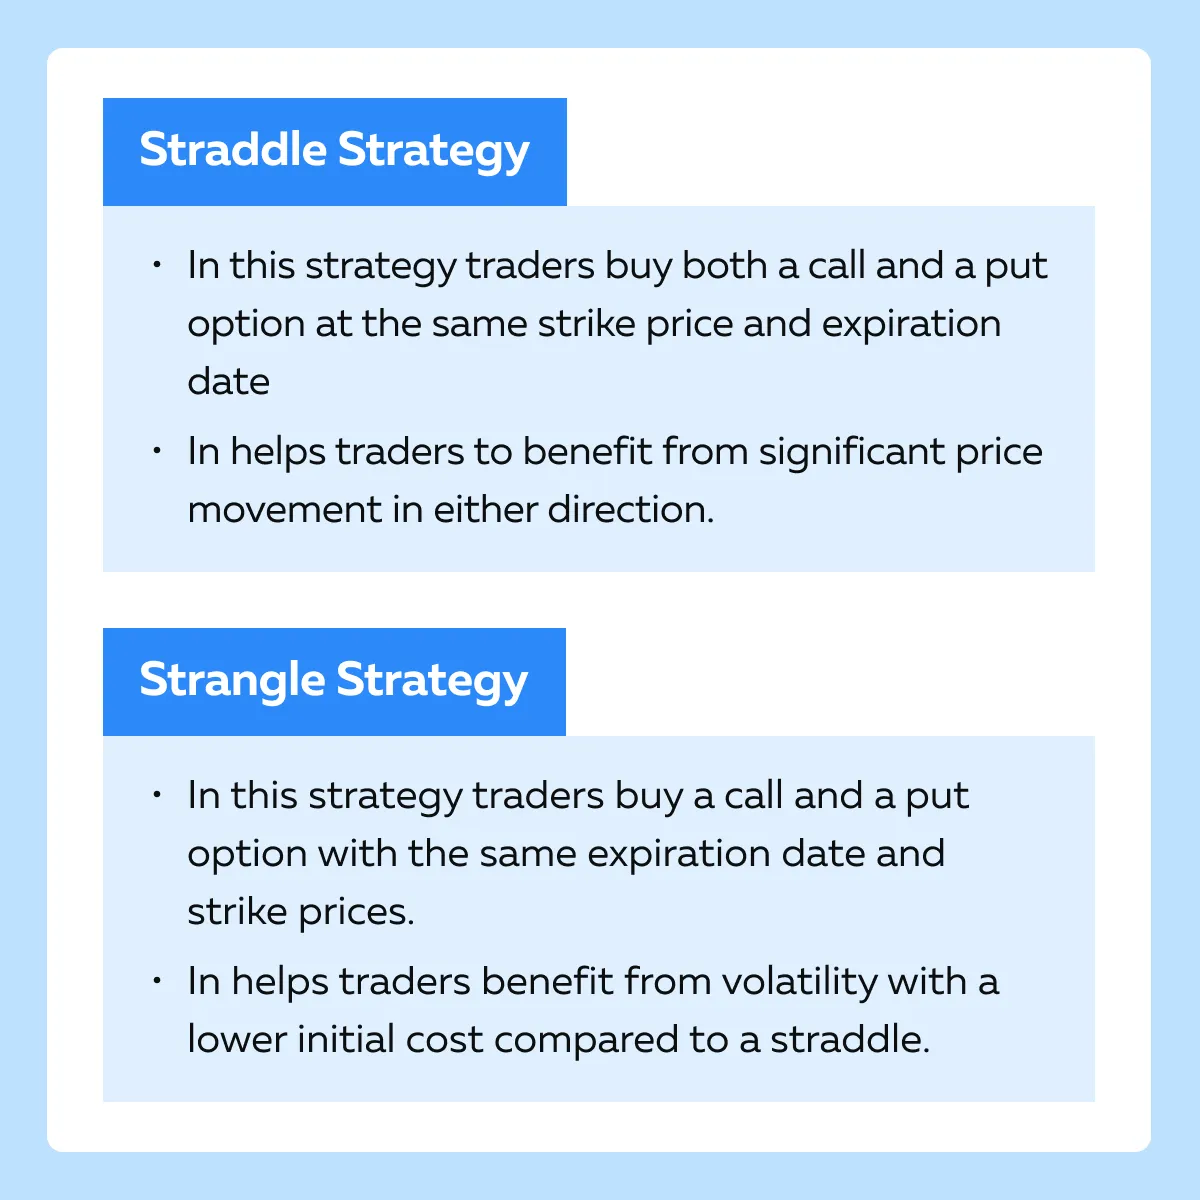
Now, let’s understand both these strategies through some hypothetical examples:
| Aspects | Scenario – Straddle Strategy | Scenario – Strangle Strategy |
| Stock | BioPharma Inc. (BPI) | FinTech Innovations (FTI) |
| Unusual Options Activity |
|
|
| Trade Implementation |
|
|
| Outcome | FDA Decision
|
News Event
|
Conclusion
Most traders gain an edge in the market by understanding and leveraging unusual options activity (UOA). That’s because by identifying sudden spikes in options volume and significant changes in open interest, traders can anticipate potential stock movements. These patterns often indicate that informed investors expect substantial price changes. Additionally, analyzing the put/call ratio helps gauge market sentiment, which further guides trading decisions.
Furthermore, by following large trades, employing strategies like straddles and strangles, and closely monitoring unusual activity, traders can better position themselves for profitable opportunities. This approach not only helps in predicting future volatility but also in making more informed and strategic trades. For more insights on market data and trading strategies, visit our article on market data feeds.
Sign Up Now