See market activity more clearly in real time.
Compare plans to access deeper market visibility for market activity.
Education
June 3, 2025
SHARE
Stops and Icebergs: How to Detect Hidden Orders Using MBO Data
In fast-moving futures markets, what you don’t see can hurt you. Sudden spikes in price, unexpected reversals, and failed breakouts often leave traders scratching their heads. More often than not, these events are driven by stop orders triggering in clusters, or iceberg orders absorbing liquidity below the surface.
Most traders never see these patterns—because they’re not visible with standard market data. That’s where Market-by-Order (MBO) data comes in.
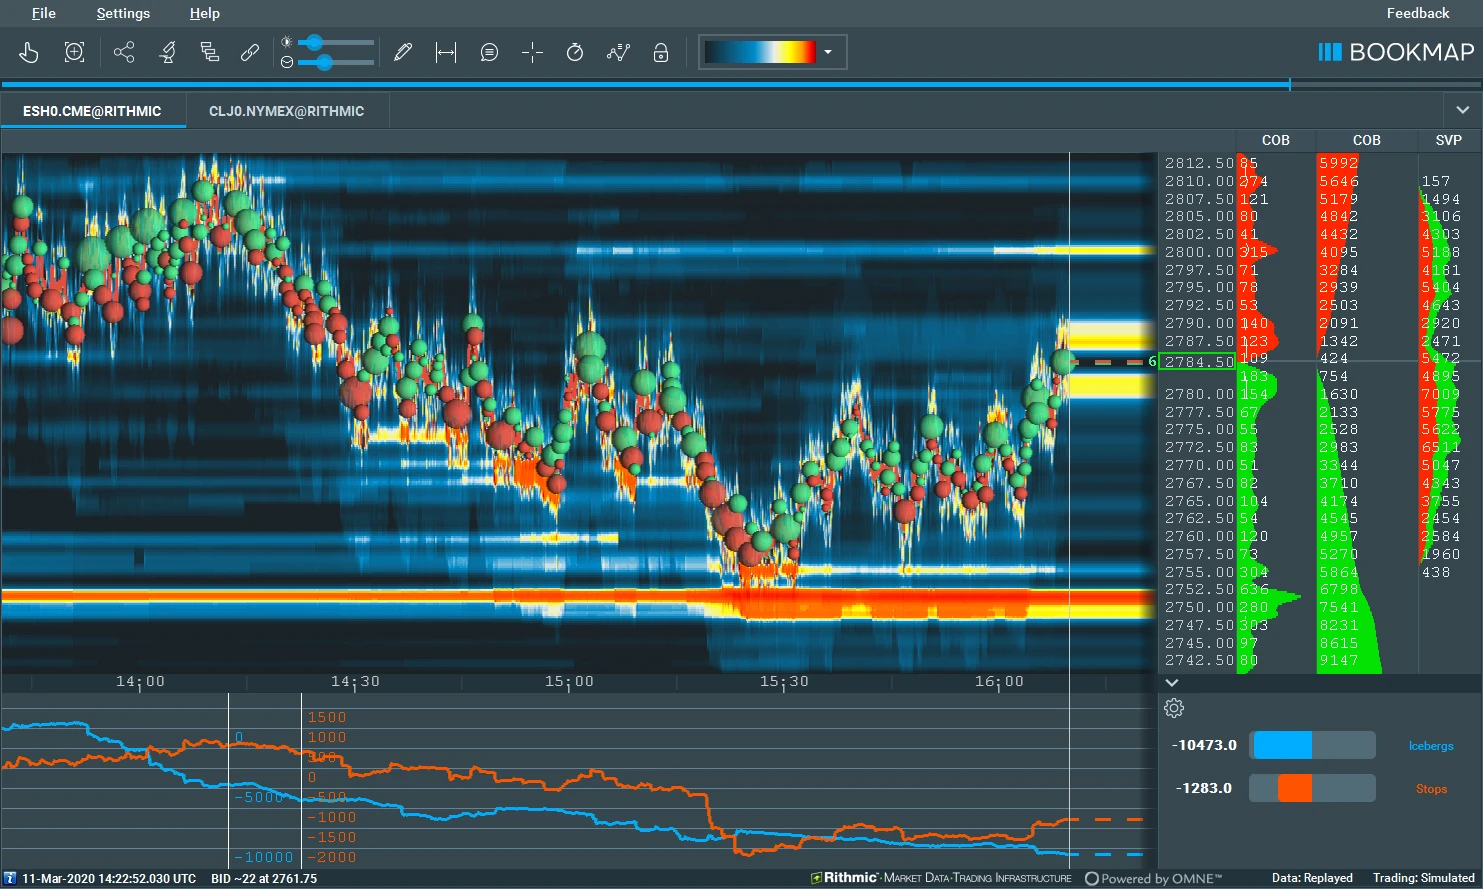
This article explores how stop and iceberg orders shape price behavior, why they matter to active traders, and how you can use Bookmap’s visualization tools to detect them in real time.
What Are Stop and Iceberg Orders?
Stop Orders: Volatility Triggers
Stop orders are instructions to buy or sell once price reaches a certain level. They’re often used for risk management—traders place them to exit losing positions. But when stop orders cluster around a key level and trigger together, the result is a stop run: a flurry of market orders that pushes price quickly through an area.
This kind of move may be followed by a reversal if the run exhausts liquidity, or by continuation if new buyers/sellers step in.
Understanding where stops are likely to sit—and when they’ve been triggered—helps traders:
- Anticipate breakout behavior
- Spot false breakouts or exhaustion moves
- Time entries after a volatility spike
Iceberg Orders: Hidden Intent
An iceberg order is a large limit order broken into smaller chunks, only a portion of which is visible in the order book. Once the visible part is filled, the next slice appears. This masks the trader’s full size and intent.
Institutions use iceberg orders to:
- Accumulate or distribute large positions quietly
- Provide passive liquidity at key levels
- Absorb aggressive order flow without signaling their presence
If you can detect iceberg activity, you may spot hidden zones of interest where price is being defended or accumulated.
Why You Can’t See These Patterns with Standard Data
Most trading platforms rely on Market-by-Price (MBP) data, which aggregates all limit orders at each price level. It tells you how many contracts are resting at a level, but not:
- Who placed them
- Whether they’re part of a hidden iceberg
- If a trade was the result of a stop trigger
Without MBO data, a stop run just looks like a surge in volume. An iceberg just looks like normal resting liquidity. You’re missing the structural dynamics behind the move.
With Market-by-Order (MBO) data, you get:
- A record of each individual order
- Life cycle events (submit, modify, cancel, execute)
- The ability to identify hidden order types
How Bookmap Detects Stops and Icebergs
Bookmap offers two specialized indicators that run on MBO data to detect and display stop and iceberg activity:
Stops & Icebergs Sub-Chart
This sub-chart plots detected stop and iceberg executions below the main chart. It gives:
- Color-coded bars for each type
- Historical recomputation to capture missed events
- Filters by order size or execution conditions
This makes it easier to spot clusters of stop runs or ongoing iceberg participation, especially when used alongside volume delta or liquidity tracking tools.
See the Knowledge Base entry for setup and use cases.
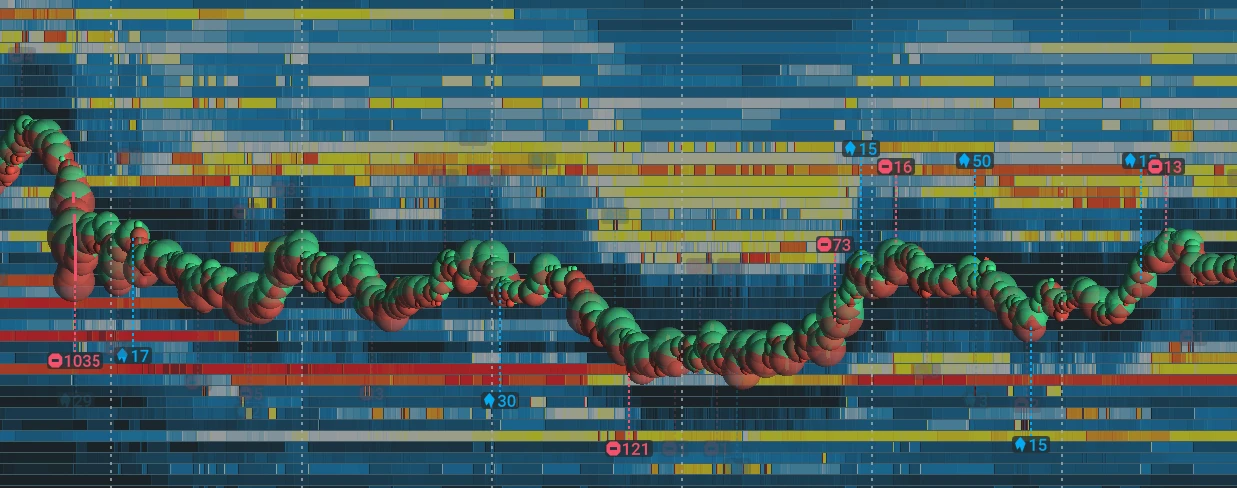
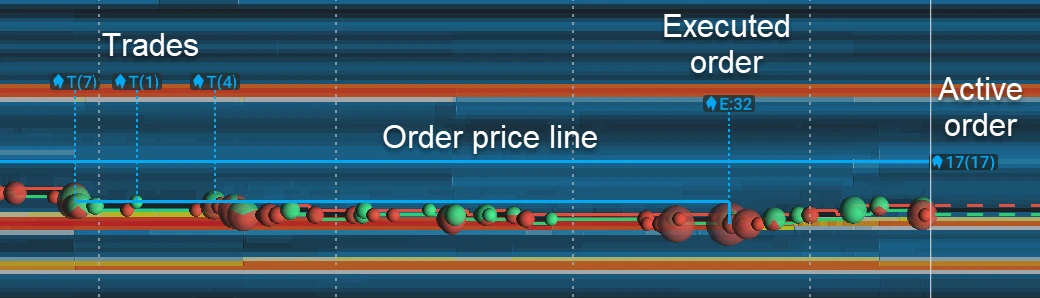
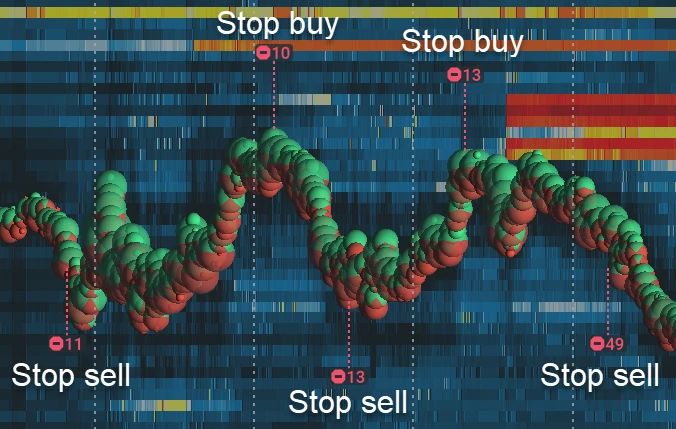
Stops & Icebergs On-Chart
This overlay places icons directly on your heatmap where stops or icebergs were detected. It shows:
- Stop run direction and size
- Iceberg execution points
- Labels and directional arrows
Combined, these tools help contextualize aggressive and passive activity and clarify what’s actually moving price.
How Traders Use Stop and Iceberg Detection in Context
Detection alone isn’t the goal—it’s interpretation in real-time context that gives you an edge. Here’s how traders apply it:
Anticipating Fakeouts
Let’s say price pushes through prior resistance, triggering a stop run. But instead of holding, price quickly reverses. If an iceberg appeared at that breakout level and absorbed the flow, that’s a clue the breakout lacked conviction. Traders might fade the move or wait for a retest.
Spotting Hidden Accumulation
You see multiple iceberg fills at the same price, even while price holds steady. That may be a signal a larger player is building a position. When aggressive buying follows shortly after, that can signal the start of a directional move.
Confirming Exhaustion
A strong move ends in a sweep of stops into an iceberg wall, with aggressive volume drying up. That’s often a sign of short-term exhaustion—useful for timing entries or tightening stops.
What You Need to Use These Tools
The Stops & Icebergs indicators only work with MBO-capable data feeds, such as:
- BookmapData CME
- Rithmic
You’ll need a Global or Global+ Bookmap license to use these tools. Once installed, they integrate seamlessly into your chart layout.
Conclusion
Markets aren’t just about price—they’re about intent. Stop orders show fear. Iceberg orders reveal stealth. Seeing both in real time helps you understand who’s behind a move—and whether they’re likely to stick around.
Bookmap’s stop and iceberg tools aren’t magic arrows or trading signals. They’re a way to read the underlying order flow narrative. And with MBO data, that story gets a lot clearer.
Want to go deeper? Explore the add-on here or dive into the Knowledge Base for configuration tips and use cases.
Sign Up Now