
Our 4th of July Sale is Live
Offer Valid July 4 – July 11
Get 50% off Global+ AND data for 3 months—or save 30% on Global+ for the full year
Claim Your DealReady to see the market clearly?
Sign up now and make smarter trades today
Futures
February 16, 2024
SHARE
The Bookmap Community On: Icebergs
A Brief Intro to Insights
Insights is a page of curated trading content produced by our diverse community across social media.
On the page, you can search for content by certain tags such as asset class (Futures, Stocks, Crypto), instrument (e.g. ES or BTCUSD), indicator (e.g. Stops & Icebergs), order flow phenomena (e.g. Aggressive Sellers), etc.
In this article, we will be looking at how some of the best traders from our community trade Icebergs.
What Are The Bookmap MBO Indicators?
CME MBO (Market-By-Order) data allows futures traders to see the full depth of the order book. This level of transparency was previously only available to the big players—but Bookmap has brought it to you. You can download a case study about Pro Trader Scott Pulcini and how he utilizes this unique data feed to pull in big profits from the futures market here.
The Stops & Icebergs Sub-Chart and On-Chart indicators accurately display the execution of Stop and Iceberg orders, and allows filtering by size, and more. Read more about the MBO Bundle.
DougP: Icebergs as Confirmation Signals
DougP uses Icebergs as one of his multiple setup confirmations within the framework of his broader trading strategy. You can watch DougP discuss his strategy live every Monday to Friday from 1:30pm ET on our Discord.
In this example, when looking at this long setup on the ES on the 10th of January, 2023, DougP notes the “large Iceberg orders” executing (call-out 2).
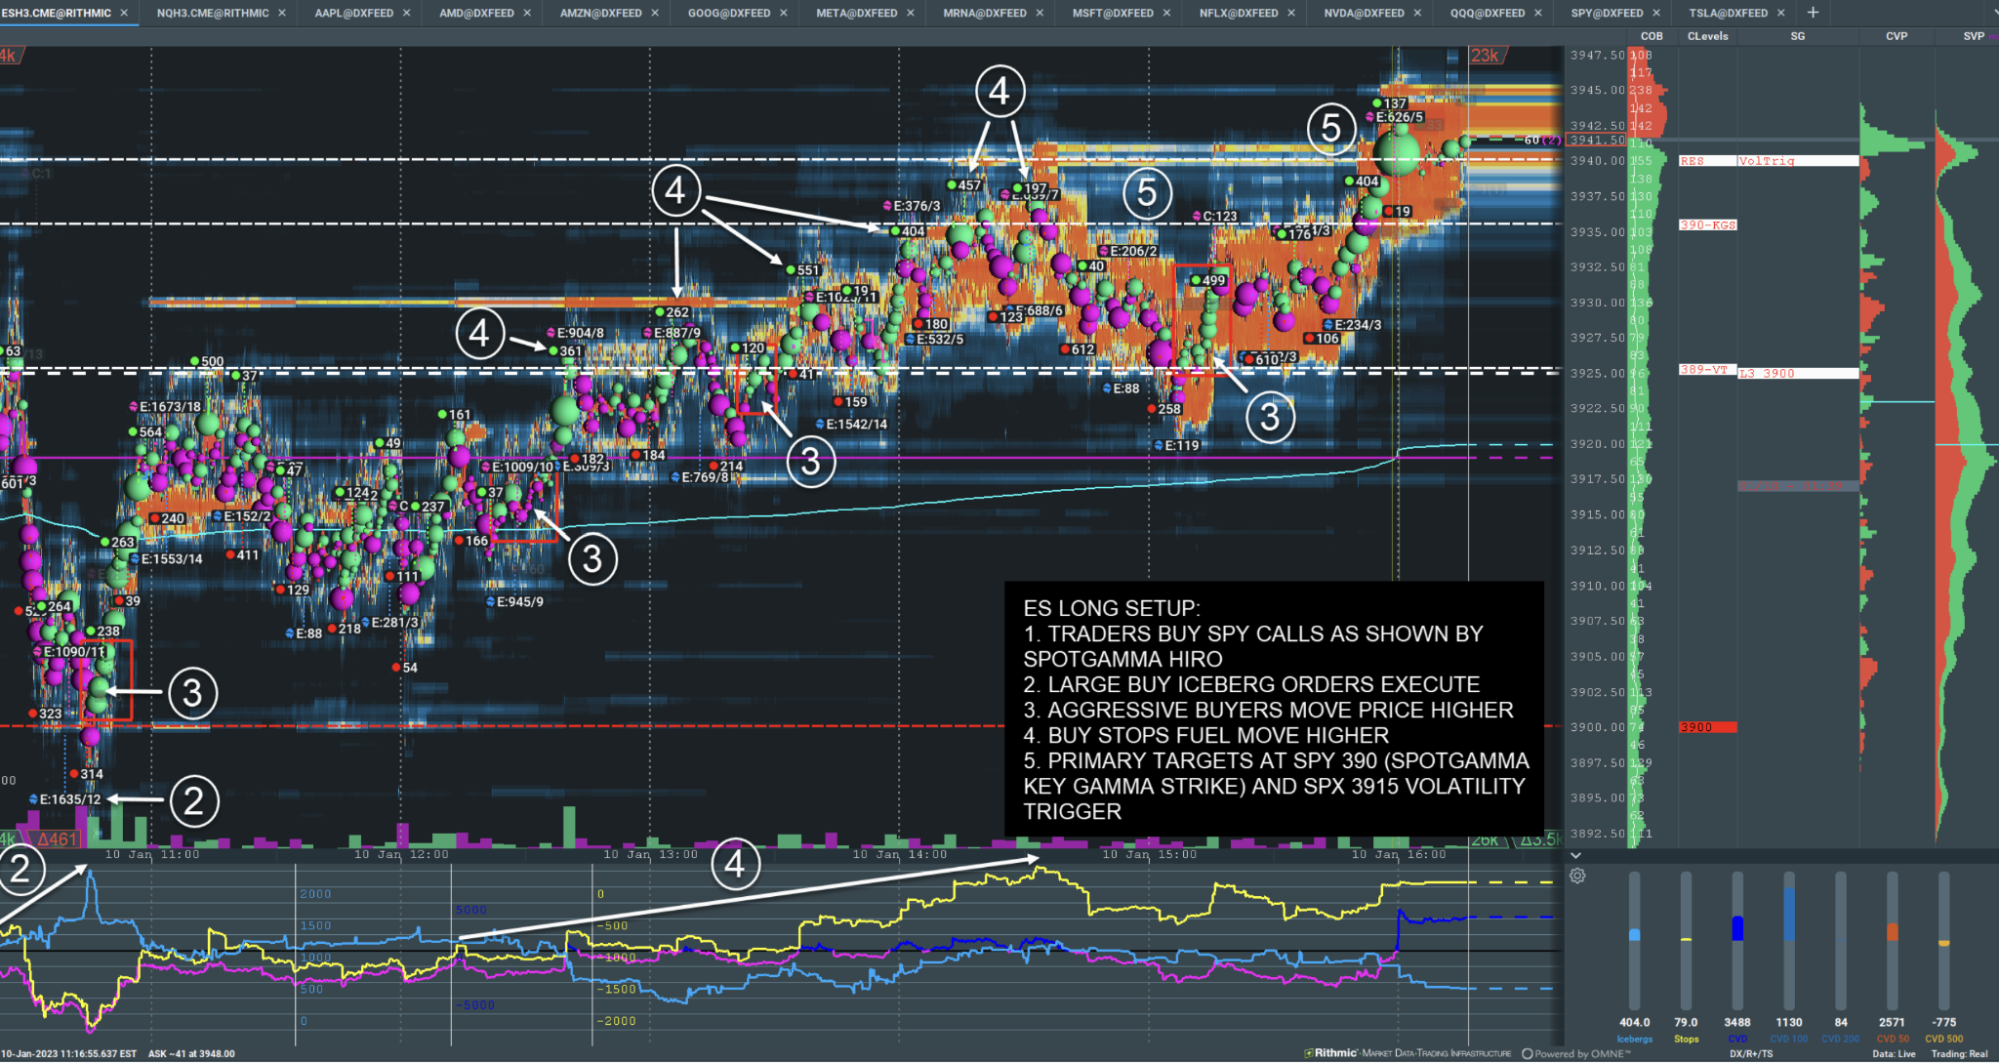
Image 1: Large Buy Icebergs execute on the ES.
In another example on the NQ, DougP receives signals for a successful short setup when the index reverses at a SpotGamma Volatility Trigger and sell Icebergs execute.
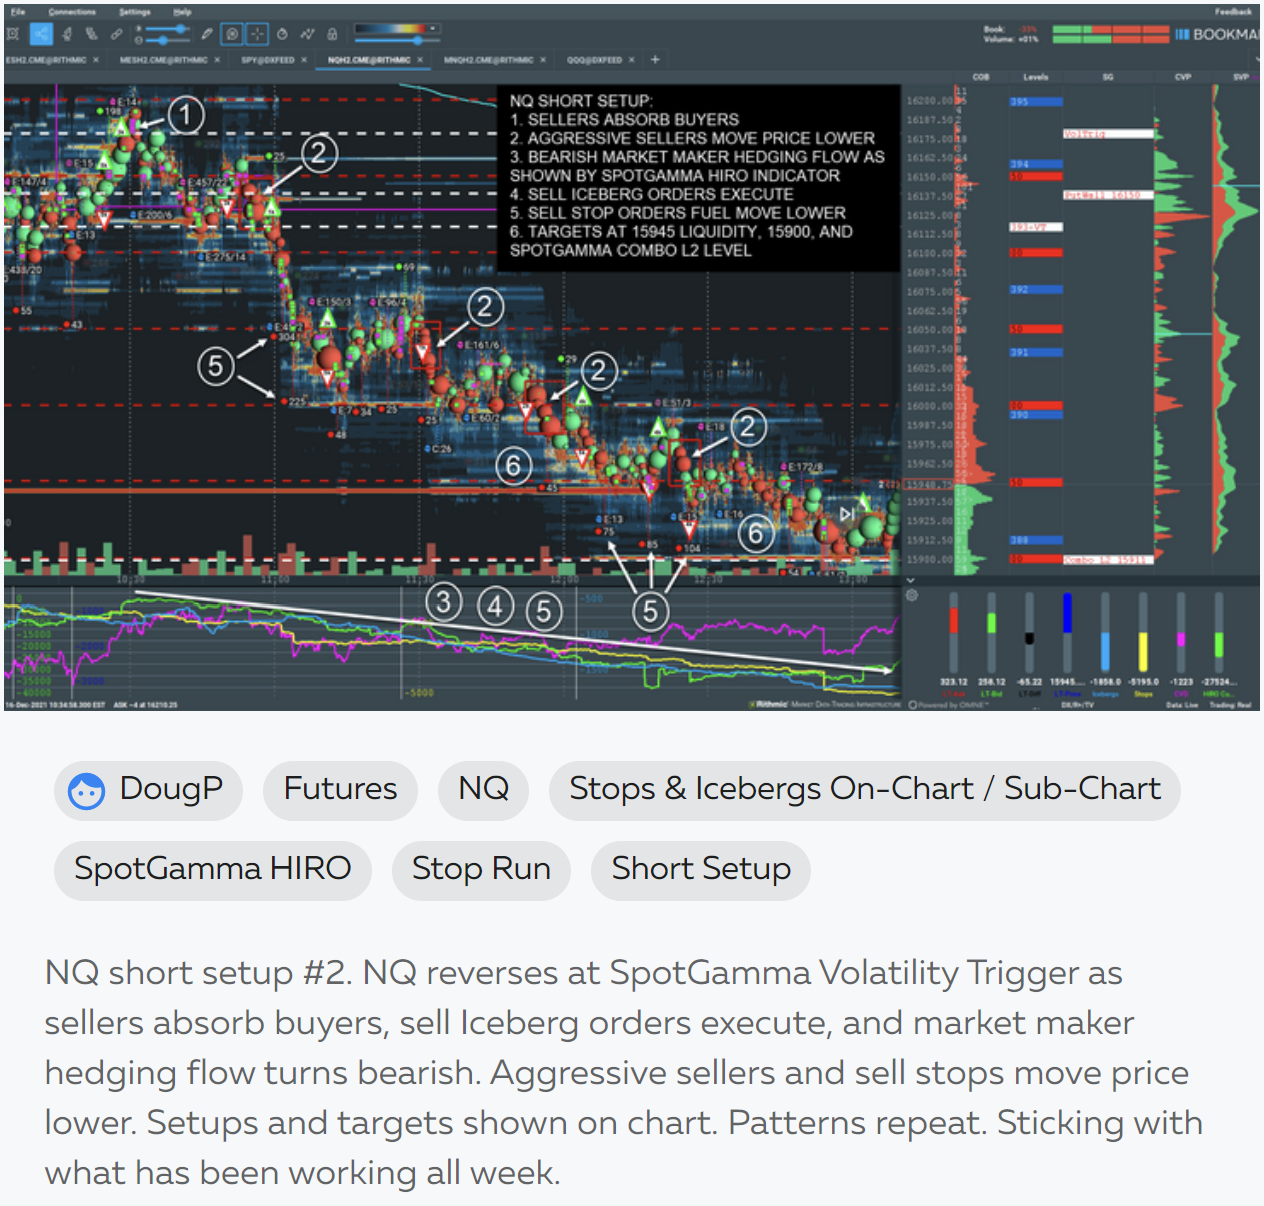
Image 2: Sell Icebergs execute along with buying absorption, bearish market maker hedging, and sell stops triggering.
TraderPete: "Liquidity Grabs”
TraderPete shows how Icebergs can literally show the high (or low) of the market.
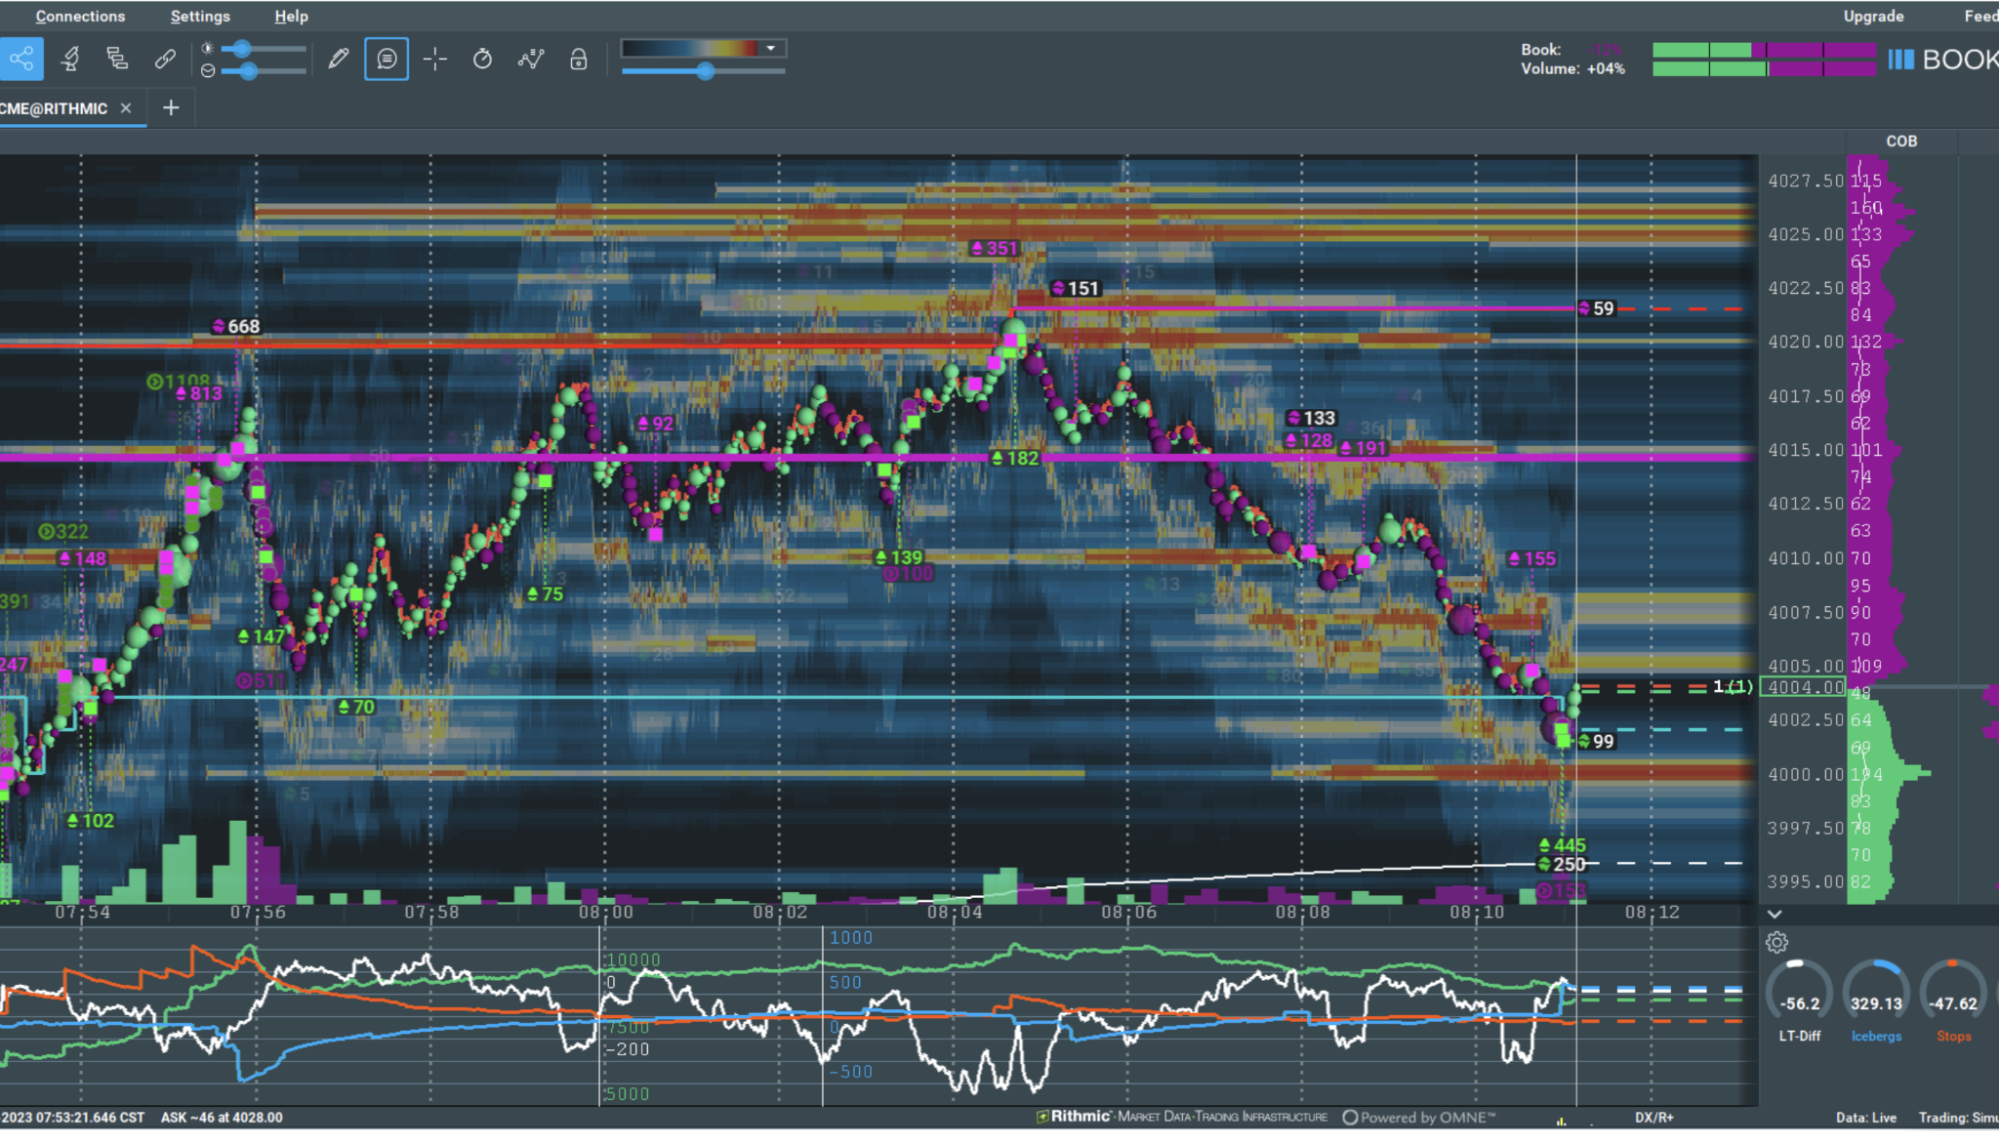
Image 3: In the words of TraderPete: “These markets run from one liquidity grab to another”.
In the example from January 11 on the ES (seen above), the “significant size” Sell Icebergs into the large liquidity level of 4020 resulted in price being “brought down for a nice 10 point run”.
jec: Icebergs Within The Context of Volume Profile
Discord trader and winner of January 2023’s Blue Jacket competition ‘jec’ is a big proponent of Volume Profile.
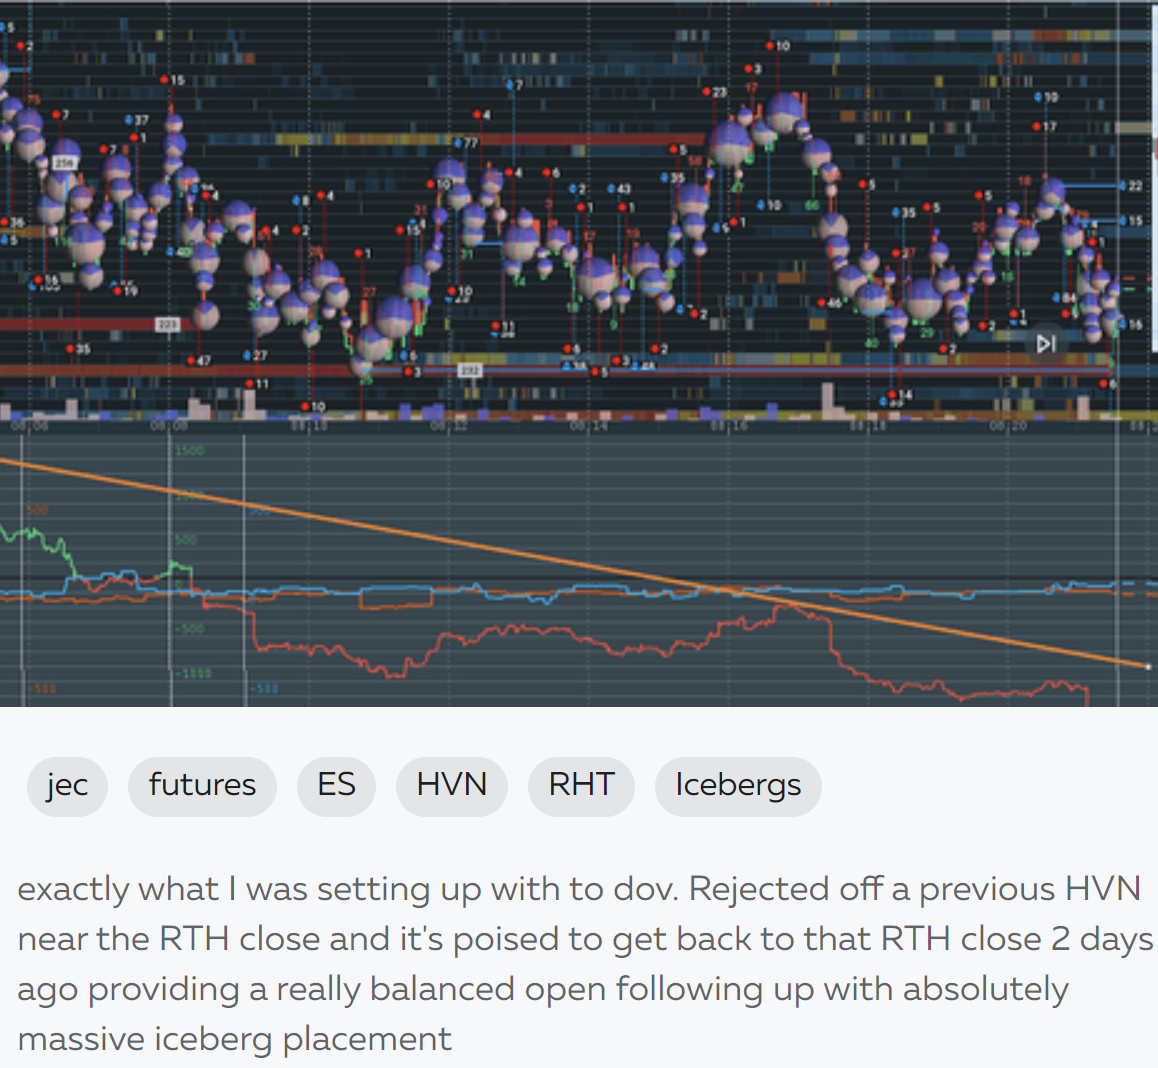
Image 4: In conjunction with his note of a “really balanced open”, he sees the “massive iceberg placement” as another factor in his analysis for lower prices.
In this example from the ES on February 3rd, jec notes the rejection of a previous HVN (High Volume Node) near the RTH (Regular Trading Hours) close as being “posed to get back to that RTH close 2 days ago”.
In combination with the “massive iceberg placement”, this gives him confidence in the expectation of lower prices.
Conclusion
Do you always end up buying at the high or selling at the low? It might be because you can’t see Icebergs—the hidden orders triggering in the order book.
Icebergs can be detected as part of Bookmap’s proprietary suite of indicators, specifically designed for tracking and analysing the CME’s unique MBO (Market-By-Order) data feed, allowing futures traders to see the full depth of the order book.
As we have seen in this articles, Icebergs can signal market tops and bottoms, add to a confluence of other levels, or simply add conviction to a trade bias.
To use the Icebergs add-on with the MBO bundle, you will need to subscribe to either Global or Global+. See the whole picture today.
Risk Disclaimer: Trading Equities and Futures involves substantial risk of loss and is not suitable for all investors. Past performance is not indicative of future results.