See active addresses more clearly in real time.
Compare plans to access deeper market visibility for active addresses.
Crypto
August 6, 2024
SHARE
The Role of On-Chain Analytics in Predicting Cryptocurrency Trends

Cryptos are volatile. Several successful traders use on-chain analytics to improve their crypto trading strategies. While data is the king, on-chain analytics represents processes using which you can analyze the recorded data and improve your profitability.
We will begin this article by understanding key metrics like transaction volumes, active addresses, and token circulation. We’ll then see how spikes in transaction volumes signal upcoming price movements and how tracking active addresses gauge “user adoption” and “network growth”.
We will also learn how one can monitor token flows to and from exchanges to predict market trends. Lastly, we will see how analyzing whale activities and wallet patterns helps predict market moves and how hash rates reflect network health and market sentiment. Let’s get started!
What are On-Chain Analytics?
On-chain analytics refers to the process of analyzing transaction data that is recorded on a blockchain. This includes examining the several elements that are part of the blockchain’s digital ledger, such as
- Details of transactions
and
- Wallet addresses.
Since blockchains are decentralized and publicly accessible, this data provides a transparent and comprehensive view of all network activities. Let’s have a look at some of its key components:
- Transaction Volumes
-
- This measures the total amount of cryptocurrency that is being transacted on the blockchain within a specific period.
- High transaction volumes indicate a high level of interest and activity.
- Also, it suggests a strong and healthy network.
- Active Addresses
-
- This refers to the number of unique addresses participating in transactions over a certain time frame. Monitoring this number is pivotal for gauging user adoption and network growth.
- Active addresses provide insights into:
- User Engagement
and
- The level of adoption of the cryptocurrency.
- A growing number of active addresses usually signal an expanding user base. This, in turn, can be interpreted as a positive indicator of the cryptocurrency’s health and a growing community interest.
- Token Circulation
-
- Token circulation measures the number of tokens that are actively being traded and moved between addresses.
- This indicates the liquidity and utility of the cryptocurrency.
- High token circulation usually means that the tokens are in use rather than being held in reserve.
How Does Blockchain Data Help Traders?
On-chain analytics offers a transparent view of the entire blockchain network. Unlike traditional financial systems, where data can be opaque and hard to access, blockchain data is:
- Inherently open
and
- Accessible.
It allows for real-time monitoring and analysis. Additionally, it helps in:
- Assessing Network Health
-
-
- Analysts can gauge the overall health and strength of a blockchain network by examining key metrics such as:
- Transaction volumes,
- Active addresses, and
- Token circulation.
- Analysts can gauge the overall health and strength of a blockchain network by examining key metrics such as:
-
- Viewing Transaction Volumes
-
-
- When Blockchain data shows high transaction volumes, it indicates robust activity and interest in the network.
- It can be a positive sign for investors.
-
- Monitoring Active Addresses
-
-
- Data showing increasing active addresses suggests growing adoption and usage of the cryptocurrency.
- Mostly, this situation points towards an expanding market.
-
- Observing Token Circulation
-
-
- The high circulation of tokens implies that the cryptocurrency is being widely used.
- This wide usage enhances its value proposition and utility.
-
- Detecting Trends and Patterns
-
- On-chain analytics also help detect emerging trends and patterns.
- For example,
- Say there is a sudden increase in transaction volume or active addresses.
- Usually, this event precedes a price surge.
Key On-Chain Metrics to Monitor
By closely monitoring the transaction volume and value, active addresses, and token circulation, you can gain deep insights into the:
- Activity,
- User adoption, and
- The economic health of a cryptocurrency network.
You must note that these on-chain metrics are essential for assessing the current state and potential future performance of a blockchain. Let’s understand in detail:
Transaction Volume and Value
Transaction volume and value help to understand the “level of activity” on a blockchain network.
| Transaction Volume | Transaction Value |
|
|
What does it indicate?
- An increase in transaction volume and transaction value signals heightened interest and engagement with the cryptocurrency. This can be due to the following factors:
- Positive news,
- Technological advancements, and
- Increased adoption.
- This increase also suggests that market sentiments are shifting towards a more bullish outlook.
- A decrease in transaction volume and value suggests a declining interest or engagement. Usually, this is due to the below-mentioned factors:
- Negative news,
- Regulatory concerns, and
- General market downturn.
Active Addresses
Active addresses are “unique addresses”. They participate in transactions (either sending or receiving) over a specific period. These offer the following indications:
- User Adoption
-
-
- A rising number of active addresses indicates that more users are engaging with the network.
- It suggests the growing adoption and use of the cryptocurrency.
-
- Network Growth
-
-
- Increased active addresses point to network expansion.
- As more users participate, the network becomes more robust and decentralized.
-
- Uptrend in Active Addresses
-
- This is a positive indicator.
- It shows increased interest and participation.
- Downtrend in Active Addresses
- This is a warning sign of declining user interest or engagement.
- Possibly, it can negatively impact the network’s health and value.
Token Circulation
Token circulation, or token velocity, refers to the frequency at which a cryptocurrency token changes hands within a certain period. A high token circulation indicates that:
- Tokens are actively being used in transactions, which reflects a high level of economic activity within the network.
- Tokens are not just being held as an investment but are being utilized for:
- Transactions,
- Payments, and
- Other uses.
- Tokens have liquidity and utility.
How does it impact cryptocurrency?
| High Token Velocity | Low Token Velocity |
|
|
How to Apply On-Chain Analytics in Your Crypto Trading

It is pertinent to note that a sudden increase in transaction volumes can be a precursor to significant price movements in the cryptocurrency market. This phenomenon is often observed in Bitcoin trading.
For example:
- Assume that before a major price rally, there is a noticeable spike in Bitcoin transaction volumes.
- This suggests that traders are actively moving Bitcoin onto:
- Exchanges to sell
or
- Off exchanges to hold.
- That’s because traders are anticipating price volatility.
How to practically use transaction volumes:
| Monitor Transaction Volumes | Interpret Volume Spikes |
|
or
|
What is the relationship between Active Addresses and Price Correlation?
Let’s understand through an example showing how an increase in active Ethereum addresses correlates with a subsequent price increase.
- During the DeFi boom in 2020, Ethereum saw a rise in the number of active addresses.
- This increase happened as more users participated in decentralized finance applications, which coincided with a significant price rally.
How to practically use this relationship:
- Monitor Active Addresses
-
-
- Use tools like “Etherscan” or “blockchain explorers” to track the number of active addresses on the Ethereum network.
-
- Correlation Analysis
-
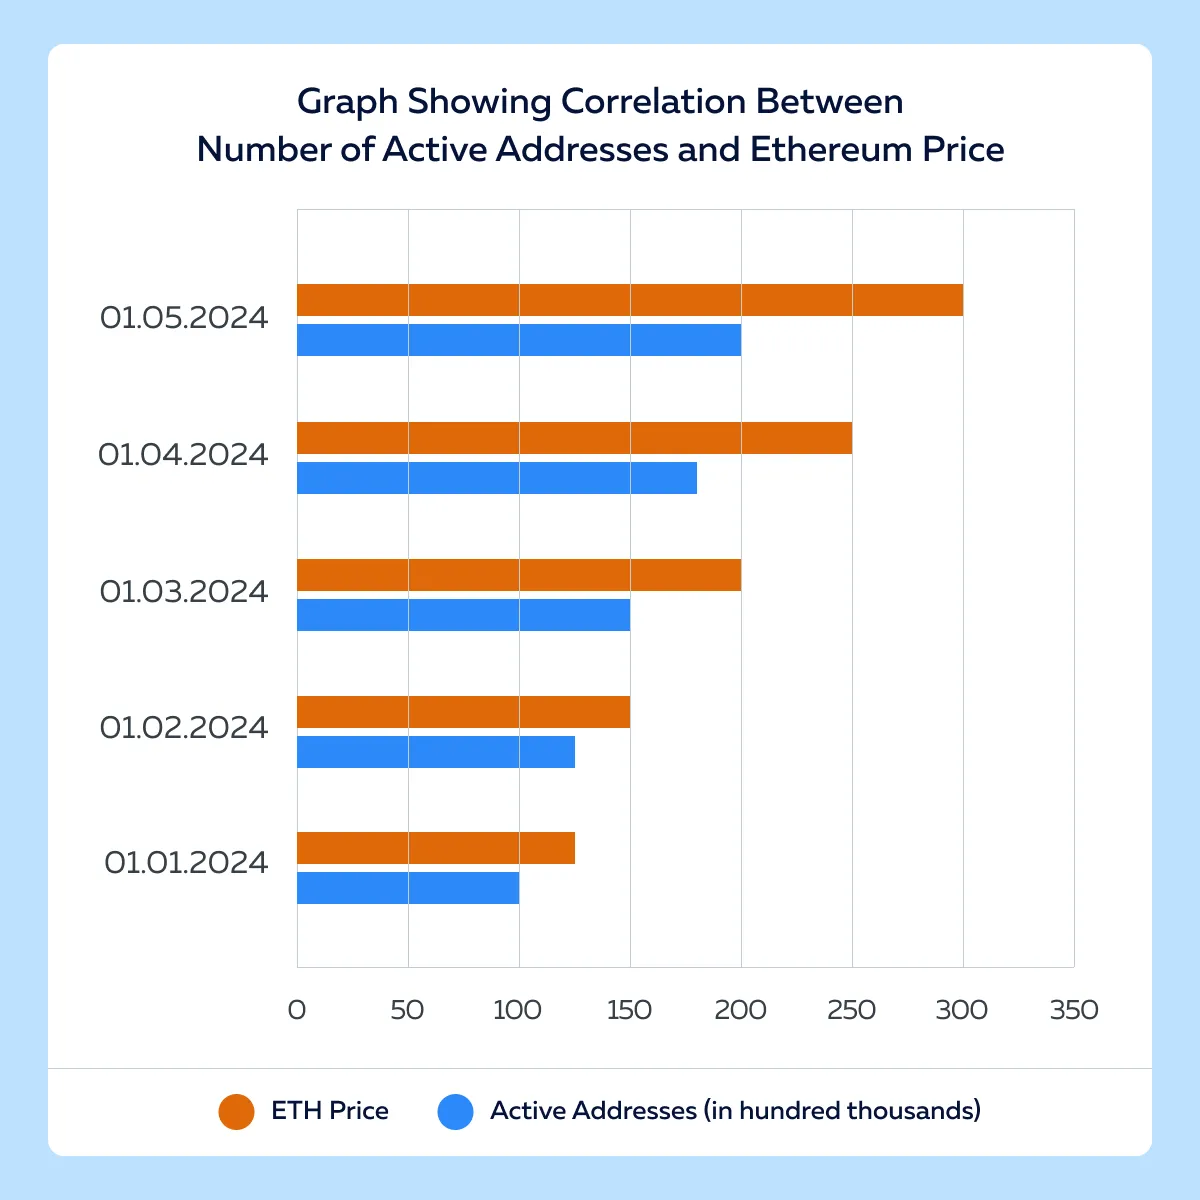
- Plot graphs of active addresses and Ethereum prices to observe patterns.
- A steady increase in active addresses often aligns with rising market participation levels.
- This situation often shows potential price movements.
See the graph below, which shows a positive correlation between the number of active addresses and the Ethereum price, both increasing over the same period. (Hypothetical data)
How Does Analyzing Token Flow to and from Exchanges Provide Early Warnings?
Analyzing the flow of tokens to and from exchanges provides early warnings of major market moves. This metric helps traders understand the:
- Intentions of large holders (whales)
and
- General market sentiment.
Let’s understand through a hypothetical example:
Influx of Tokens to Exchanges
- Assume that a large amount of Bitcoin or Ethereum is being transferred to an exchange.
- This situation shows that holders are looking to sell.
- It also signals an imminent potential bearish trend.
Outflow of Tokens from Exchanges
- Conversely, say there is a reduction in the number of tokens on exchanges.
- Now, this situation shows that traders are withdrawing their holdings to private wallets.
- It suggests a bullish sentiment as they intend to hold rather than sell.
How can you practically apply this strategy?
- Monitor Exchange Flows
-
-
- Use tools like Whale Alert or Glassnode.
- They will provide you with data on large transactions and exchange flows
-
- Interpret Exchange Data
-
- Always look for significant movements of tokens.
- Usually, a large inflow precedes a price drop.
- Conversely, a significant outflow indicates upcoming price increases.
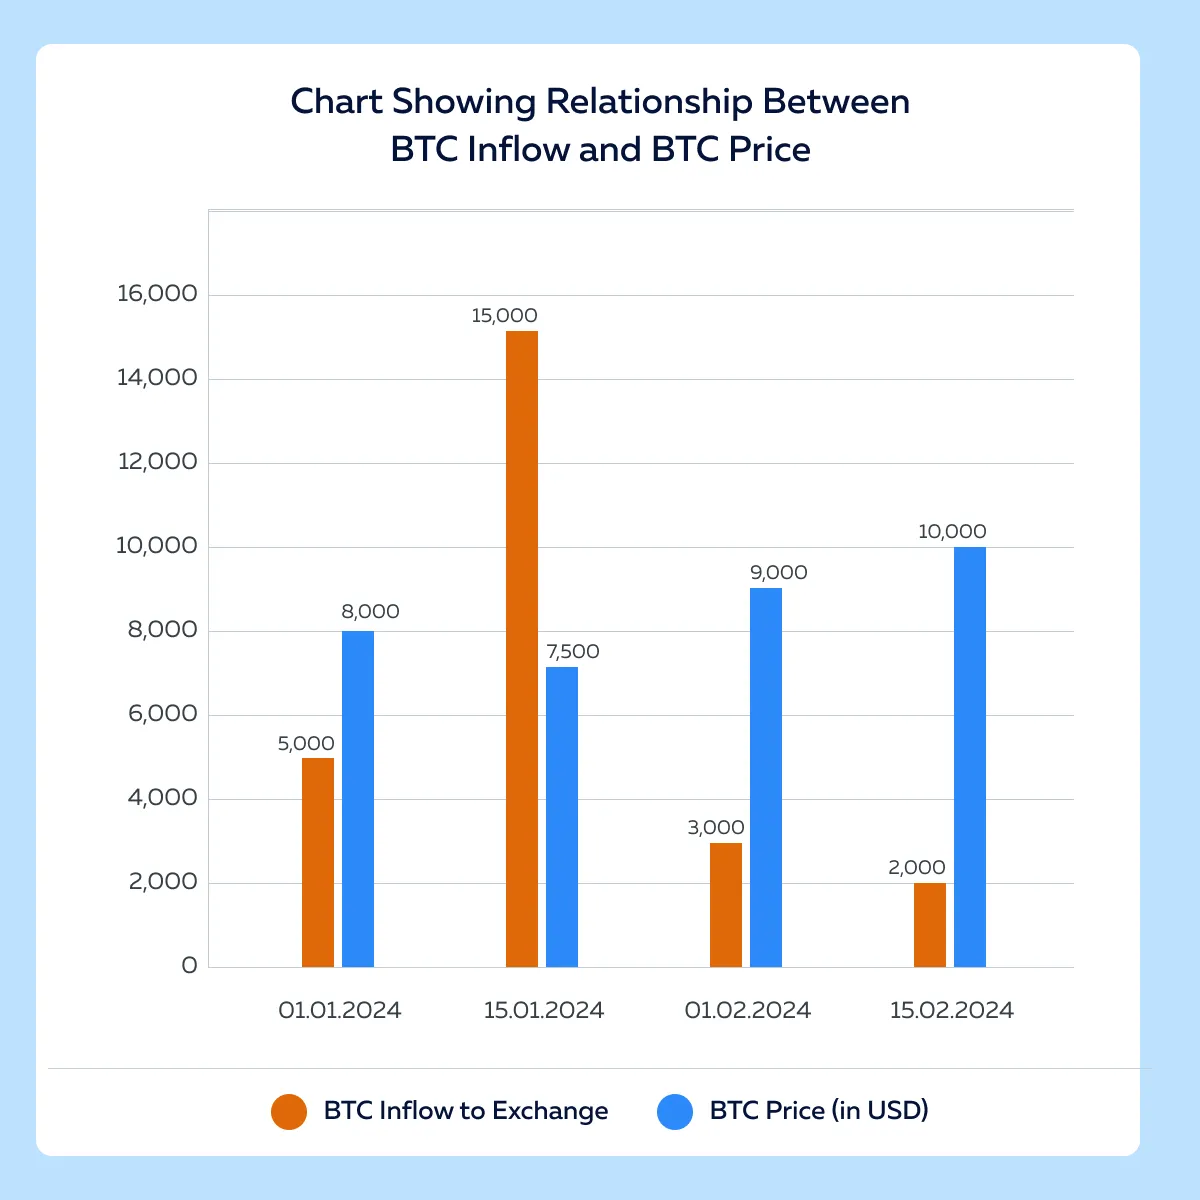
Let’s enhance our standing via a graph showing that:
- A significant inflow of BTC to exchanges in mid-January correlates with a price drop.
- On the other hand, reduced inflows in February coincided with a price rally.
Real-Time Token Flows on On-Chain Analytics Platforms
Traders must note that on-chain analytics platforms, such as Glassnode, Santiment, and Whale Alert, offer real-time monitoring and visualization of token flows. This allows traders to react quickly to significant movements. Usually, these platforms display data related to:
- Large transactions,
- Inflows and outflows from exchanges, and
- Other key metrics.
How Can Traders Track Whale Activities with On-Chain Data?
Whales, or large holders of cryptocurrency, have significant influence over the market due to the large volumes of assets they control. Their buying or selling actions lead to substantial price movements. To gain a competitive edge, traders can monitor whale activities to anticipate potential market swings.
Let’s understand this through an example of how movements within these wallets impact the market:
- In early 2021, a known Bitcoin whale moved 10,000 BTC to an exchange wallet.
- This large transfer signaled a potential sell-off.
- Shortly after this transaction, Bitcoin’s price dropped by nearly 15% within a few days.
- Traders who tracked this movement:
- Anticipated the bearish trend
and
- Adjusted their positions accordingly.
Now, let’s have a look at some popular tools using which you can track whale activities:
| Tool | Description | Feature | Usage |
| Whale Alert | A popular platform that tracks and reports large cryptocurrency transactions in real-time. |
|
By following Whale Alert on social media or subscribing to their notifications, traders can receive timely updates on whale movements. |
| Glassnode | An advanced on-chain analytics platform providing detailed metrics on blockchain activities. | Tracks the following:
|
Traders can use Glassnode to set up alerts for:
and
|
| Sentiment | Another robust analytics tool focusing on market and on-chain data. | Provides insights into whale behavior, including:
|
|
How Analyzing Wallet Activity Patterns Helps in Predicting Market Moves?
By analyzing wallet activities, traders can predict market moves. That’s because regular and large transactions from a whale’s wallet indicate “strategic moves” to influence market prices. Also, high-volume transactions often precede significant market swings due to the sheer size of assets moved.
Let’s understand how you can do so using a walkthrough example:
- Step I: Data Collection
-
- Track a specific whale’s transactions over a month.
- Use on-chain analytics tools like Glassnode or Whale Alert.
- Step II: Analysis
-
- Identify transaction dates, amounts, and destinations (e.g., exchanges).
- Correlate these transactions with:
- Market highs
and
- Market lows.
- You can use historical price data to correlate.
- Step III: Pattern Recognition
-
- Observe if large transfers to exchanges coincide with price drops.
- This situation often suggests sell-offs.
- Also, note that if withdrawals from exchanges precede price increases, this situation indicates accumulation.
Hypothetical example:
- Assume that a whale moves 5,000 BTC to an exchange on the 10th of the month.
- As a result, Bitcoin’s price drops 10% over the next two days.
- Traders monitoring the market were able to anticipate the impending price drops.
What does the Hash Rate Indicate about Market Sentiment?
By analyzing hash rate trends, traders can predict market movements and sentiment. Let’s see the different scenarios:
| Type of Hash Rate | Indications | Impact |
| Stable or Increasing Hash Rate |
|
Supports a bullish market outlook as miners continue to invest in the network |
| Declining Hash Rate |
|
Suggests bearish market conditions, as the network faces reduced security and confidence. |
Conclusion
On-chain analytics are crucial for gaining a comprehensive understanding of the cryptocurrency market. They provide insights into transaction volumes, active addresses, and token flows, helping traders anticipate market movements. By tracking whale activities and analyzing hash rates, traders can make informed decisions based on network health and sentiment.
Furthermore, traders should continually educate themselves on new analytical methods and integrate these insights into their trading strategies to stay ahead. For more tips on getting started with crypto trading, visit this article on Crypto Trading for Beginners.
Sign Up Now