See institutional more clearly in real time.
Compare plans to access deeper market visibility for institutional.
Education
July 18, 2024
SHARE
Trading in the Shadow of the Giants: How to Spot and Follow Institutional Moves

Gain insights just like the big players. This statement represents the dream seen by millions of traders all over the world. Yet, for many traders, imbibing such trading acumen remains an elusive goal. However, it’s no longer as challenging to do so, as the tools to bridge this gap are now within reach.
This article explains who institutional traders are and how you can follow their trades. We’ll discuss specific tools and their features, which you can use to identify their market activities. Also, we will learn several strategies like analyzing order flow to detect buying and selling pressure, using cumulative volume data and news to gauge market sentiment, and understanding correlations between different assets to predict institutional movements.
By recognizing the patterns and behaviors of institutional traders, you can time your entries and exits more effectively and enhance your overall trading performance. Let’s see how you can do it.
What is Institutional Market Influence?
Institutional Market Influence refers to the significant impact that large financial entities, known as institutional traders, have on financial markets.
These traders have:
- Substantial capital resources
and
- Sophisticated trading strategies.
Using them. they can create notable shifts in market dynamics. Let’s understand who institutional traders are and how they impact the market:
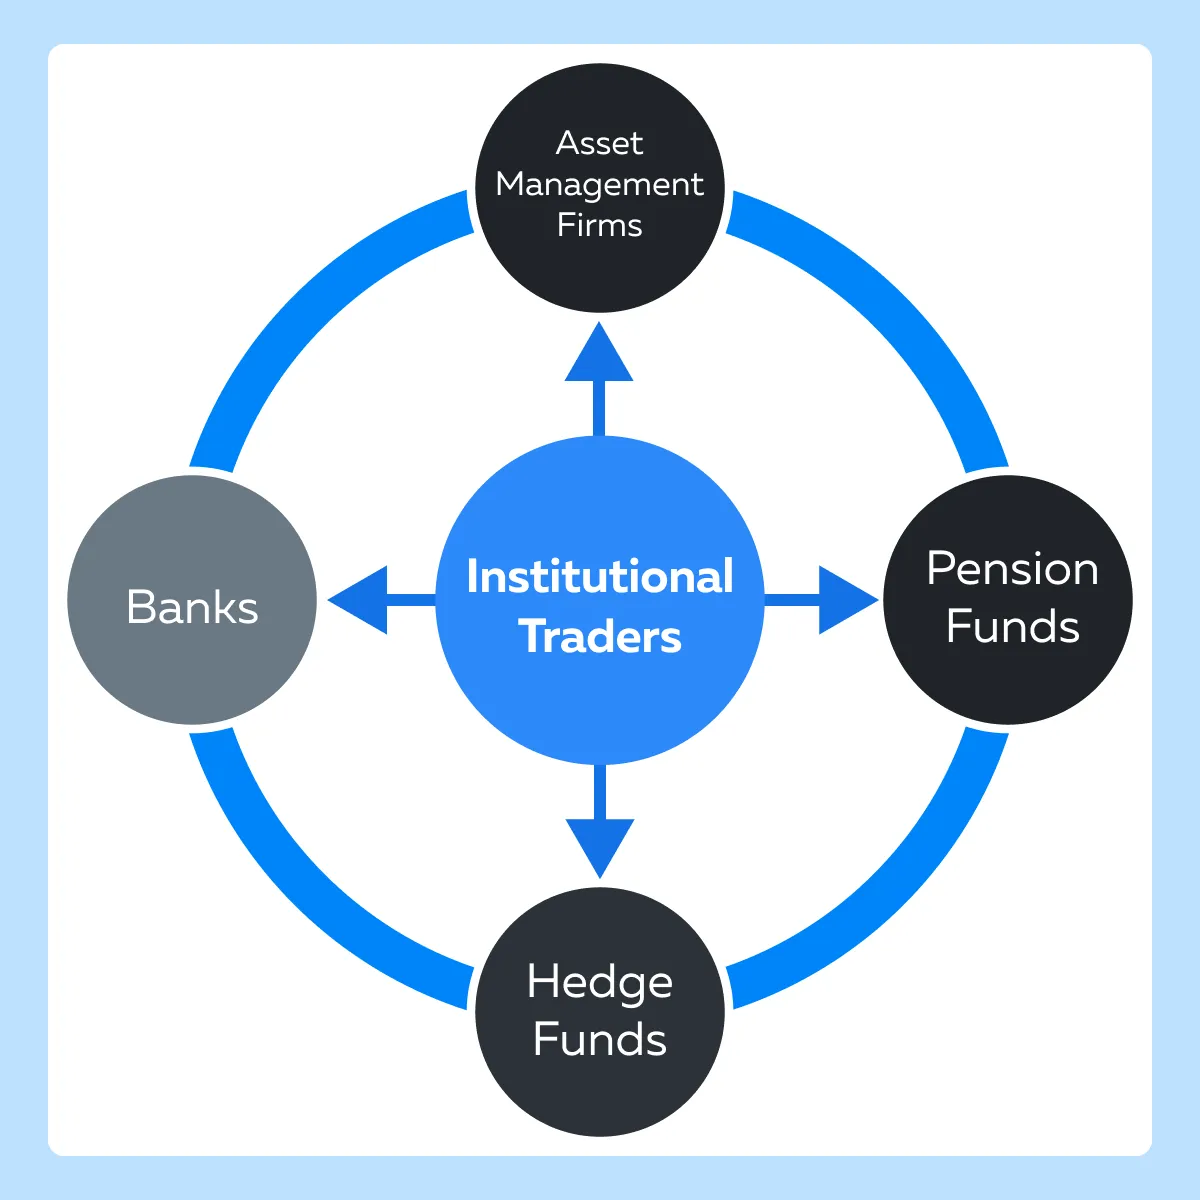
Who are Institutional Traders?
- Banks
-
- Major commercial and investment banks engage in trading to:
- Manage risk,
- Earn profits, and
- Provide liquidity to markets.
- They often have proprietary trading desks and manage large pools of capital.
- Major commercial and investment banks engage in trading to:
- Hedge Funds
-
-
- These are pooled investment funds.
- They follow various strategies to earn active returns for their investors.
- Often, they use short selling and derivatives to take large positions that affect market prices.
-
- Pension Funds
-
-
- These funds manage the retirement savings of employees.
- With significant assets under management (AUM), they invest in various securities to ensure long-term growth and stability.
-
- Asset Management Firms
-
- These are companies that manage investments on behalf of clients.
- Some common examples are:
- Mutual funds,
- Exchange-traded funds (ETFs), and
- Private portfolios.
- They make large-scale investment decisions that usually influence market trends.
What are some popular strategies employed by institutional traders?
It is pertinent to note that institutional traders operate on a much larger scale than individual investors. They execute trades involving millions of dollars, which represents substantial percentages of a security’s daily trading volume. Thus, they follow strategies distinct from those followed by retail traders. Let’s have a look at some of their common strategies:
- Buy and Hold: Long-term investments in high-quality stocks, bonds, or other assets
- Arbitrage: Exploiting the price discrepancies across different markets or instruments
- Quantitative Trading: Executing trades using complex mathematical models and algorithms based on data-driven analysis
- High-Frequency Trading (HFT):
- Employing sophisticated algorithms to execute thousands of trades per second
- The primary goal is to capitalize on minute price movements.
- Event-Driven: Trading based on events like:
- Mergers,
- Acquisitions, and
- Earnings announcements.
How do institutional traders leave footprints in the market?
Institutional traders leave major footprints in the market due to their:
- Large transaction sizes
and
- Strategic moves.
Let’s understand in detail:
- Large Volume Trades
-
- The sheer size of trades significantly influences a security’s supply and demand balance.
- For example,
- Assume a pension fund decides to acquire a substantial quantity of stock.
- This increases demand for the stock and drives up the stock’s price.
- Significant Price Changes
-
- When institutions buy or sell large quantities of security, it leads to abrupt price changes.
- This is particularly evident in less liquid markets, where large trades create more pronounced price movements.
- Market Impact
-
- Institutional trading leads to increased volatility.
- This effect is felt even more in short-term scenarios.
- Institutional trades set off a chain reaction among other market participants.
- This reaction amplifies price movements.
- Order Book Imbalances
-
- Institutions often place large orders.
- These are visible on the order book and show substantial buy or sell interest at certain price levels.
- This can influence other traders’ perceptions of market direction.
- Patterns in Trading Behavior
-
- Institutions use several sophisticated trading methods like:
- Trading at specific times,
- Techniques like “iceberg orders” (large orders divided into smaller, visible orders),
- Algo-trading, and more.
- These trading styles often put retail traders in a disadvantaged position.
- Institutions use several sophisticated trading methods like:
Tools for Identifying Institutional Activity
Numerous studies have shown that identifying institutional activity in the market requires sophisticated tools and indicators. It is only by using them that retail traders can detect:
- Large-scale trades
and
- Unusual volume patterns.
Let’s have a look at some primary tools and techniques used to track such activities:
Volume-Based Indicators
| Volume Spikes | Large Order Sizes | Cumulative Volume Indicators |
|
|
|
Advanced Visualization Tools
Using advanced market analysis tools like Bookmap, TradingView, and others, traders gain a competitive advantage. Thanks to their modern features, traders can easily detect anomalies and identify areas where most trading has occurred. Let’s explore the above-mentioned features and their benefits, one by one:
- Historical Data Comparisons
-
- Tools like Bookmap allows traders to compare:
- Current trading activity
- Tools like Bookmap allows traders to compare:
against
- Historical data.
- These tools help in:
- Identifying patterns
and
- Detecting anomalies indicative of institutional activity.
- Volume at Price (VAP) Analysis
-
-
- This feature shows where the most trading volume has occurred and that too at different price levels.
- It highlights significant support and resistance zones often influenced by institutional trades.
-
- Real-Time Order Flow Dynamics
-
-
- This feature provides a real-time view of the order book.
- It shows the size and frequency of incoming orders.
- This helps traders see large orders entering the market and the resulting impact on price movements.
-
- Order Book Heatmaps
-
- These visualizations display the depth of the order book.
- They show where large orders are placed.
- Clusters of large orders indicate:
- Institutional trading intentions
and
- Likely price levels of interest.
Key Strategies for Following Institutional Traders

To enhance their trading strategies, retail traders must monitor the movements of institutional traders. By using some proven strategies, traders can time their entries and exits and manage risks. Let’s have a look at them:
| Wait for Volume Confirmations | Check for Price Stability |
|
|
What are MBO and MBP Data and how they are used to detect institutional activity?
MBO (Market by Order) Data provides detailed information about individual orders, including the following:
- Size,
- Price, and
- The timestamp of each order.
This granularity helps identify specific trading activities such as iceberg orders. For the unaware, Iceberg orders are large orders that are divided into smaller and visible portions. The primary objective of this division is to conceal the true order size from the market.
By detecting icebergs, traders can reveal:
- Hidden institutional activity
and
- Significant levels of supply or demand.
When it comes to Bookmap, uses MBO data to detect icebergs. Bookmap analyses patterns of order placement and execution. This helps traders see beyond the visible order book.
On the other hand, MBP (Market by Price) Data aggregates orders at each price level. It shows the total buy and sell orders without revealing individual order details. By doing so, MBP provides a broader view of supply and demand at different price levels.
However, traders must note that:
- MBP data helps in understanding the overall market depth.
- However, it lacks the precision of MBO data in detecting specific activities like iceberg orders.
How can you manage risks when following institutional moves?
Managing risks is crucial, especially when you are following the footsteps of institutions using sophisticated tools and algorithms. Let’s have a look at some popular risk management techniques:
- Set Stop-Loss Orders
- Volatility Protection
-
-
- Use stop-loss orders to protect against adverse price movements.
- Place them at strategic levels, such as:
- Just below support in long positions
-
or
- Above resistance in short positions.
- This kind of placement will help you mitigate potential losses.
- Use Volatility-Adjusted Position Sizing
- Risk Proportionality
-
-
-
- Adjust the size of your positions based on current market volatility.
- Employ indicators like the Average True Range (ATR) to assess market volatility and determine appropriate position sizes.
-
-
- Capital Allocation
-
-
-
- Ensure that no single trade risks more than a small percentage of your total capital (ideally 1-2%).
- This will prevent significant losses from impacting your overall portfolio.
-
-
- Monitor Institutional Activity
- Order Book Analysis
-
-
-
- Use tools like Bookmap to monitor real-time order book activity.
- This will help you detect large orders or changes in market depth that signal institutional moves.
-
-
- News and Events
-
-
- Stay abreast of market news and events that can influence institutional trading.
- Some common examples of such events are as under:
- Earnings reports,
- Economic data releases, and
- Geopolitical developments.
-
How analyzing order flow can help you detect the buying and selling pressure?
Order flow analysis involves examining the sequence and size of buy and sell orders. This examination helps in:
- Gauging market sentiment,
- Predicting potential price movement, and
- Detecting buy and sell pressure exerted by institutional traders.
Let’s study some techniques using which you can effectively analyze the order flow:
- Look for Order Book Imbalances
-
-
- Large buy or sell orders create imbalances in the order book.
- A significant number of large buy orders at certain price levels indicate strong buying pressure from institutions
- This pressure suggests a potential price increase.
-
- Identify Iceberg Orders
-
- By identifying iceberg orders, traders can spot concealed large orders.
- Detecting these can provide clues about:
- Institutional strategies
and
- Hidden support or resistance levels.
- Check for Large Block Trades
-
- Institutions often execute large block trades.
- These trades can be identified through spikes in trade volume.
- Observing these trades shows where institutions are placing significant bets.
How to gauge market sentiment with cumulative volume data and news analysis?
Several traders use cumulative volume data and news analysis to:
- Understand the underlying market mood
and
- Anticipate potential price movements influenced by institutional trading decisions.
Let’s understand in detail and see how you can do so:
Using Cumulative Volume Indicators
| On-Balance Volume (OBV) | Accumulation/Distribution Line |
|
or
|
News and Reports Analysis
| Earnings Reports and Economic Data | Market Sentiment Analysis |
|
|
How do correlations between different assets signal institutional movements?
Correlations between different assets signal institutional movements by showing:
- How do large traders diversify their portfolios?
and
- How do large traders manage their risks across markets?
This relationship reveals likely shifts in asset allocation and market trends. It signals where institutional money is flowing. Let’s understand in detail:
- Asset Correlations
- Diversification and Risk Management
-
-
-
- Institutions often diversify their portfolios by trading correlated assets to manage risk.
- Understanding these correlations helps predict institutional movements.
-
-
- Inter-Market Analysis
-
-
-
- Analyzing correlations between different markets (e.g., equities, bonds, commodities, and currencies) provides insights into institutional strategies.
- For example,
- Say there is a rise in bond prices.
- This rise can correlate with a decline in equities.
- This relationship indicates a shift from riskier to safer assets.
-
-
- Lead-Lag Relationships
- Leading Indicators
-
-
-
- Usually, certain assets or sectors move ahead of others.
- This movement provides early signals of institutional trading patterns.
- For example,
- Say there are changes in commodity prices.
- Often, these changes precede movements in related stocks or currencies.
-
-
- Sector Rotation
-
-
- Institutions often rotate investments between sectors based on:
-
- Economic cycles
and
- Market conditions.
- Observing sector performance reveals these rotation patterns.
- This observation helps in understanding where institutional money is flowing next.
Conclusion
Understanding and adapting to the trading activities of institutional players can greatly enhance a trader’s success. Institutional traders influence market trends and prices through their large-volume trades. By recognizing their patterns, retail traders can better time their entries and exits.
Using a combination of advanced tools, like Bookmap, and strategies is essential for making informed decisions. Order flow analysis, cumulative volume data, news monitoring, and understanding asset correlations provide a comprehensive view of market dynamics. These methods help detect institutional activity and anticipate price movements.
Adapting to institutional behaviors requires constant learning and the right tools. To learn the differences between retail and institutional traders and how to use this knowledge, check out this blog article.
Sign Up Now