See passive absorption more clearly in real time.
Compare plans to access deeper market visibility for passive absorption.
Education
February 4, 2026
SHARE
When Price Stalls for No Reason: Understanding Micro Pullbacks and Passive Absorption
 Do you know why “price stalls”? That’s because someone with deep pockets has decided that this is where business gets done. Most traders are aware of these two straightforward facts:
- More buying should push the price up,
and
- More selling should push the price down.
So why does the price suddenly freeze despite heavy volume? It’s usually a “micro pullback”—a moment where aggressive traders collide with a well-capitalized passive participant absorbing everything.
Do you think charts and candles can help you here? Nope! It’s the order flow that starts telling the real story. Read this article to learn how micro pullbacks form, why passive absorption causes price to stall, and how to read these moments as high-value signals. Let’s get started.
What is a Micro Pullback?
A micro pullback is a very brief pause that happens while the price is still trending strongly. On the surface, it looks like nothing is happening. You may observe candles stalling and the price barely moving. But under the hood, trading activity is still heavy. Orders keep hitting the market, yet the price refuses to fluctuate. That mismatch is the real signal.
Now, this is where the concept overlaps with passive absorption trading. Let’s see how:
- One side is aggressively buying or selling,
but
- A hidden participant is quietly taking the other side without letting the price move.
Need an analogy? You can relate to it by visualizing someone standing in front of a moving crowd and absorbing all the pressure without budging an inch. Now, moving it to the next concept, micro pullbacks usually appear when:
- Aggressive traders run into a passive institutional order,
- Liquidity suddenly thickens at a price level,
- Institutions accumulate or distribute without revealing intent.
For more clarity, let’s study an example:
- Let’s assume that the price is moving up intensely.
- Buyers keep buying at the market, but the price stops rising.
- How does it look in Bookmap? You would see large resting liquidity getting tested repeatedly.
- Now, liquidity is absorbing the buying.
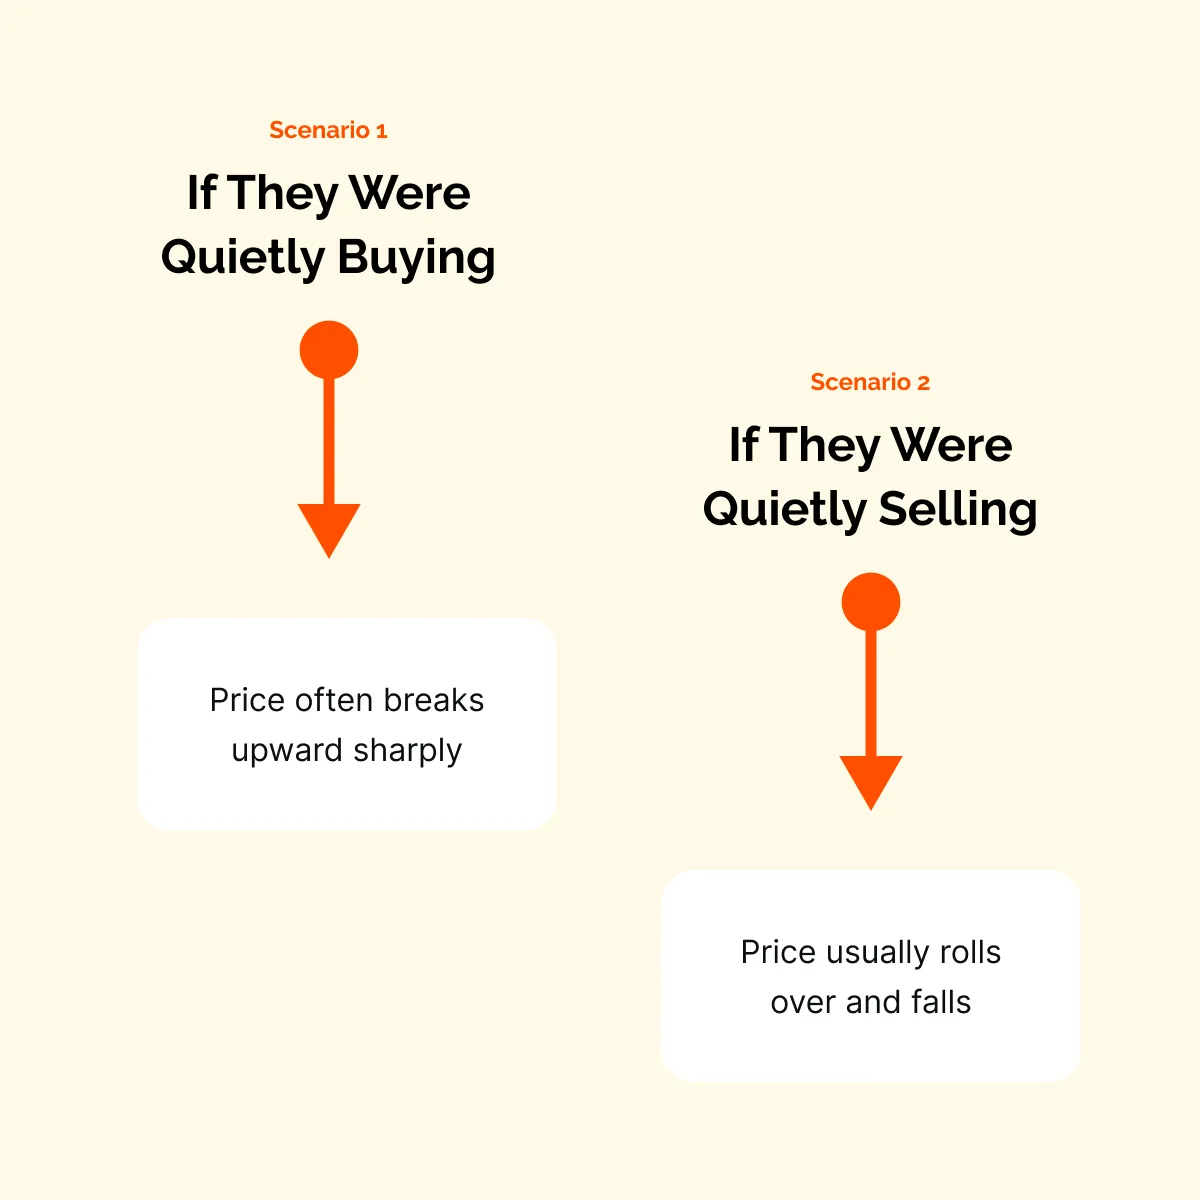
- Once that passive seller finishes, the price either:
- Continues higher (if they were buying to accumulate earlier),
or
- Drops sharply (if they were absorbing to sell).
So, what can you learn? A micro pullback is not random hesitation. It often signals hidden positioning and is a “major footprint” used in passive absorption trading to anticipate the next move. See micro pullbacks form live with Bookmap’s order flow visualization → Compare Packages.
What Passive Absorption Means
Passive absorption happens when large traders use limit orders to take the other side of aggressive market orders quietly. But still, the price barely moves. Why? Instead of chasing price or removing liquidity:
- They sit at a level,
and
- Allow others to keep trading into their orders (until all that buying or selling pressure is absorbed).
This is a core idea behind passive absorption trading. Okay, but what are the signs? Let’s find out more about that below:
These signs usually mean a bigger participant is holding the level + taking size with patience.
How to Interpret Such a Market Situation?
When a trader absorbs aggressively like this, it shows confidence. Are they merely reacting to the market? Nope! They are defending a price or building a position. Smaller traders keep hitting buy or sell orders, thinking momentum will continue. On the other hand, the passive player keeps filling everything, preventing the price from breaking.
How Does Absorption Look on a Heatmap?
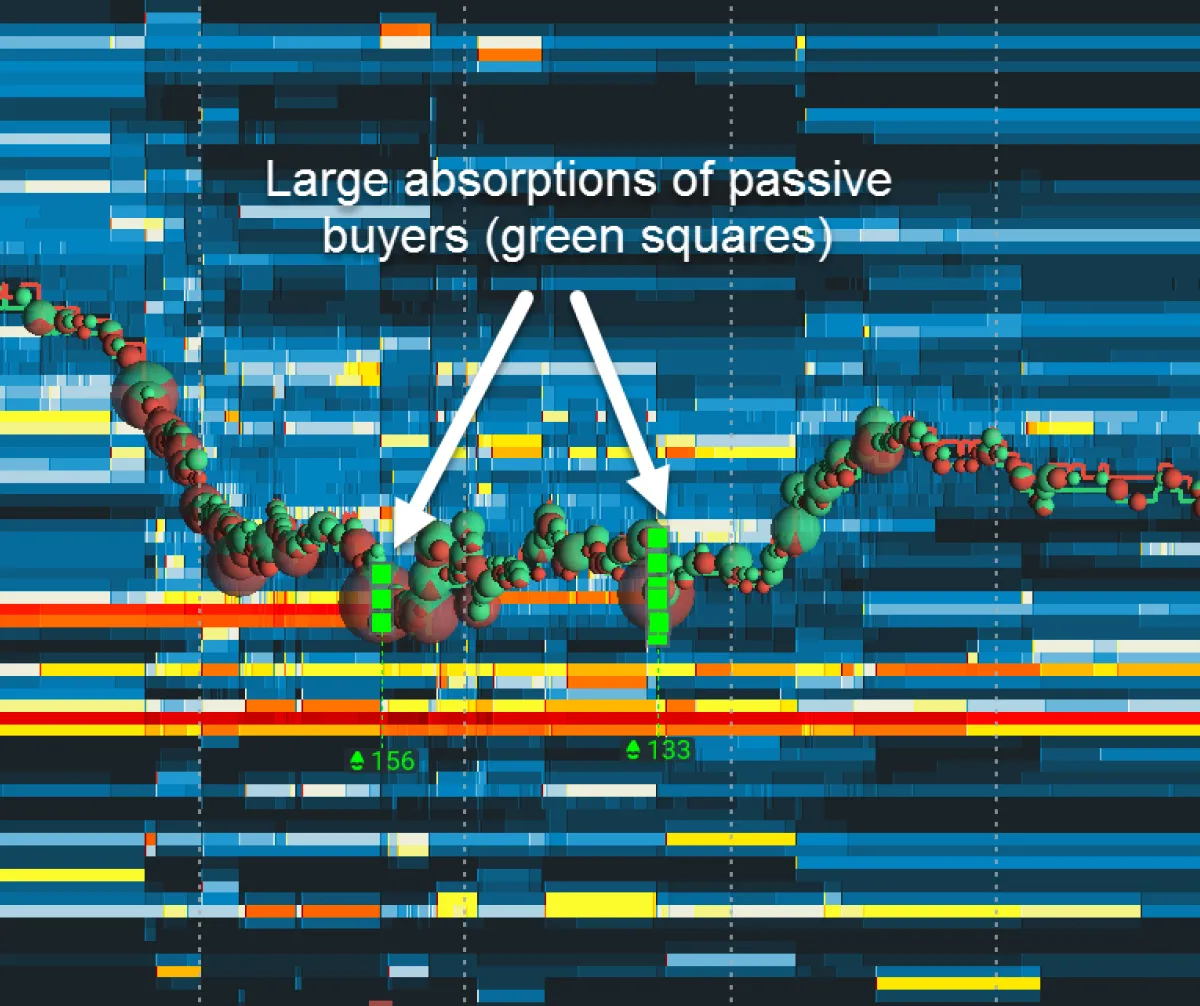
Usually, you’ll notice:
- Bright liquidity bands that stay in place even while being hit repeatedly,
- Heavy volume printing at the same price, and
- Delta is strongly one-sided while the price remains stuck.
This combination is powerful in passive absorption trading because it reveals hidden intent. It shows that someone with a lot of capital is willing to take all incoming orders at that level.
Okay, But What Happens After Absorption Finishes?
Once the passive trader is done, let’s see how they impact the price in two different scenarios:
So what can you take away? Absorption is not just a “sticky price point.” Instead, it is a transfer of inventory from weak hands to strong hands. Recognizing it early is one of the most significant advantages in passive absorption trading. Understand why price pauses even when volume looks strong → Compare Plans.
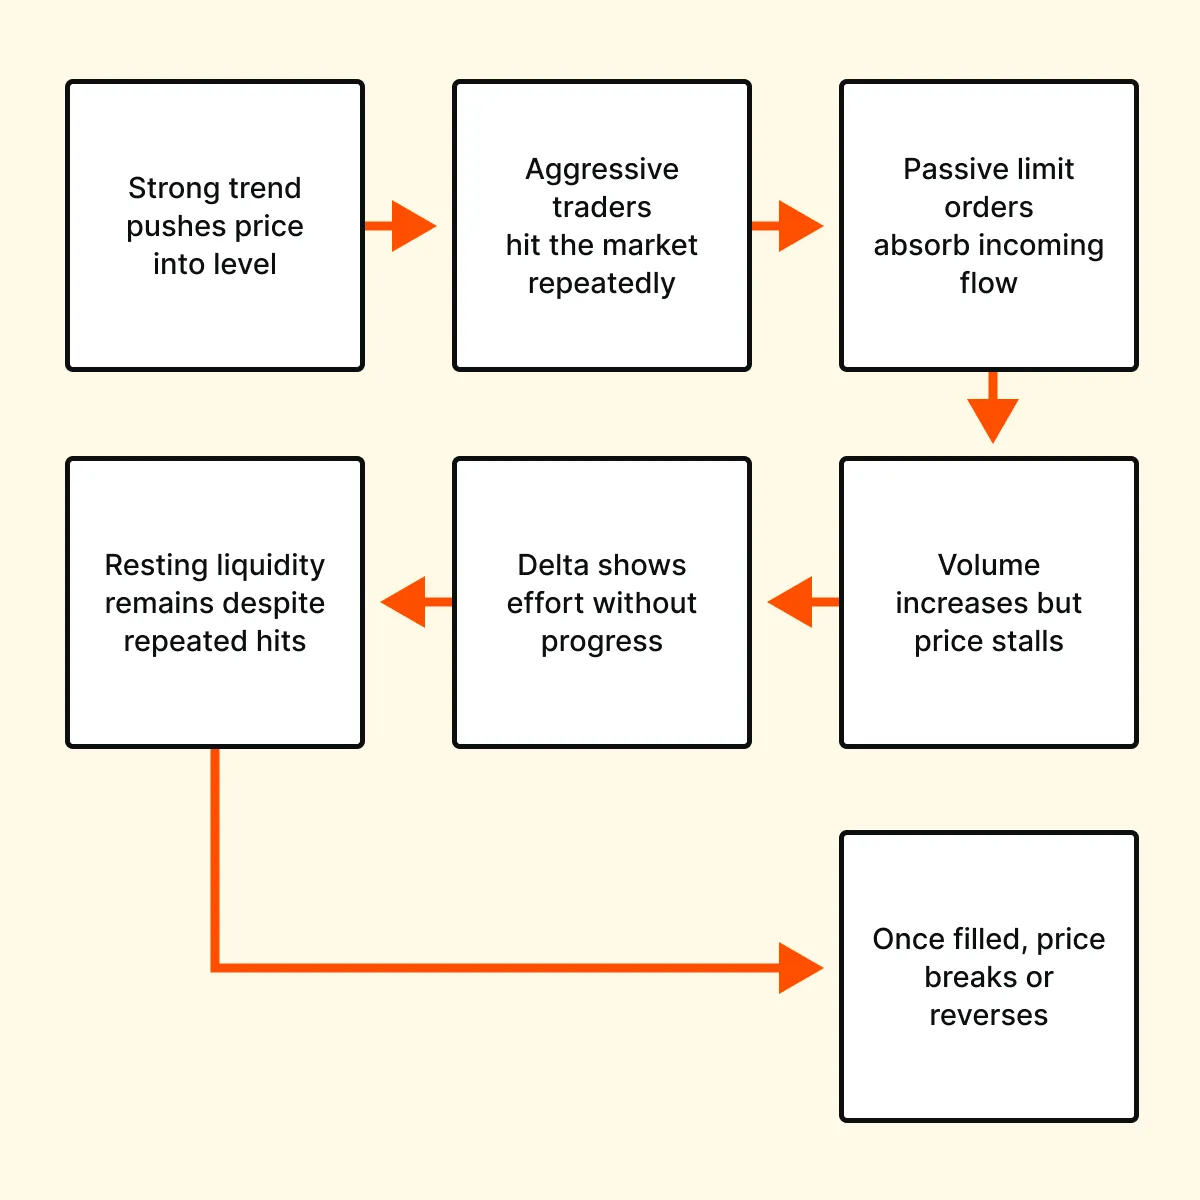
Why Price Stalls Without Obvious News or Volume Changes
When the price suddenly pauses, most traders assume the market is confused or waiting for news. But that’s not true! In reality, that pause is often a hidden battle in order flow. Don’t confuse it with “uncertainty”. Let’s understand what is really happening:
-
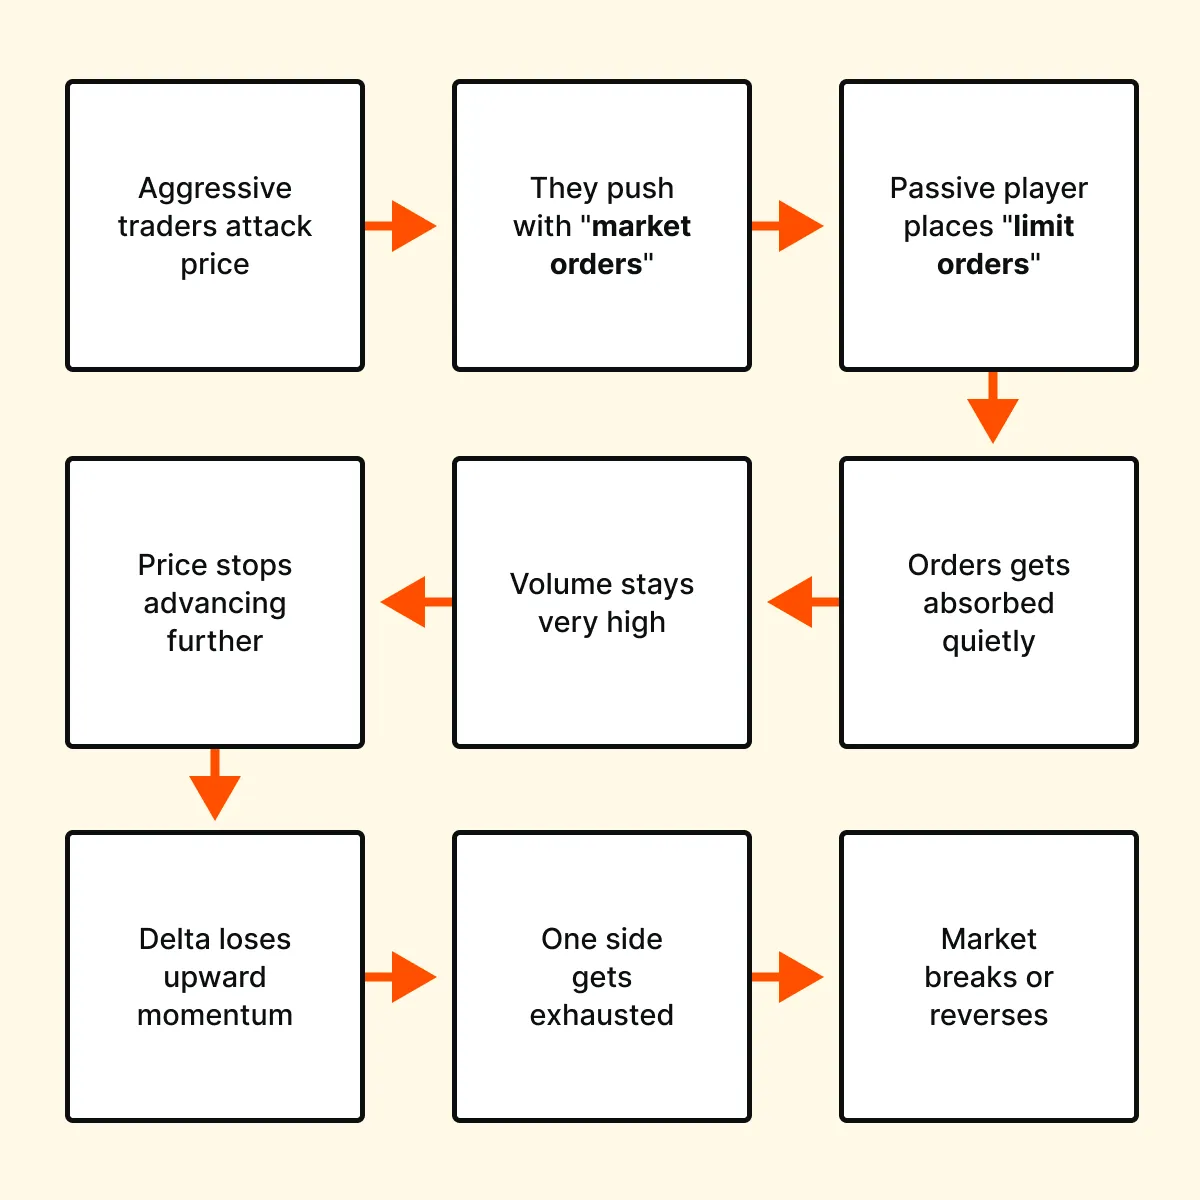
- Aggressive traders keep buying or selling at the market.
- They are trying to push the price further.
- A large passive participant steps in with limit orders.
- They absorb all that pressure.
-
- Volume remains high because trading continues heavily.
- However, the price stops moving because every aggressive order is quietly being filled.
- Next, the Delta begins to flatten as buyers and sellers meet at the same level.
- Eventually, one side runs out of fuel.
- This exhaustion leads to either a breakout or a reversal.
Never saw this happening? That’s because this entire process can happen very fast (sometimes within seconds). But realize that this is how markets shift from:
- A strong push (impulse)
to
- A temporary pause (balance) before choosing the next direction.
Recognizing this is a core skill in passive absorption trading because the stall itself often signals that a large player is defending or building a position. For more clarity, let’s study an example related to ES Futures:
-
- Price runs quickly toward 4650.
- Buyers are aggressive and keep lifting offers.
- Usually, the price should keep climbing.
- But suddenly:
- Delta stops expanding,
- Liquidity builds at the high, and
- Price freezes despite strong buying.
- Now, that stall is not random.
- It’s a passive seller absorbing all incoming buy orders.
- After they finish, the market decides:
- If buyers overpower the absorption, the price breaks higher.
- If the passive seller holds control, the price drops and rotates lower.
So, from now on, how will you interpret a price stall without news? It is a hidden transfer of control and a prime setup area for passive absorption trading.
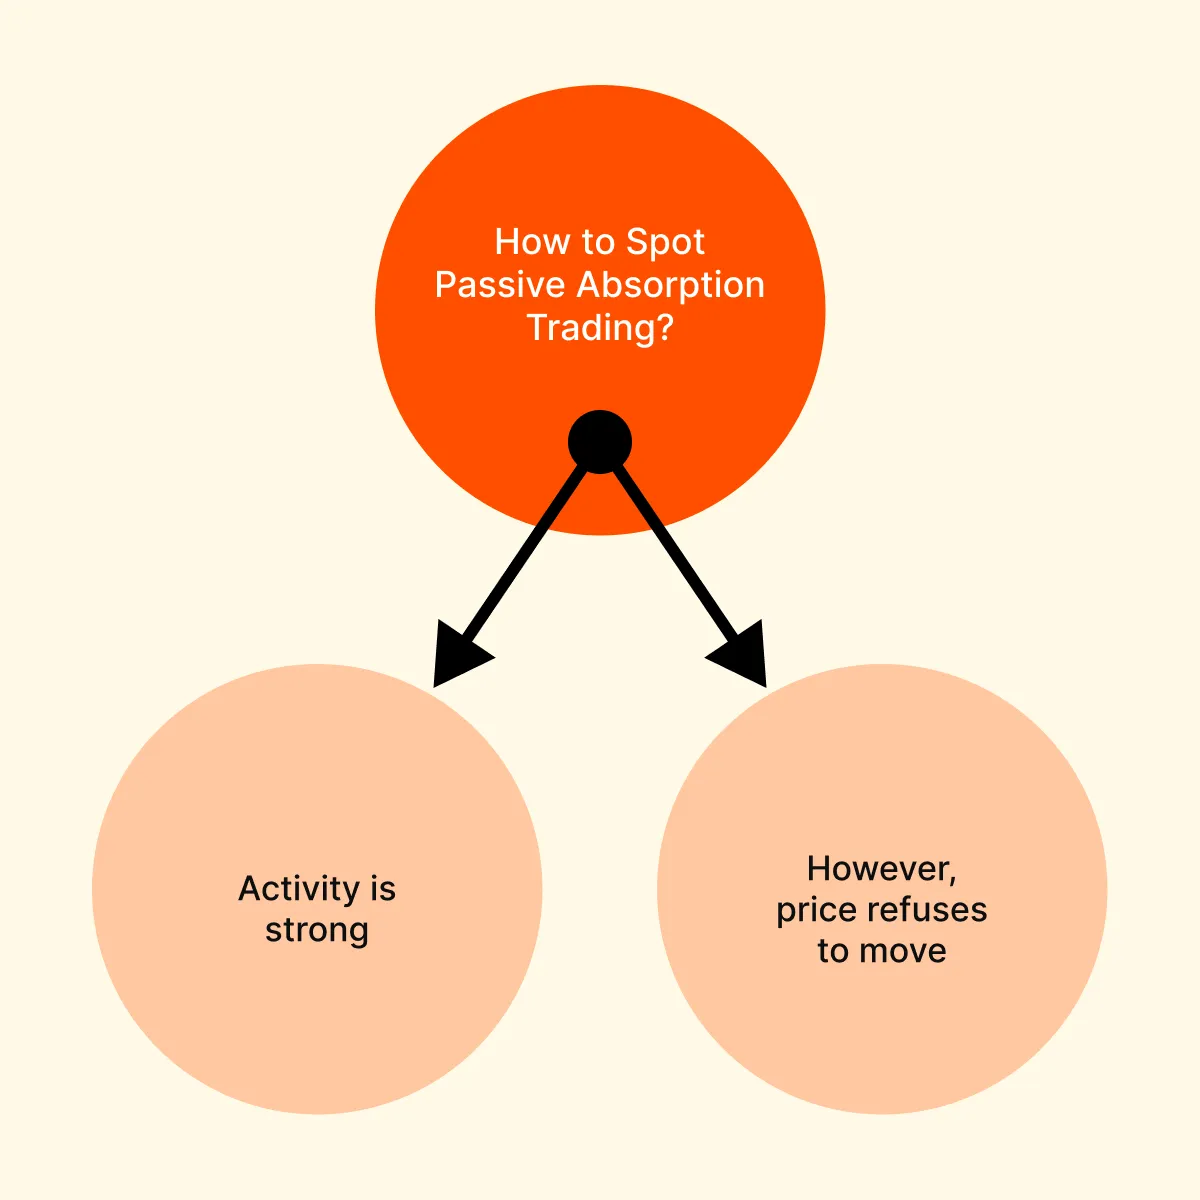
How to Spot Passive Absorption in Real Time
Do you think passive absorption = big candles? Nope! You can’t spot it using a candle chart because it’s about hidden behavior. In such a market phase, prices appear slow or stagnant, but trading activity is intense.
Okay, so how can you spot it? Below are five main ways you can spot passive absorption trading:
1. Heavy Volume at One Price
Let’s say in the market you observe that a large number of trades keep executing at the same price. Now, this signals that aggressive market orders are being absorbed rather than pushing the market forward.
In a normal trend:
- Heavy buying should lift the price,
and
- Heavy selling should drive it lower.
But during passive absorption, volume increases without expansion. Now, what does this tell you? A larger participant is quietly filling incoming orders at that level. Always remember that in passive absorption trading, “clustered volume” is one of the earliest signs that momentum is being stalled by hidden liquidity.
2. Liquidity That Refuses to Move
A strong passive interest can be observed when:
- Large limit orders are sitting at a price level,
and
- Staying there despite repeated hits.
In such situations, liquidity normally pulls back as the pressure increases. But when it remains stable, it means someone is intentionally allowing traders to execute into it. This behavior shows control + patience.
In passive absorption trading, this is highly critical because it reveals that a larger player is defending a level instead of chasing price.
3. Delta Stops Confirming Price
First, understand that delta measures “aggressive buying versus selling”. During absorption, aggressive traders continue hitting market orders in one direction. But still, the price fails to respond. So, what happens eventually? Delta begins flattening or even reversing while the price still looks unchanged. This divergence is powerful.
It shows that:
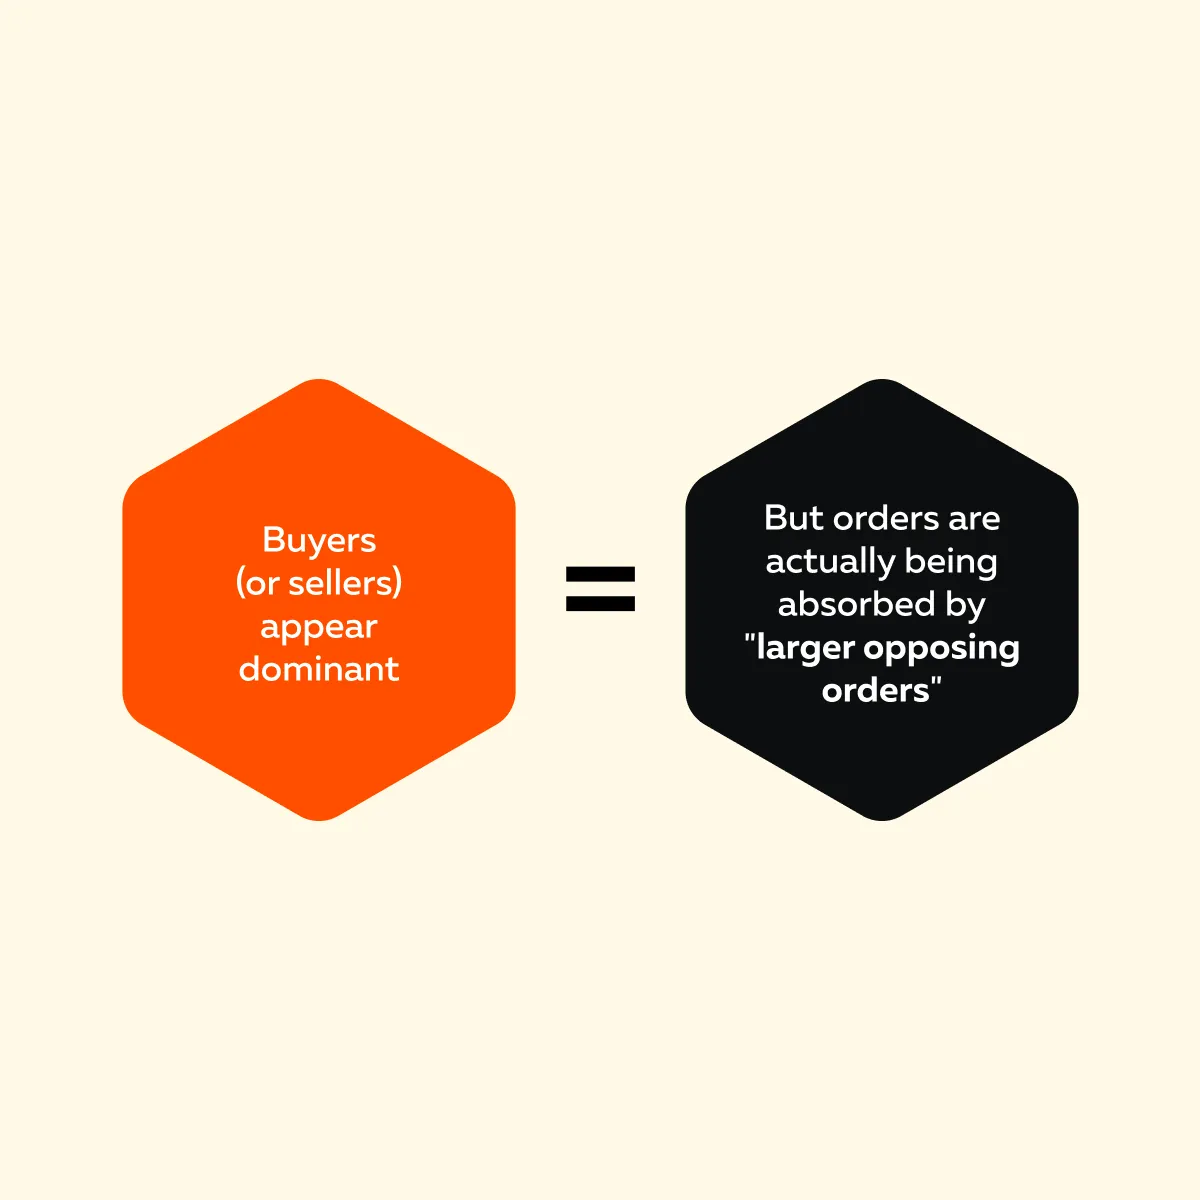
Realise that in passive absorption trading, “delta failure” is a warning that momentum is fake and controlled by a hidden participant preparing for the next move.
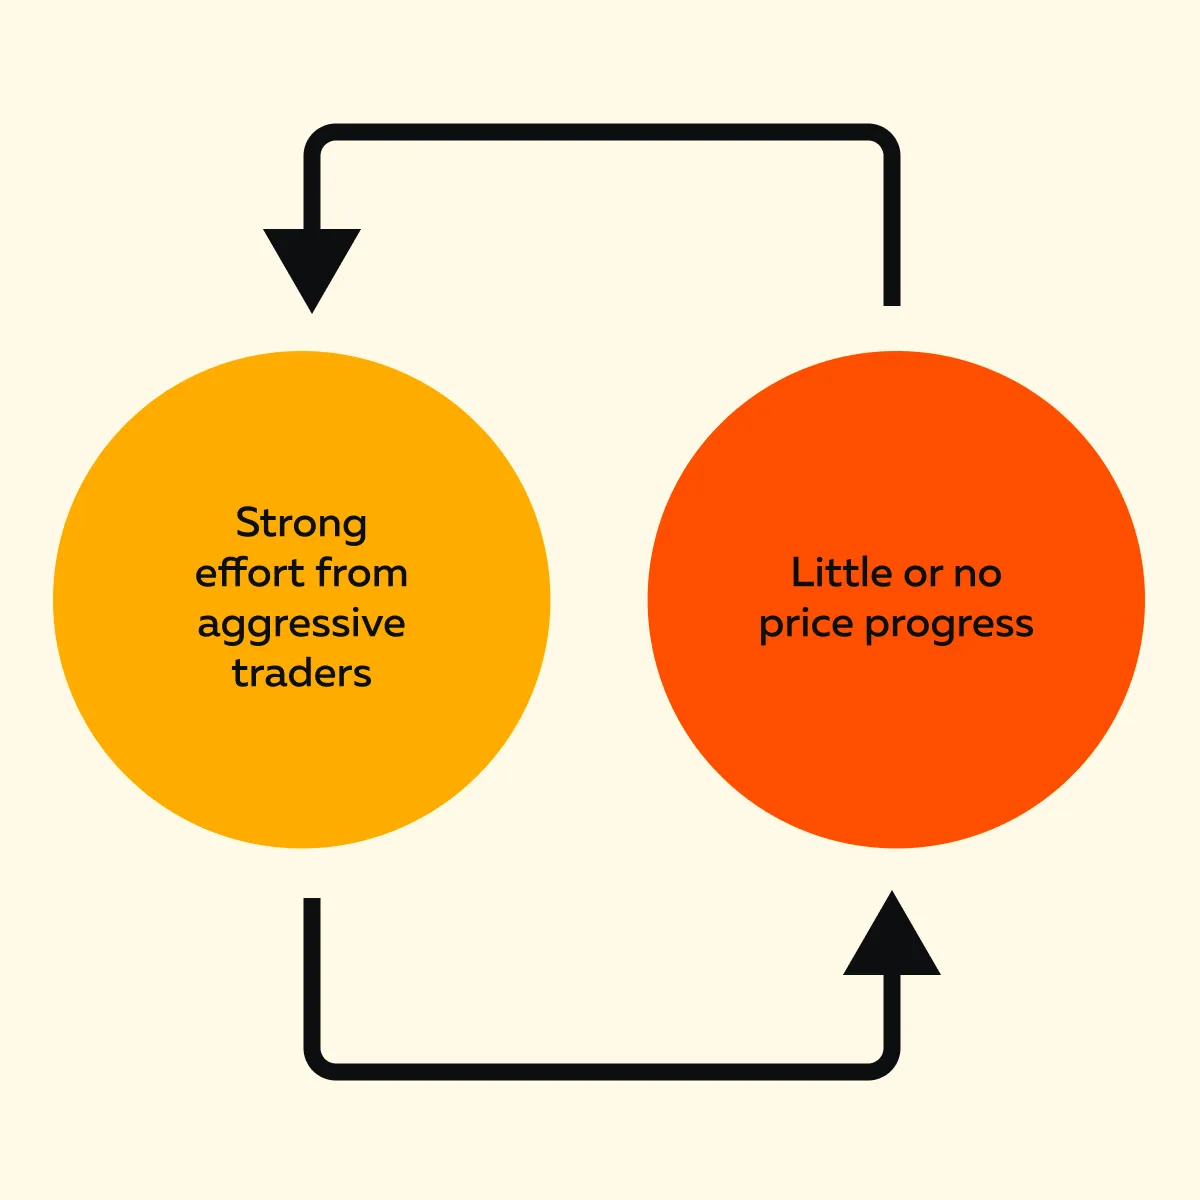
4. Price Compression
As absorption continues, the price gets trapped in a “narrow range”. Why? That’s because aggressive orders cannot push through the passive wall. This block creates a tight consolidation zone with repeated tests at the same level.
The common error? Traders often mistake this for indecision, but it’s actually pressure building. The passive side keeps absorbing until the aggressive side weakens. In passive absorption trading, “compression” is crucial because it signals that:
- The market is storing energy before a breakout,
or
- A reversal is triggered by the completion of absorption.
5. Sharp Move After Absorption Ends
Once the passive participant finishes accumulating or distributing, the price suddenly breaks out of the “compressed zone”. But why does this happen?
Now, this is how you can analyze this situation to make price predictions:
- If the passive trader was absorbing with the intent to buy, the price rallies as the “supply disappears”.
- If they were absorbing with the intent to sell, price drops once the buying dries up.
In passive absorption trading, this final expansion confirms the purpose of the absorption. For more clarity, let’s study an example:
- On Bookmap, you notice a “thick bright liquidity band” above the price.
- Buyers keep attacking it.
- As a result, volume increases, but price doesn’t rise.
- The level holds firm.
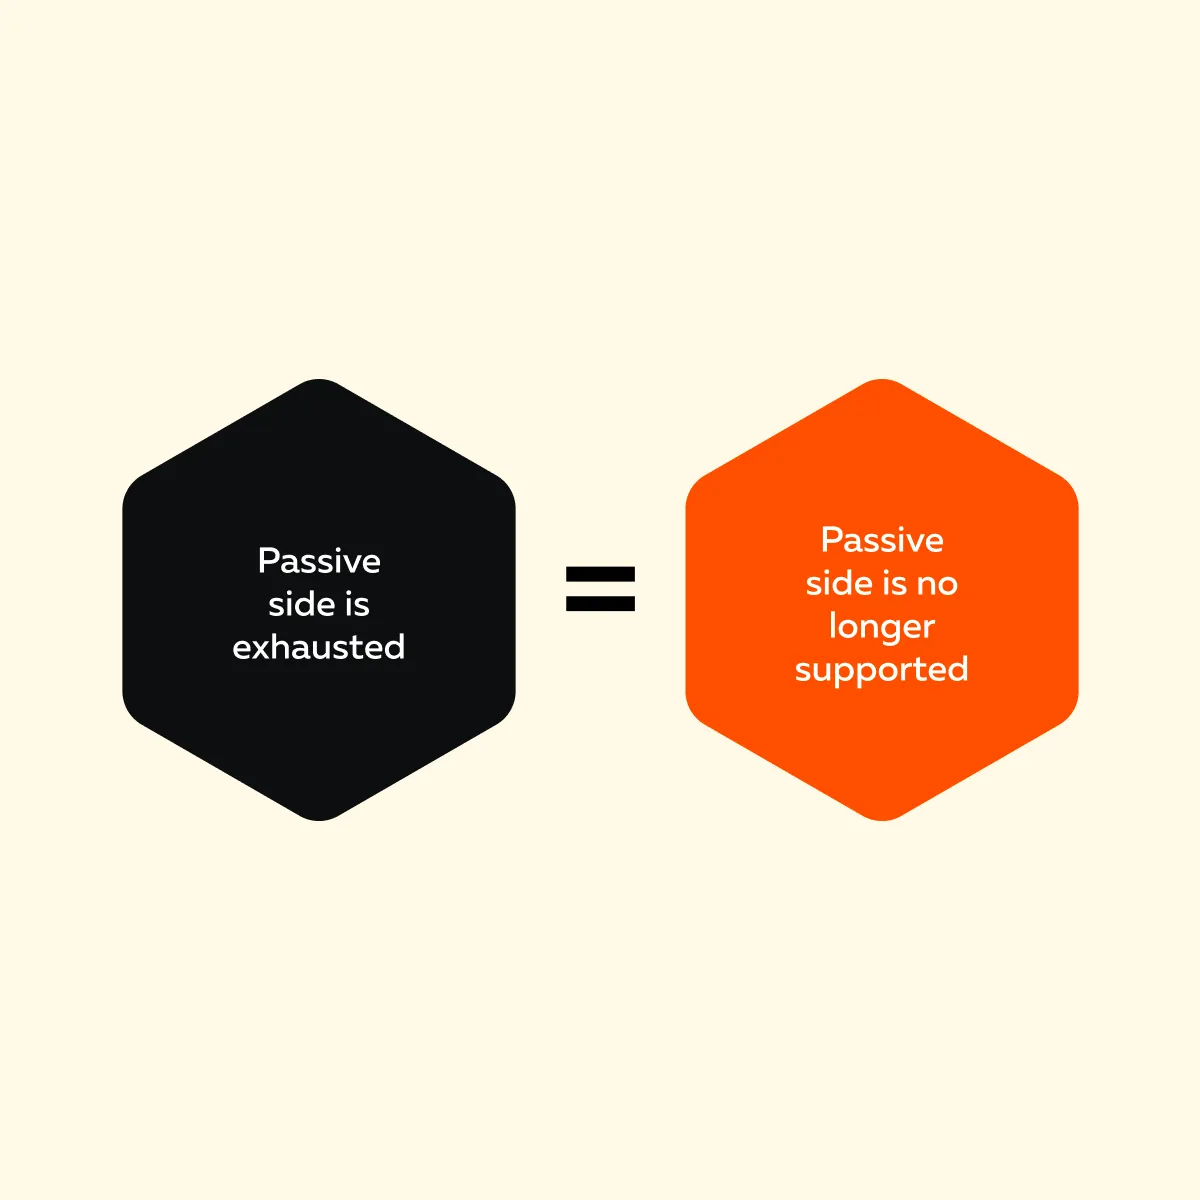
- The interpretation? A passive seller is absorbing every buy order.
- It is a warning that buyers may soon lose control.
Trading Around Micro Pullbacks and Absorption
As a trader, do you ignore micro pullbacks? Don’t do that! They may look small, but they carry essential information. These pauses show that a passive participant is absorbing aggressive orders. As a result, traders don’t rush to enter during the stall. Instead, they wait for proof of who actually wins control.
Let’s understand how to handle these situations better:
A) Wait for the Resolution
Let’s say in the market, price pauses + volume keeps printing. In such a condition, many traders jump in early, thinking the trend will continue. But that’s risky! The stall only tells you that the absorption is happening (not the direction). Always remember that in passive absorption trading, patience is key.
So, what must you do as a trader? Let price break or reject the level first. This patience will allow you to know whether the passive side was accumulating or distributing.
B) Use Delta Confirmation
After the pause, watch the Delta closely. Let’s see how you can interpret it:
C) Adjust Stops Carefully
Micro pullbacks often create fake dips or spikes. They are designed to shake out “tight stops” before the real move begins. Now, if you place stops too close to the inside of the absorption zone, you might get removed just before a continuation. Thus, in passive absorption trading, stops should be set beyond the defended liquidity level (not within the noise).
D) Record and Review examples
Want the best way to master passive absorption trading? It is through “replay study”. As a trader, you must watch past sessions where absorption formed micro pullbacks. The advantage? Your eyes get trained to recognize the pattern faster in real time. Be aware that passive absorption trading is highly visual + improves with repeated exposure.
For more clarity, let’s study an example:
- On Bookmap, price rallies strongly.
- It hits a thick liquidity band.
- As a result, buying continues, but price stalls.
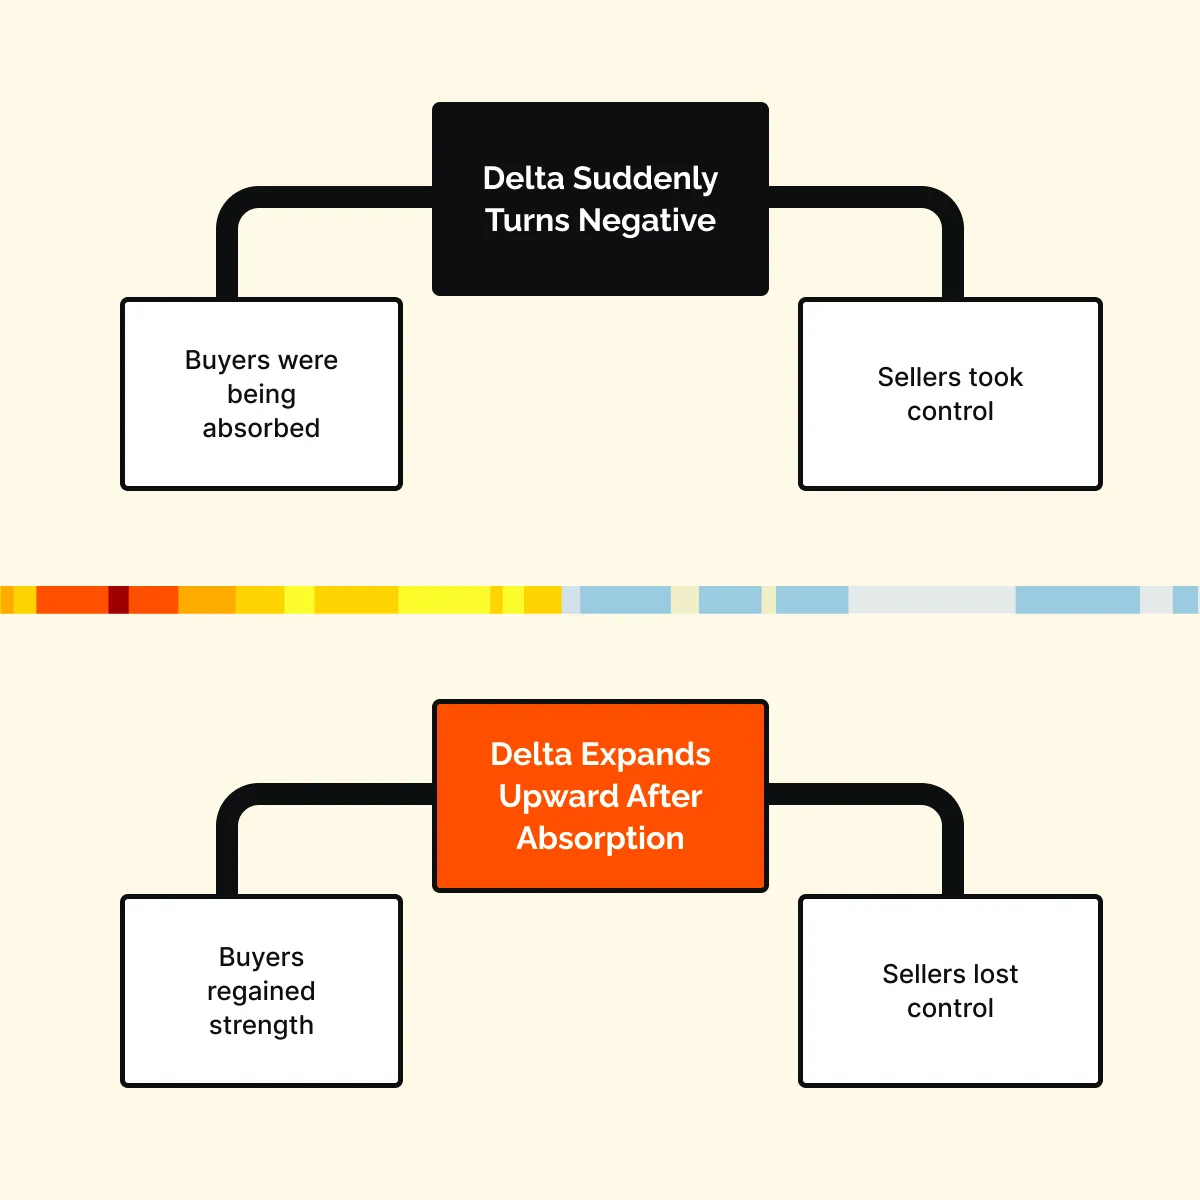
- Then Delta slows and turns slightly negative.
- So, what does this show? Sellers are absorbing orders + gaining control.
By waiting for such confirmations, you can prevent an early long entry and align your trade with the actual order flow.
Conclusion
Till now, you must have understood that price rarely pauses without a reason. What appears to be “hesitation” is usually a hidden transfer of positions between aggressive traders and larger, passive participants.
So what should be your approach? Try to spot micro pullbacks + absorption. They show where real business is taking place, which is why passive absorption trading focuses on behavior beneath price rather than reacting to indicators or news.
Additionally, when you learn to read order flow, stalls become information instead of confusion. You begin to see who is defending levels, who is getting trapped, and when momentum is likely to continue or reverse. The advantage? These quiet moments usually lead to the strongest moves.
Do you want to visualise this process? You may start using the advanced real-time market analysis tool Bookmap. Using it, you can see liquidity, volume, and Delta as they interact. Learn to recognize passive absorption before a move resumes → Compare Packages.
FAQs
1. Why does price stop moving even when volume stays high?
Price stalls because a large passive trader is sitting at a level and filling every incoming market order. In such a market, buyers or sellers keep trading heavily, so volume stays high. But the price cannot move because those orders are being absorbed.
In passive absorption trading, you must interpret it as a key signal that strong hidden liquidity is controlling the level.
2. What is the difference between a micro pullback and a reversal?
A micro pullback is a “short pause” or “small dip” within an existing trend, during which absorption temporarily slows the price. The trend still remains intact. In contrast, a reversal happens when the absorbing side entirely overpowers the aggressive traders. After this, the price is pushed firmly in the opposite direction.
3. Can you predict absorption before it happens?
You cannot predict absorption with certainty. However, you can only prepare for likely areas such as – Prior highs, Prior lows, or heavy liquidity zones. Realize that “real confirmation” only comes when:
- Price stalls,
- Liquidity holds firm, and
- Delta stops pushing price forward.
Usually, in passive absorption trading, the trading behavior always confirms the setup (not the assumptions).
4. How does Bookmap help identify passive absorption?
Bookmap is an advanced real-time market analysis tool. Using it, you can:
- Visually see where large limit orders sit,
and
- Whether they stay while being hit repeatedly.
You can also see volume clustering + Delta slowing at the same level. This visualization allows traders to spot absorption as it happens.
Sign Up Now