See price more clearly in real time.
Compare plans to access deeper market visibility for price.
Trading Basics
September 5, 2025
SHARE
The Journey of Price: Why Markets Move the Way They Do
Do you think price movement in trading is random? Time to put aside that illusion! In reality, every tick is the result of buyers and sellers negotiating in real time. Sometimes this negotiation happens politely, and sometimes it’s like a bidding war at an auction.
The impact? Due to these negotiations, the market shifts and liquidity appears or vanishes. Also, the value of financial assets is constantly being tested. Ultimately, just like any busy marketplace, price moves to where the most willing buyers meet the most willing sellers!
So, want to understand the journey of price better? Trade with 100% clarity instead of guesswork in 2025. In this article, you’ll understand why markets move and how to read rotations, breakouts, traps, and reversions. Also, you will see how advanced real-time market analysis tools, like Bookmap, let you trade better.
The Market as an Auction: Price Seeks Agreement
The market works like a live auction where buyers and sellers are constantly negotiating. Do you know why price moves? Because it tries to match the most willing buyer with the most willing seller. Let’s see how:
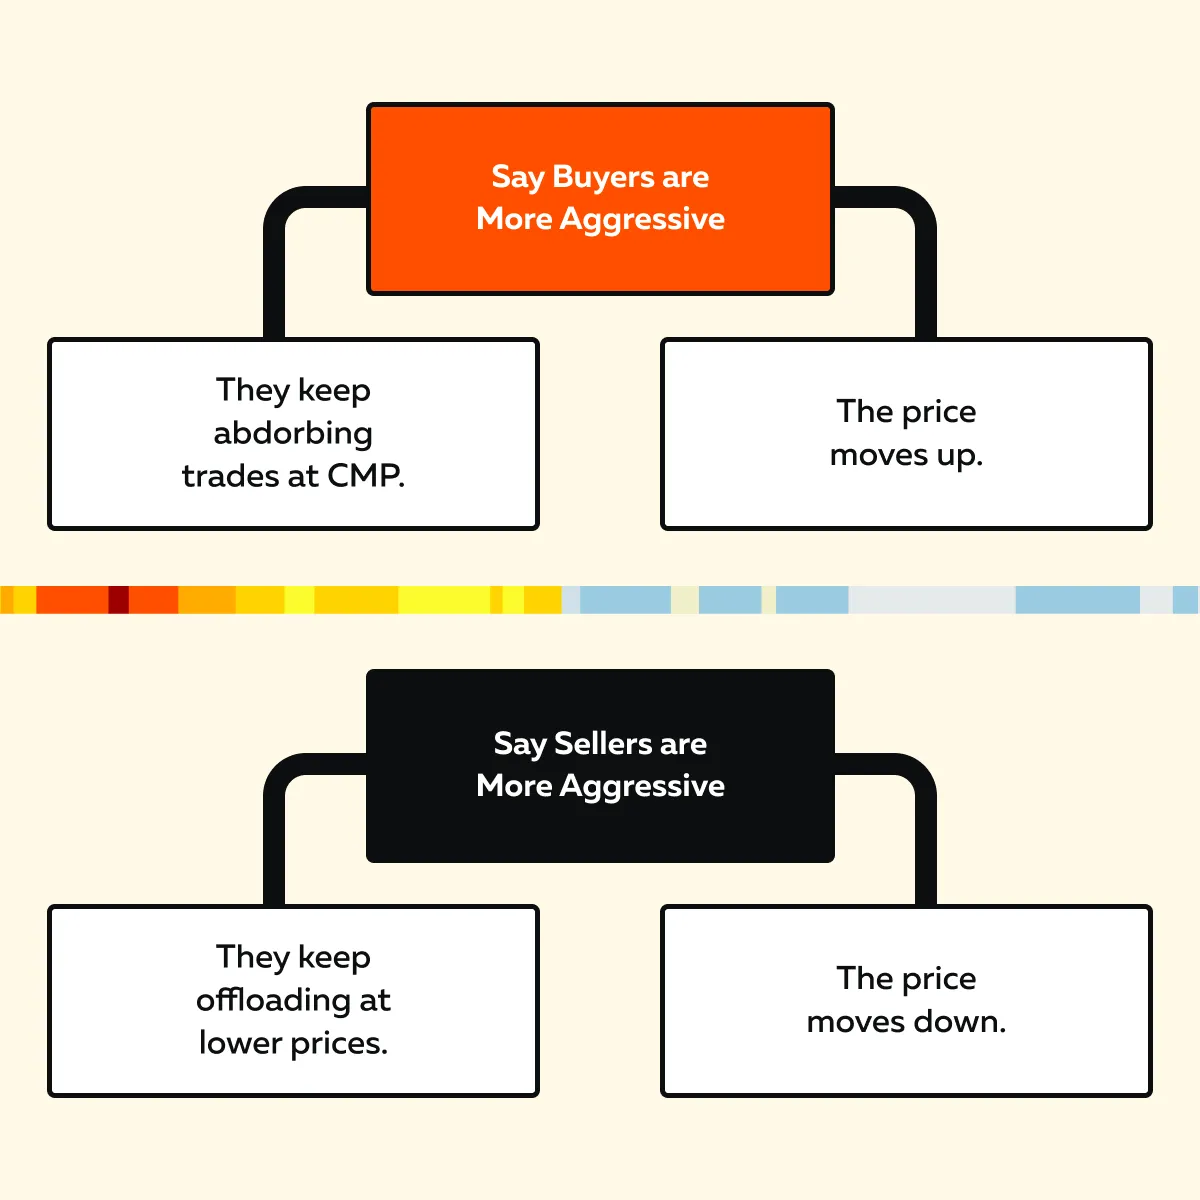
Note that if buyers are more aggressive + they keep accepting higher offers = the Price moves up. This spike in price does not happen because it “wants to go higher,” but because sellers aren’t willing to sell at lower levels.
In contrast, the price drops if sellers are stronger and buyers don’t step in. It keeps falling until it finds enough demand to trade again.
Remember that the goal isn’t to hit a specific target! Instead, it’s to find a balance, where both sides agree the price is fair. That’s why we often see price movement in trading slow down or consolidate near areas like VWAP or high-volume zones. For those unfamiliar, these areas act like “fair value magnets”. At these zones, the market pauses because many trades have already taken place there.
Let’s understand through an example:
- Let’s assume that in ES futures, the price sticks to a high-volume level from the morning during the lunch session.
- Now, this isn’t random!
- The market is accepting that price as fair value.
- The market will remain there until new news or events push it out of balance.
It’s like a tug-of-war! Price sits in the middle when both sides are equally matched, and only moves when one side pulls harder. Still want to gain more clarity? Learn the auction market theory from here.
What Actually Moves Price: Aggression Meets Absorption
In trading, price movement happens when aggressive buying or selling overpowers the other side. Most traders think it is only about supply and demand. But that’s not true! It’s about how forcefully traders act, and whether the opposite side can absorb that pressure.
Let’s understand in detail:
1. Market Orders Drive Movement
Market orders are the real engine behind how prices move! When you place a market buy order, you’re:
- Crossing the spread,
and
- Paying whatever the seller is asking.
Now, that creates buying pressure, which pushes the price upwards. The surge continues until sellers have enough resting limit orders to absorb it.
As a result, the stronger and more frequent these aggressive orders are, the faster the price moves. And, in thin markets (low liquidity), even a small burst of aggression can cause a significant price movement.
For Example:
- Let’s assume you see a burst of green dots hitting the offer on our real-time market analysis tool, Bookmap.
- Now, if the price immediately jumps up a level afterwards, it is clear that buyer aggression is winning the auction.
2. Limit Orders: Determine Where Price Can Go
Limit orders are like signposts! They show where buyers and sellers are willing to trade. However, they can also act as roadblocks for price movement in trading. Let’s see how:
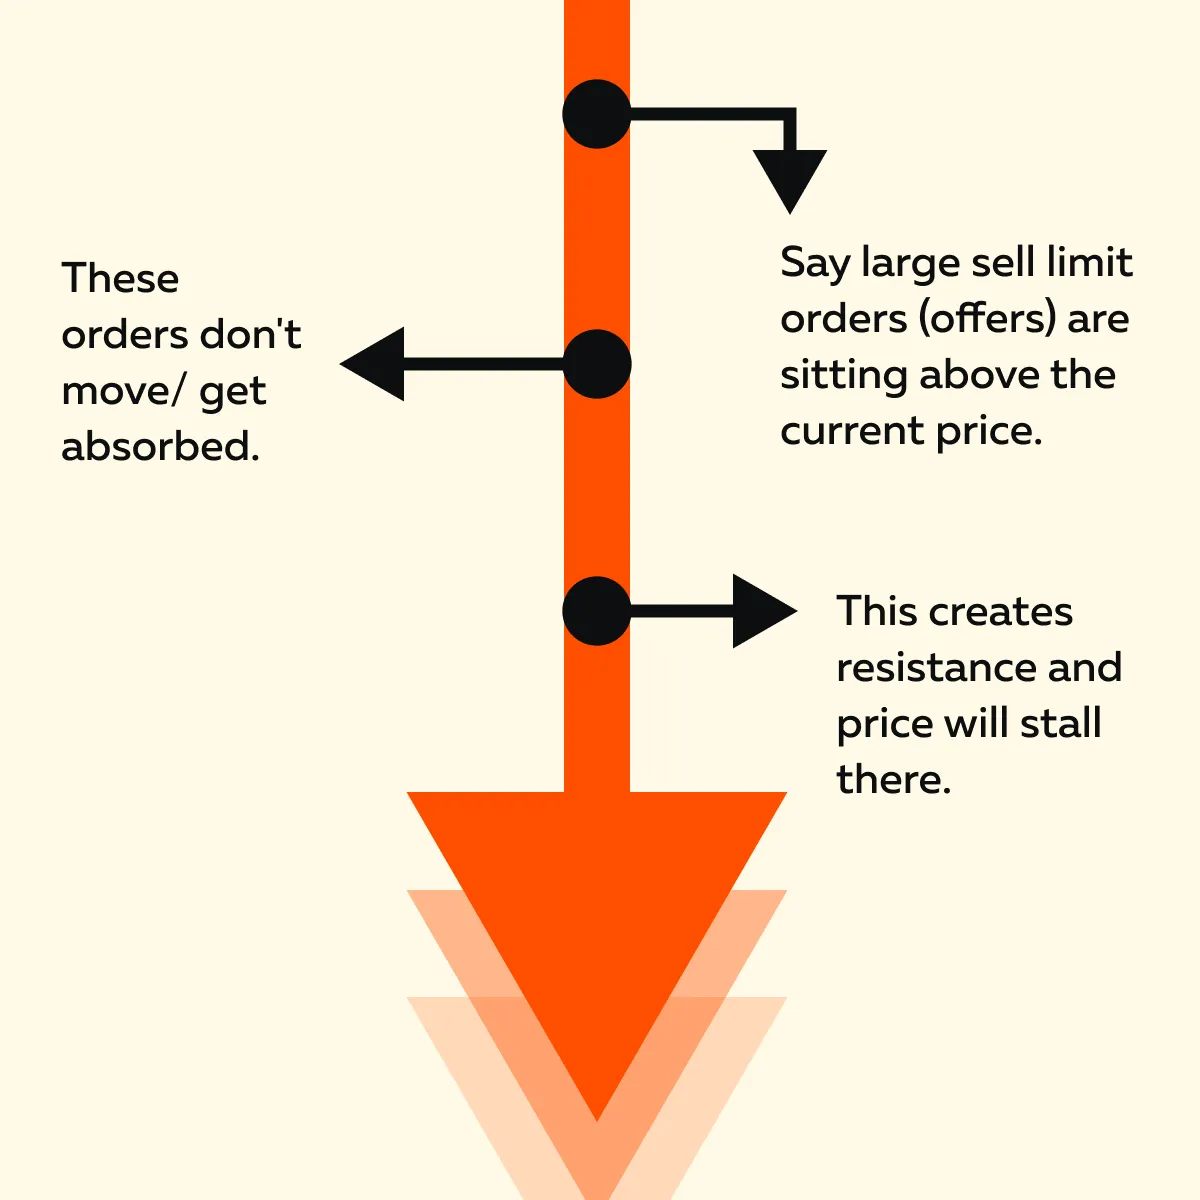
Now, you must be wondering why the price stalled there? That’s because buyers need to eat through that liquidity to move higher.
The Contrary
On the flip side, let’s assume large buy limit orders (bids) are sitting below the price. They act like a “floor” and slow the price drops. If these orders suddenly disappear (termed “wall absorption”), the price can rapidly shoot upwards. These gaps in liquidity are also sometimes called “air pockets.”
As a trader, you should note it’s not just about who’s buying or selling aggressively! Price movement also depends on where other traders are waiting to buy or sell. For example:
- Let’s assume you observe on our tool, Bookmap, that price moves toward a big bid wall.
- Now, many expect a bounce.
- However, instead, the wall gets absorbed.
- This means someone is selling heavily into that demand.
- That’s a signal the “floor” isn’t being defended.
- As a result, the price may break lower.
Curious how professionals spot intent behind price? Bookmap reveals what candles don’t. Choose your plan
Rotations, Ranges, and Breakouts: Each Phase Has a Purpose
Markets don’t just run in straight lines! Yes, most of the time, price movement in trading switches between calm periods where the price stays in a range and sudden bursts where it breaks out and runs.
By understanding these phases, you can clearly see why markets move and whether a breakout is likely to stick or fail. Let’s understand this concept in detail:
1. Rotations (Balance)
Rotation is when the price fluctuates inside a clear band. Let’s see how:
On our Bookmap’s heatmap, you’ll see a thick horizontal band. It represents the zone where significant trading happened (a high-volume node). You must realize that VWAP or the session POC often sits inside that band.
But Why Does It Happen?
Rotation is the market agreeing on value! Without fresh news or large aggressive orders, buyers and sellers meet roughly the same prices to do business. So, what causes rotation? Check out these three major events:
- Orders keep getting matched inside that range. Buyers hit the ask and sellers hit the bid. However, neither side pushes the price far.
- Large passive liquidity (limit orders) sits at the top and bottom of the range. It acts like walls that hold the price in place!
- Aggressive orders are small or balanced. Each “buy push” is met by a “sell push” of similar size.
All this keeps the price bouncing between the same levels! This behaviour builds volume and creates that back-and-forth rotation phase.
How to Read It?
The rotation continues if the edges hold and get absorbed (big bids defend the floor / big asks hold the ceiling). However, if liquidity at one edge is pulled or consumed quickly by a string of market orders, a transition toward a “breakout” is likely.
To spot this, you can watch VWAP/POC. Usually, the price reverts from there when nothing new influences price movement.
2. Transitions (Imbalance)
A breakout happens when one side either steps back or gets overwhelmed, which could be any of the following:
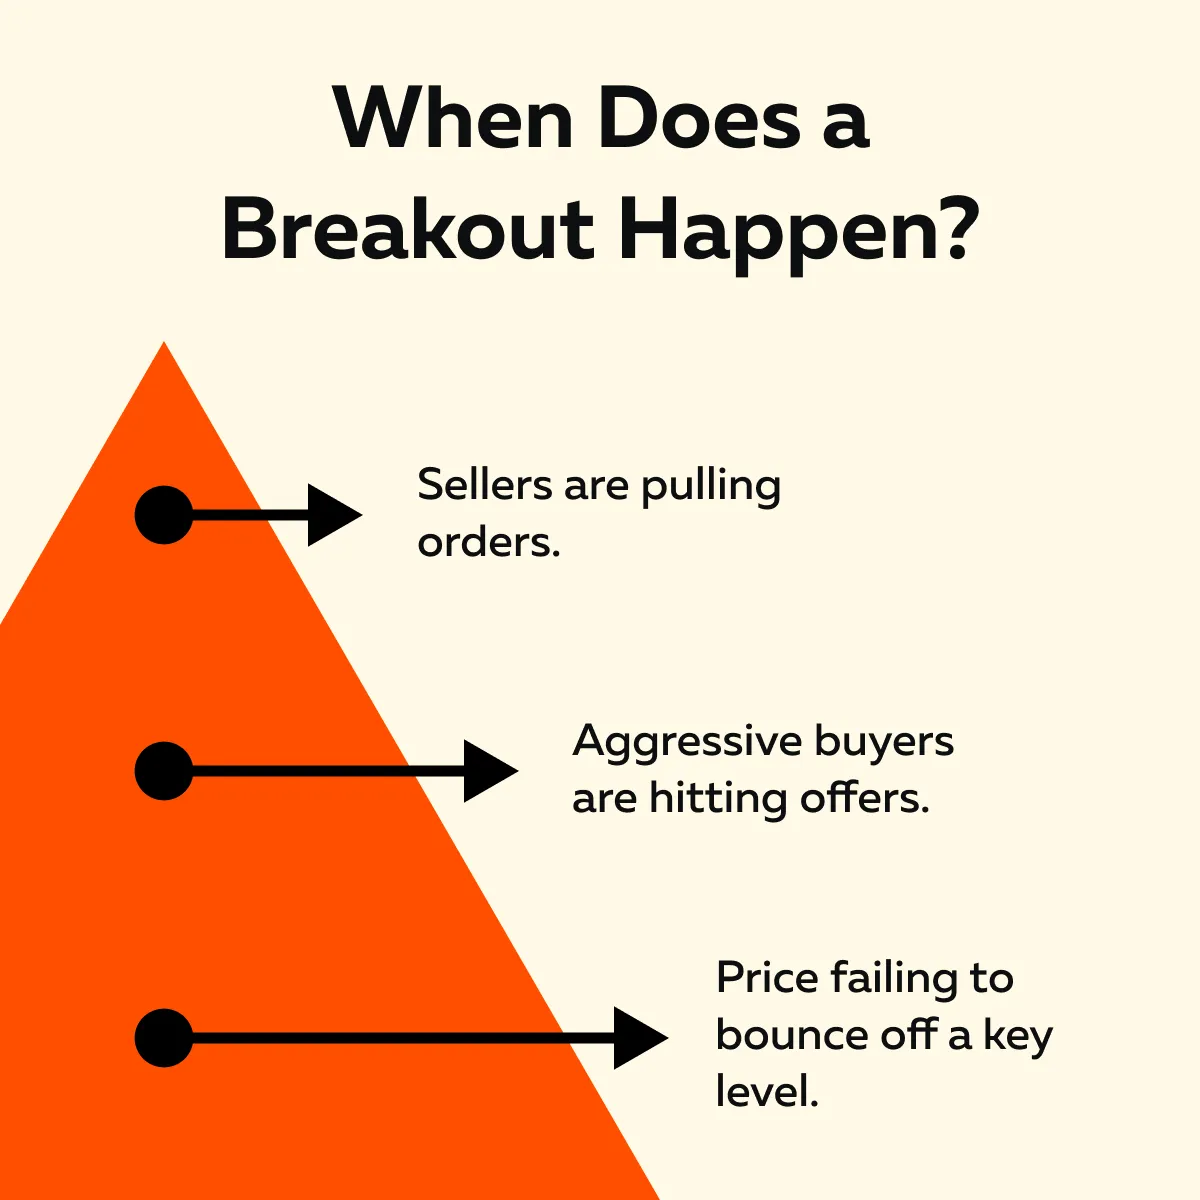
Let’s understand better through this example:
- Let’s assume ES trades in a 10-point range for hours.
- After that, suddenly, liquidity at the top disappears.
- Now, aggressive buyers can push the price higher.
- This event creates the breakout.
Want to stop guessing why the price moved? Watch it live with Bookmap’s order flow tools. Start here
3. Acceptance or Rejection
After a breakout, the big question is – Will the price stay there? For the unaware:
- Acceptance means new orders appear + volume builds. As a result, the price holds above the old range.
- Rejection means the price quickly falls back into the old range. Now, the price is re-auctioned at the previous value.
For example:
-
- On our platform, Bookmap, you see price breaks and resistance.
- Also, you see bid stacking below it.
- Now, that’s a sign of acceptance!
- If no bids appear and the price drops back, that’s rejection.
Stop Runs and Traps: The Market’s Cleaning Process
A stop run happens when the price pushes through a level where many traders have stop-loss orders. Is the market being “evil”? Nope! It’s just part of how price moves and how liquidity gets found.
When traders place stops in obvious spots (like just above a recent high or below a recent low), those stops become a liquidity pool for larger players. Let’s understand what happens next:
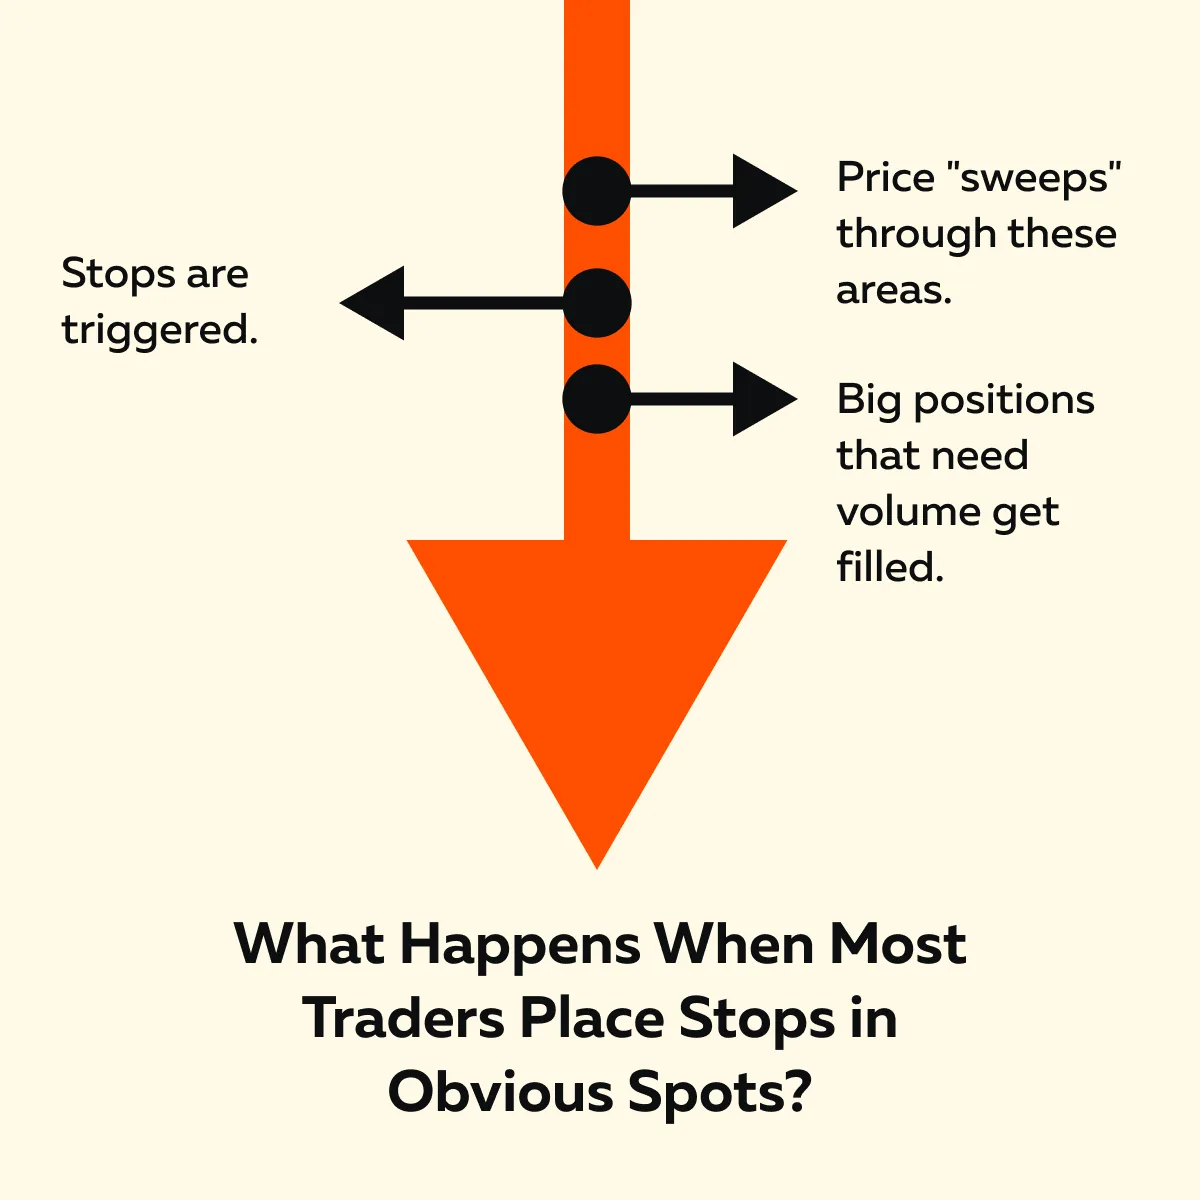
Always remember that the key is not the stop run itself! Instead, what happens right after is more important. Post stop run, check for the following:
- Does new liquidity step in and hold the price there (acceptance)?
or
- Does price quickly reverse and fall back into the prior range (rejection)?
For example:
-
- Let’s assume crude oil spikes above the overnight high with heavy volume.
- It triggers stops.
- As a result, price stalls and then fades lower.
- Now, traders who chased the breakout get trapped.
- However, the spike still served a purpose!
- It allowed large sellers to fill orders against that burst of buying.
Need a bottom line? Don’t fear stop runs! Instead, read the aftermath. You must realize that they are just one part of the market’s process of finding balance.
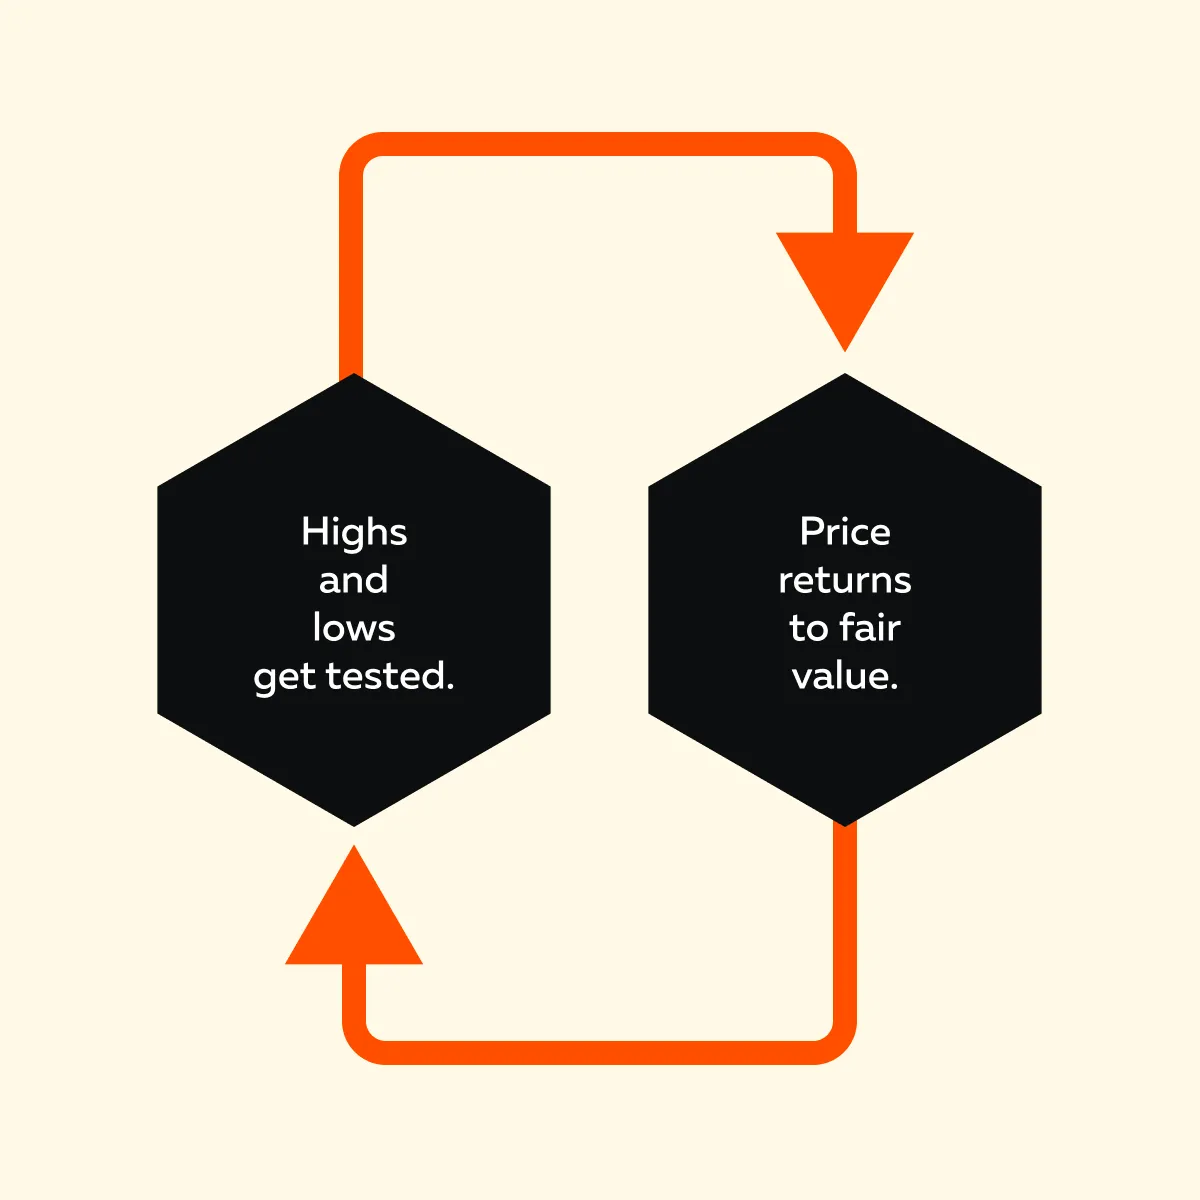
Why Price Often Returns “Home”
When there’s no fresh news or strong catalyst while trading, price movement drifts back to where the market last agreed on value. This area is called “home”, which is usually a prior value area, like:
- VWAP,
- The point of control (POC), or
- A high-volume node.
Do you think these are magic levels? Nope! They mark where most of the trading took place before. That’s merely a zone where buyers and sellers found the price fair. Without new information to push the market into a new area, price naturally gravitates back to these zones.
Let’s understand through an example:
-
- In Nasdaq futures (NQ), a breakout might fail early in the session.
- By lunchtime, price returns to VWAP.
- This event does not happen because of some mystical “mean reversion” rule!
- Instead, it happens because that’s where:
- Most business occurred earlier,
and
- Both sides are willing to trade there again.
This pull toward value usually happens during regular trading hours (RTH) or pre-market.
Conclusion
Till now, you must have understood that price doesn’t move by chance. Instead, it follows the logic of an ongoing auction! Every tick reflects the push and pull between aggressive traders (trying to move the price) and passive traders (trying to defend their levels).
During this tug-of-war, liquidity appears or disappears. It even creates breakouts, traps, and reversions to value. When you view the market this way, price movement in trading stops feeling random and starts making sense!
Ideally, your goal isn’t to predict the exact next tick! Instead, you must read what’s happening now and understand who’s in control. Next, try to predict when that control might shift!
That’s where Bookmap helps. It gives you a 100% clear + real-time view of liquidity and order flow. You can see why markets move and make better trading decisions. See price action as it unfolds—track liquidity and volume in real time with Bookmap. Compare packages
FAQs
1. What is price discovery?
Price discovery is the process through which the market ascertains the “fair price”. It happens when:
- Buyers place market orders to buy,
and
- Sellers place limit orders to sell
The constant back-and-forth between these orders sets the current price.
2. Why does price reverse after a breakout?
Sometimes a breakout happens because stop-loss orders are triggered. This event causes a quick increase in price! However, if there’s no real buying or selling interest beyond those stops, the move can’t continue.
Now, without new traders stepping in and no liquidity building at the new level, the price usually falls back into the previous range.
3. What does it mean for the price to “accept” a level?
Acceptance means the market is comfortable trading at a new price. Acceptance happens after breaking a key level:
- Price stays there.
- Strong trading volume is built.
- New buy or sell orders are attracted.
This shows buyers and sellers agree this new area is fair value (at least for now).
4. Can I use Bookmap to understand price movement better?
Yes! Our avant-garde real-time market analysis tool, Bookmap, gives you a real-time view of:
- Where orders are placed,
- How liquidity changes, and
- How aggressive are traders when buying or selling?
Instead of just seeing candles on a chart, you see the underlying market activity. This data makes it easier to understand why price moves the way it does.
Sign Up Now