


See what the DOM reveals — and what it does not.
Compare plans to read ladder behavior, absorption, and hidden liquidity more clearly.
Trading Basics
May 28, 2026
Why Traders Misread DOM Signals: What the Ladder Shows, What It Hides, and How to Read It Better
 The Depth of Market presents an organized view of bids and offers, which naturally draws attention to visible size. This visualization creates clarity, but much of the market’s intent remains hidden beneath it.
As a result, many interpretations are based only on what is visible, while ignoring how the price actually responds. This disconnect leads to frequent misread DOM signals and common Level 2 trading mistakes.
A potentially better approach may consider behavior, context, and interaction between liquidity and aggressive flow, rather than relying solely on static numbers. Read this article to learn how to read DOM trading with greater clarity, why DOM signals fail, and how to interpret order book signals trading through real market behavior.
First, What the DOM Actually Shows
The Depth of Market (DOM) presents visible “limit orders” placed around the current price. It shows how participants are positioned at nearby levels in real time. Usually, the DOM includes the following elements:
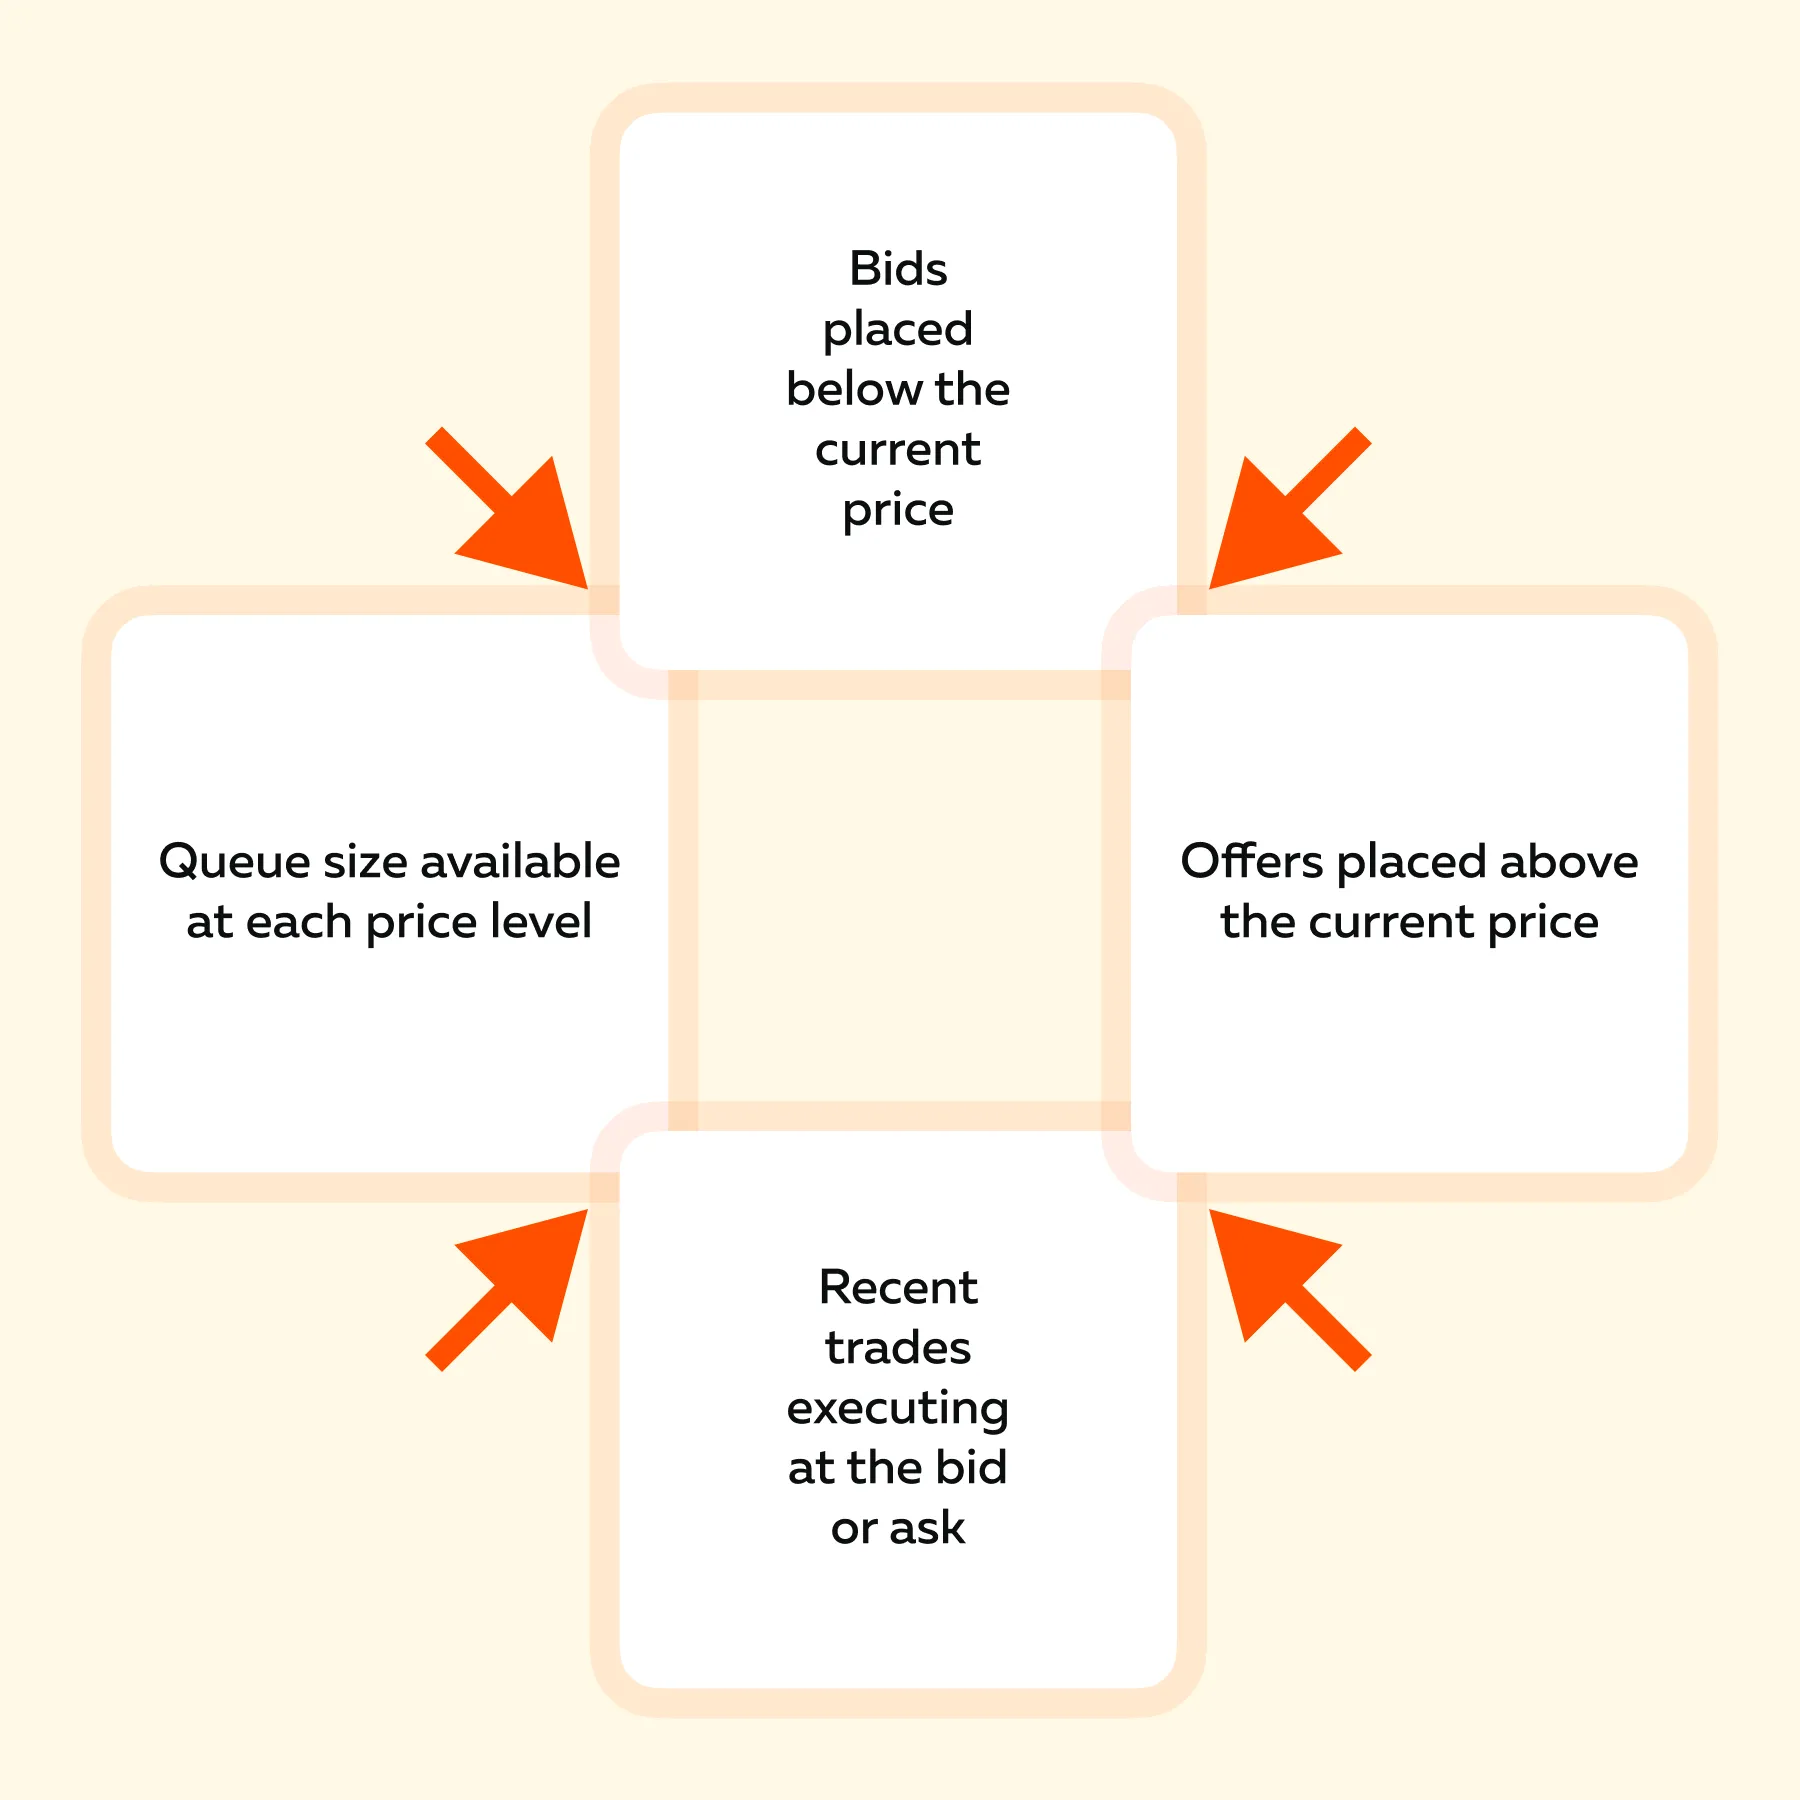
As a result, this view supports short-term execution decisions and may even improve awareness of immediate supply and demand. However, an important limitation follows. The DOM only shows displayed liquidity. It does not reveal the full intent behind orders or the broader market context.
Specifically, the DOM does not show:
- Hidden liquidity or iceberg orders beyond visible size,
- Larger participants’ positioning across higher timeframes,
- The reason orders were placed,
- Whether the displayed size will remain or be withdrawn,
- Whether aggressive participants are building momentum to break levels.
Due to this shortcoming, misread DOM signals are highly common. Understand these misreads better through an example:
- Suppose a large offer of 1,500 contracts appears above the price.
- This order is interpreted as “strong resistance”.
- However, assume that aggressive buyers continue to raise their offer.
- As a result, the level trades through despite the visible size.
Therefore, displayed liquidity may appear significant but can fail under sustained pressure, which is the basis for many incorrect reads when learning to read DOM trading.
Why Traders Trust Static Size Too Much
A common issue in level 2 trading mistakes is assigning too much certainty to visible size. Large numbers on the DOM often appear decisive, yet their meaning is not fixed. For example:
- Large bids below the price may appear supportive, and
- Large offers above the price may appear restrictive
However, “static size” is still widely used by traders as it represents the following intentions:
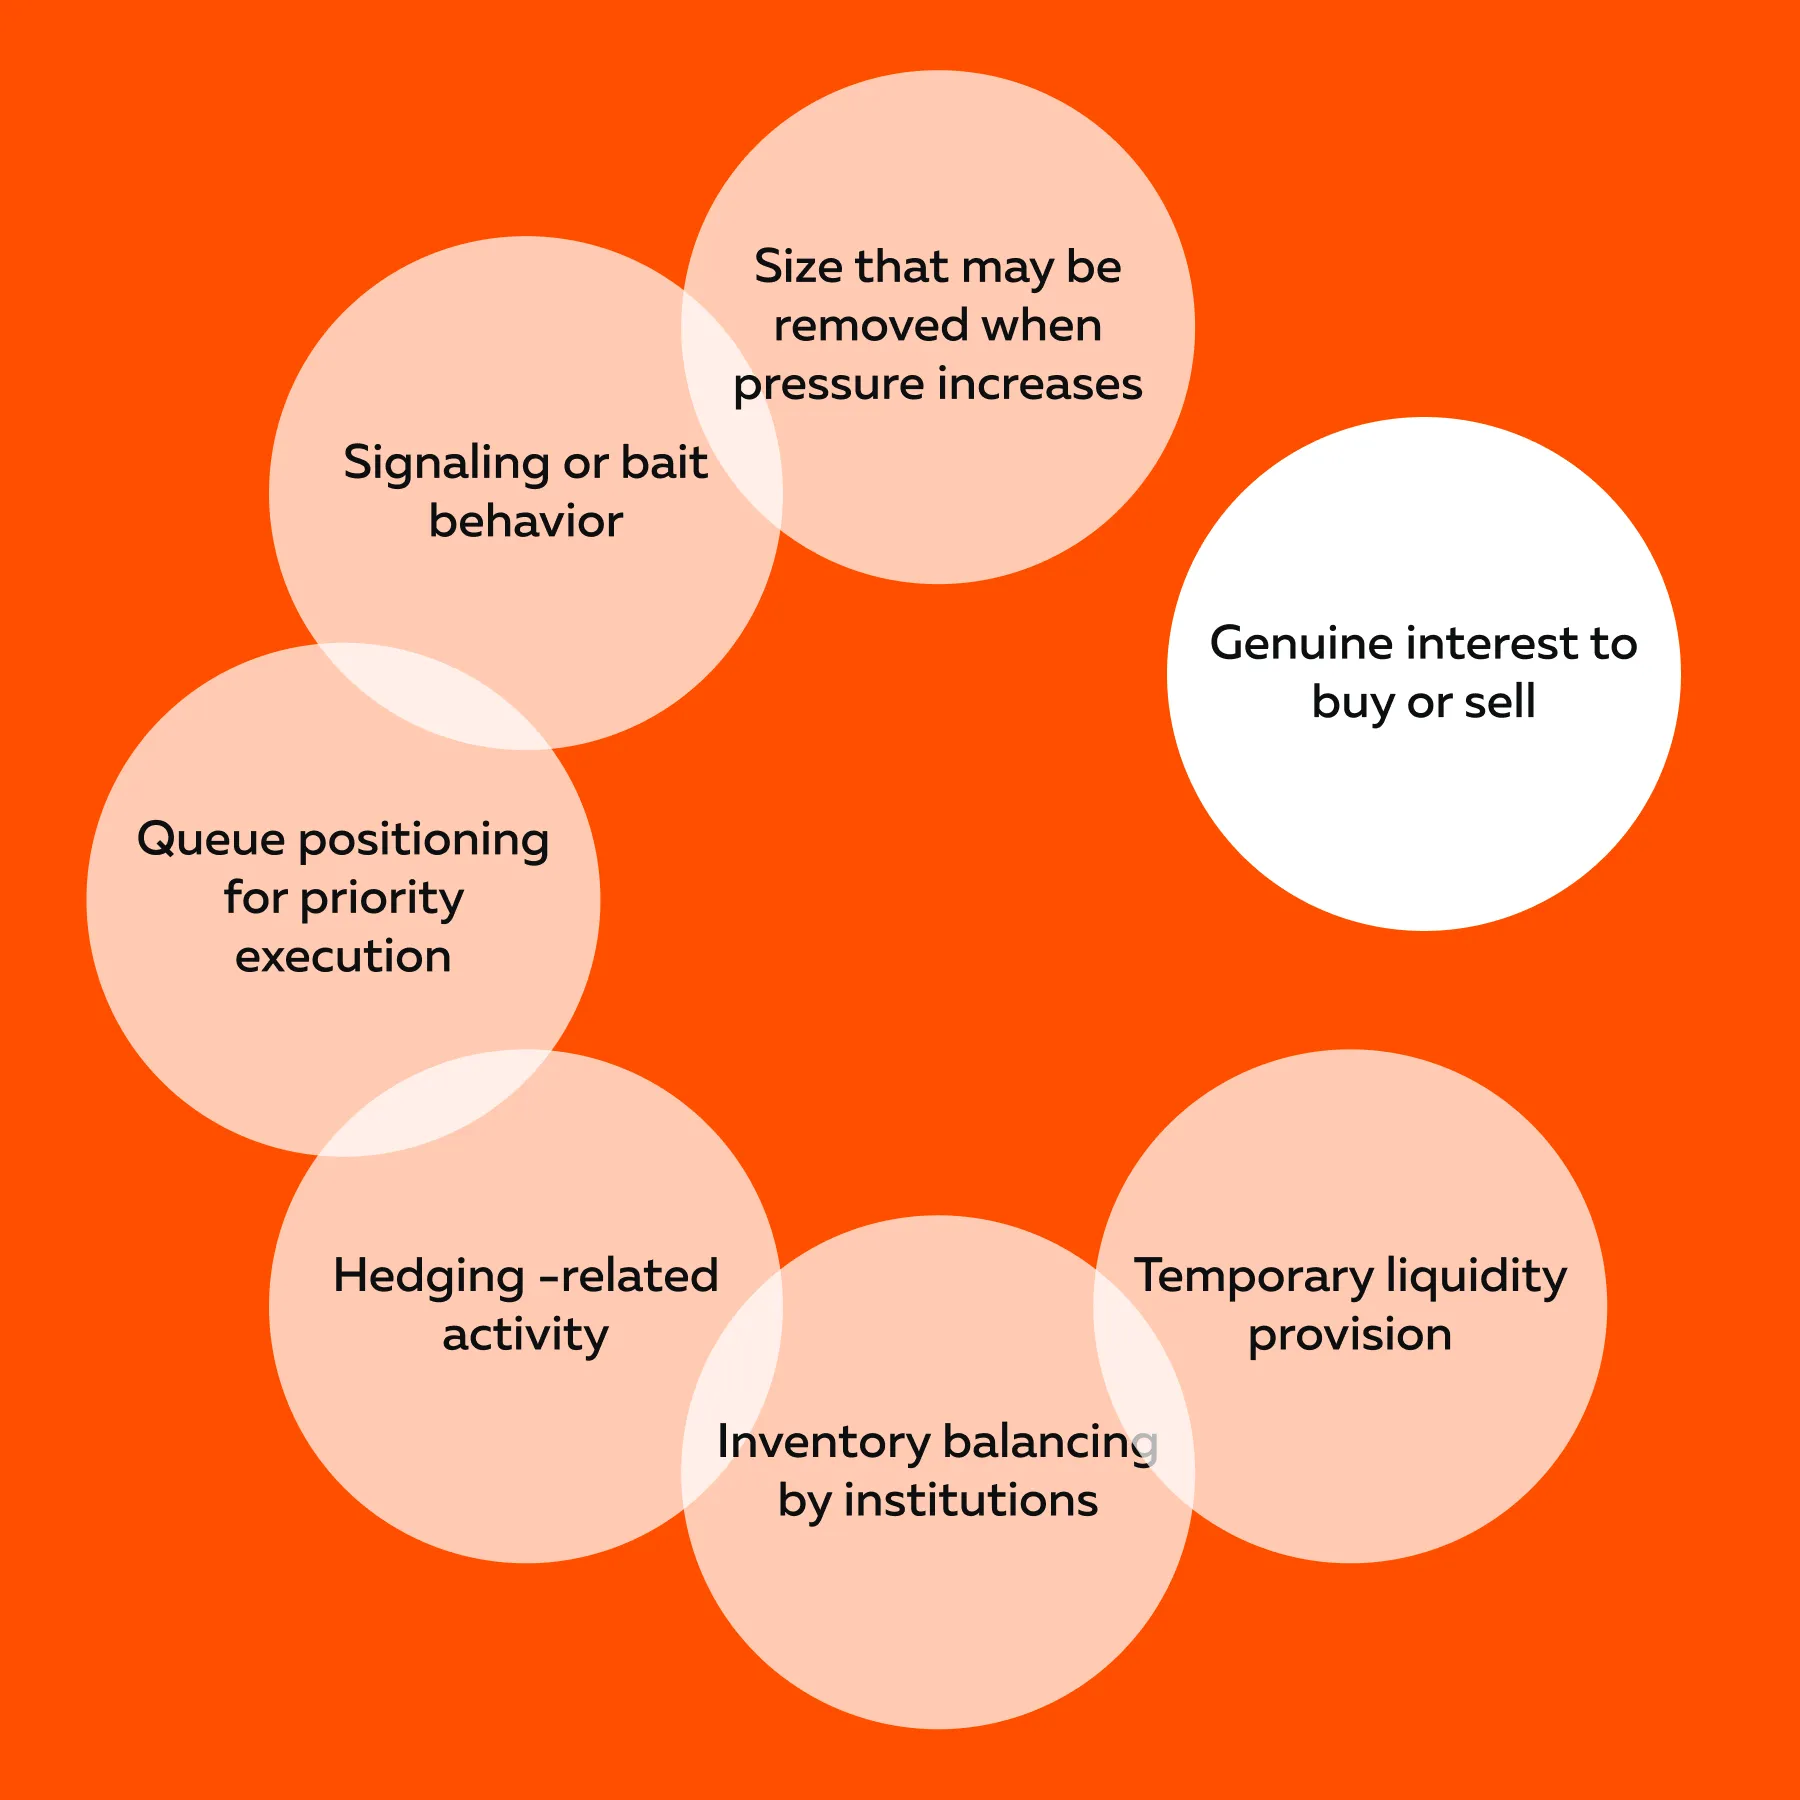
At the same time, traders must note that the size on the ladder provides information, but it remains ambiguous without context. Thus, DOM signals fail in many real-world scenarios.
For example,
- Suppose the price approaches a level with 2,000 contracts on the ask.
- This level is interpreted as “strong resistance”.
- Assume that selling pressure is initiated based on visible size.
- Meanwhile:
- Buyers begin lifting the ask aggressively, and
- The level shows brief replenishment.
- Eventually, the level trades through.
- Price moves higher, triggering a squeeze.
In this sequence, the visible size did not represent a firm barrier. Instead, it acted as temporary liquidity that was absorbed. This pattern shows one of the most common ladder-trading errors: “visible size is mistaken for confirmed intent.” Understand what order book signals actually mean in real time → Compare Packages
Why the DOM Is a Snapshot, Not a Story
The Depth of Market updates continuously, but it only shows the current state of visible orders. As a result, it behaves like a snapshot rather than a complete narrative of market activity. At any moment, the DOM may show:
- Size appearing or disappearing,
- Temporary imbalances between bids and offers, and
- Sudden stacking of orders at specific levels.
Since these changes occur rapidly, traders mostly react to isolated moments instead of sustained behavior. This is how DOM signals are misread. However, a single snapshot does not explain how the market reached that state. The following points outline the missing context:
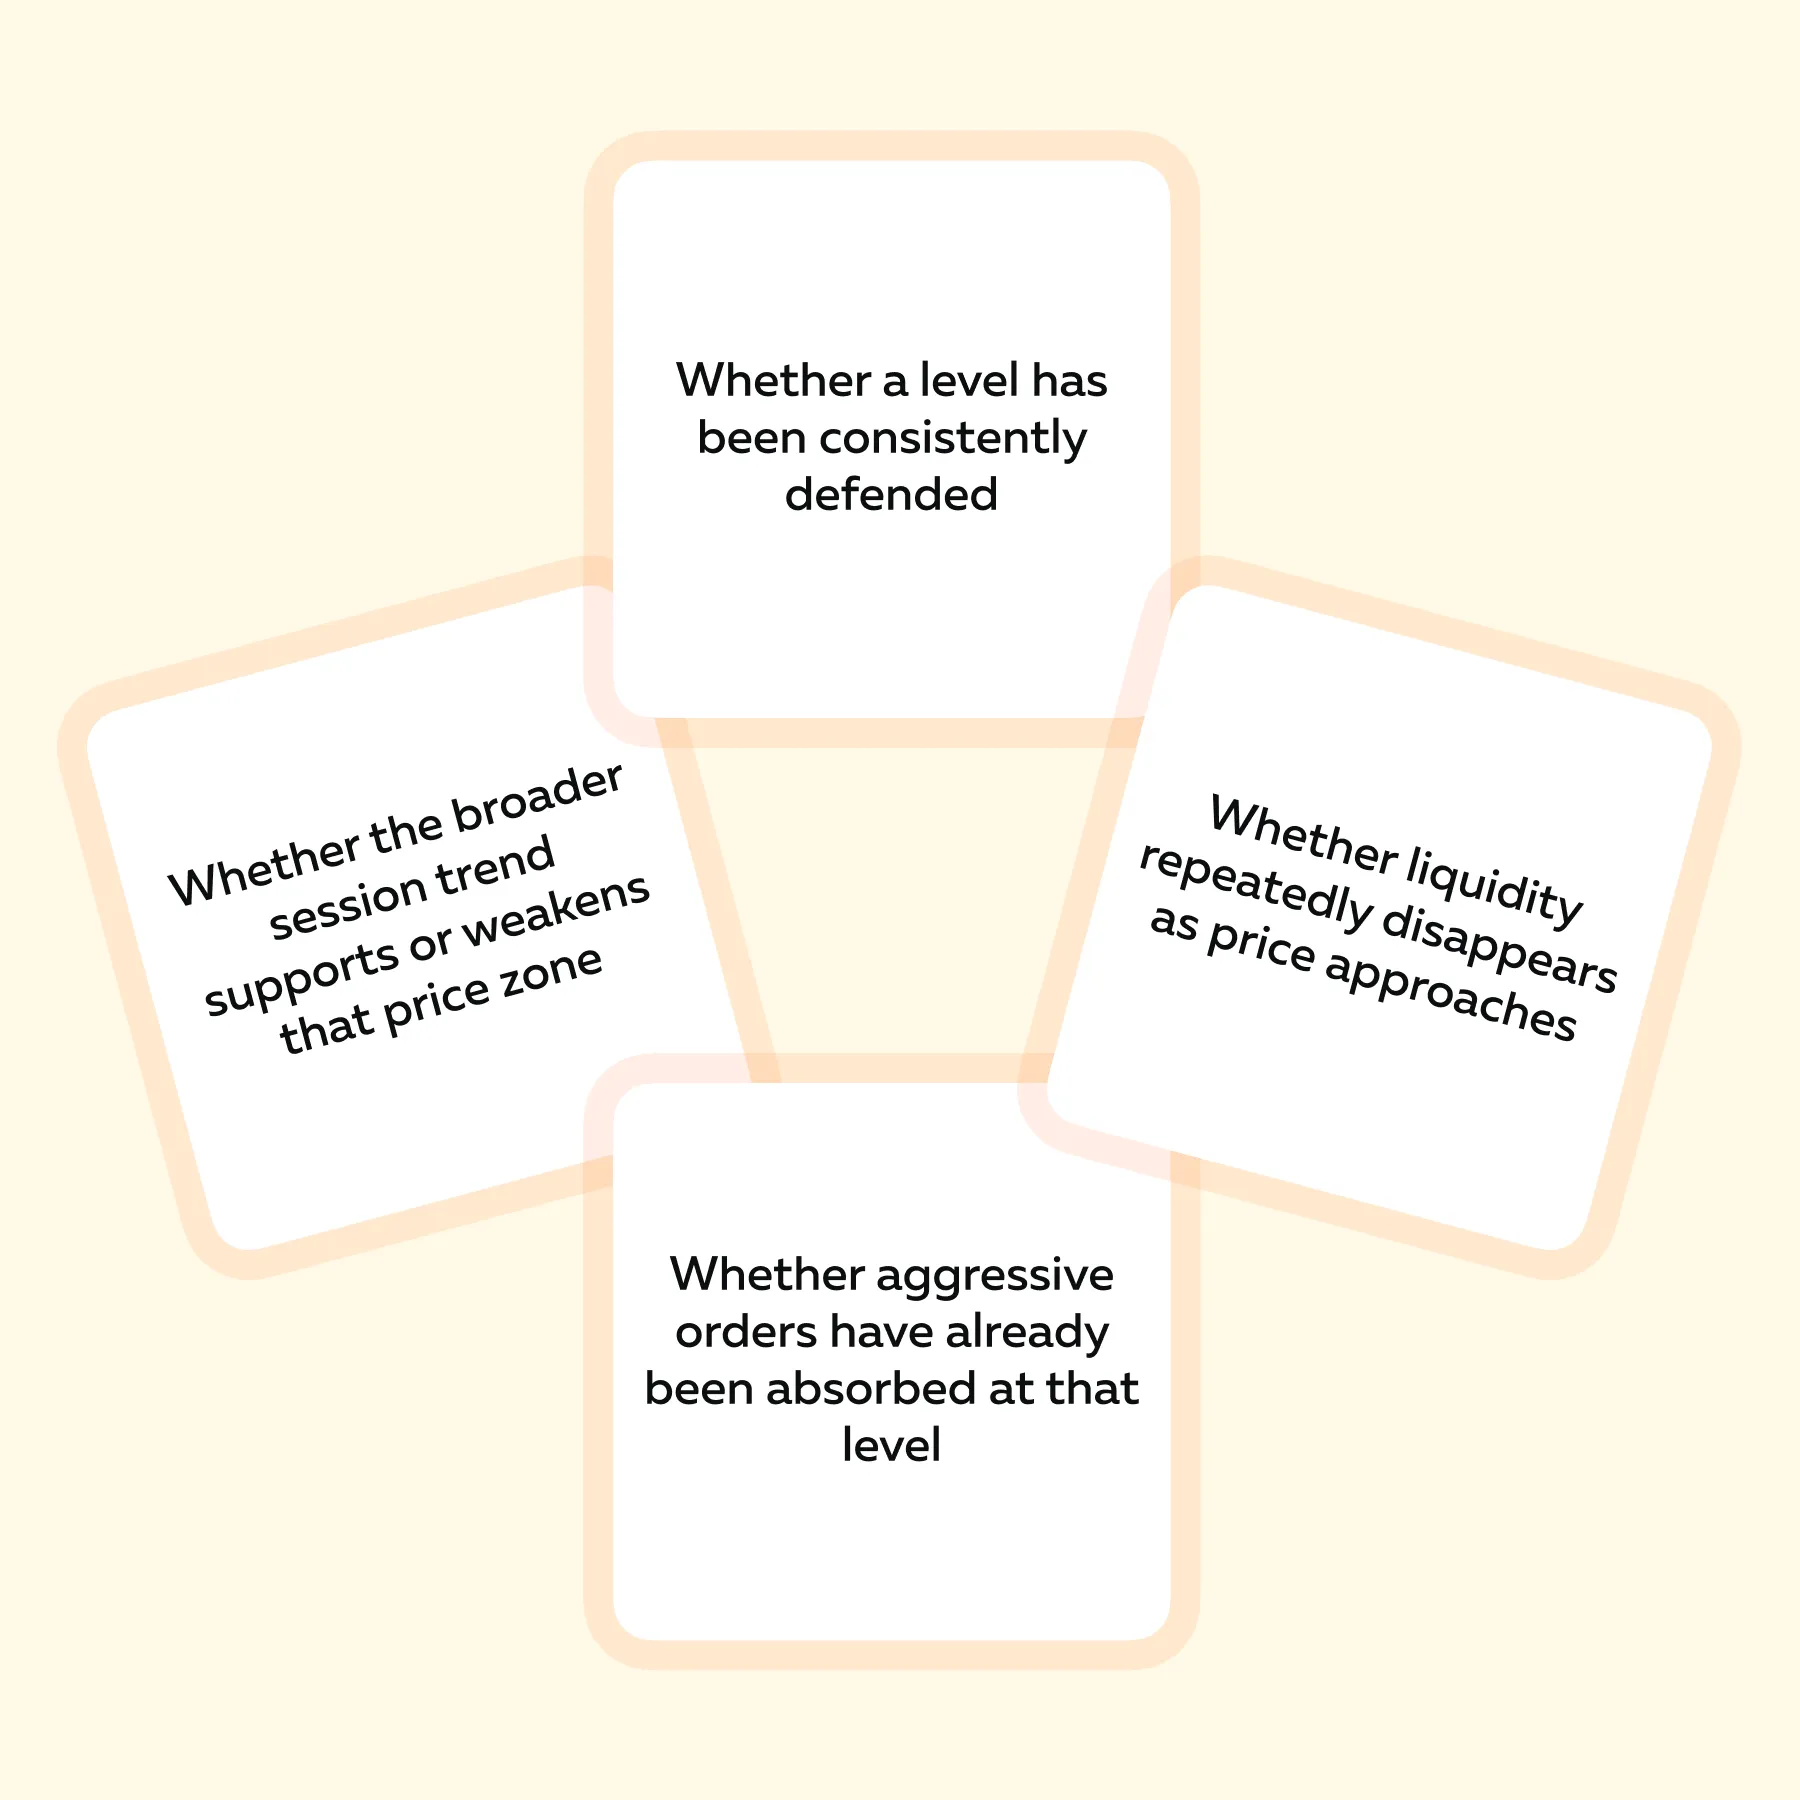
Therefore, snapshots only create “noise”, while behavior observed over time is considered a better market read. For more clarity, the table below outlines the two main types of market reads and their interpretation:
| Type of Read | Interpretation |
| Weak | “There are large bids visible right now.” |
| Stronger | “Bids have defended this level multiple times. They have absorbed selling, and even remained stable during pullbacks.” |
The second observation carries context, which improves interpretation in order book signals trading. Read market behavior instead of reacting to flashing numbers → Compare Packages
Why Traders Misread Pulling and Stacking
Another source of level 2 trading mistakes comes from oversimplifying pulling and stacking behavior. These actions are usually assigned fixed meanings, although market intent is more complex.
Some common assumptions include:
- Bids pulling = bearish
- Bids stacking = bullish
- Asks pulling = bullish
- Asks stacking = bearish
While these interpretations may hold in certain cases, they remain incomplete without context. The following breakdown provides further detail:
Why Bids Pull
Bids may be removed for several reasons, each reflecting different market conditions, such as:
- Price is likely to move lower,
- Liquidity providers aim to avoid unfavorable fills,
- Volatility has increased,
- A related market has moved downward,
- Internal risk adjustments have been triggered.
Therefore, pulling bids does not always confirm bearish intent. Instead, it may reflect caution or repositioning.
Why Bids Stack
Similarly, bids may increase at a level for different reasons, such as:
- Genuine buying interest is present,
- Participants seek better queue priority,
- Temporary signaling or spoofing occurs,
- Hedging activity creates passive demand.
As a result, stacked bids do not automatically confirm strong support. Price behavior carries more weight than what the ladder shows.
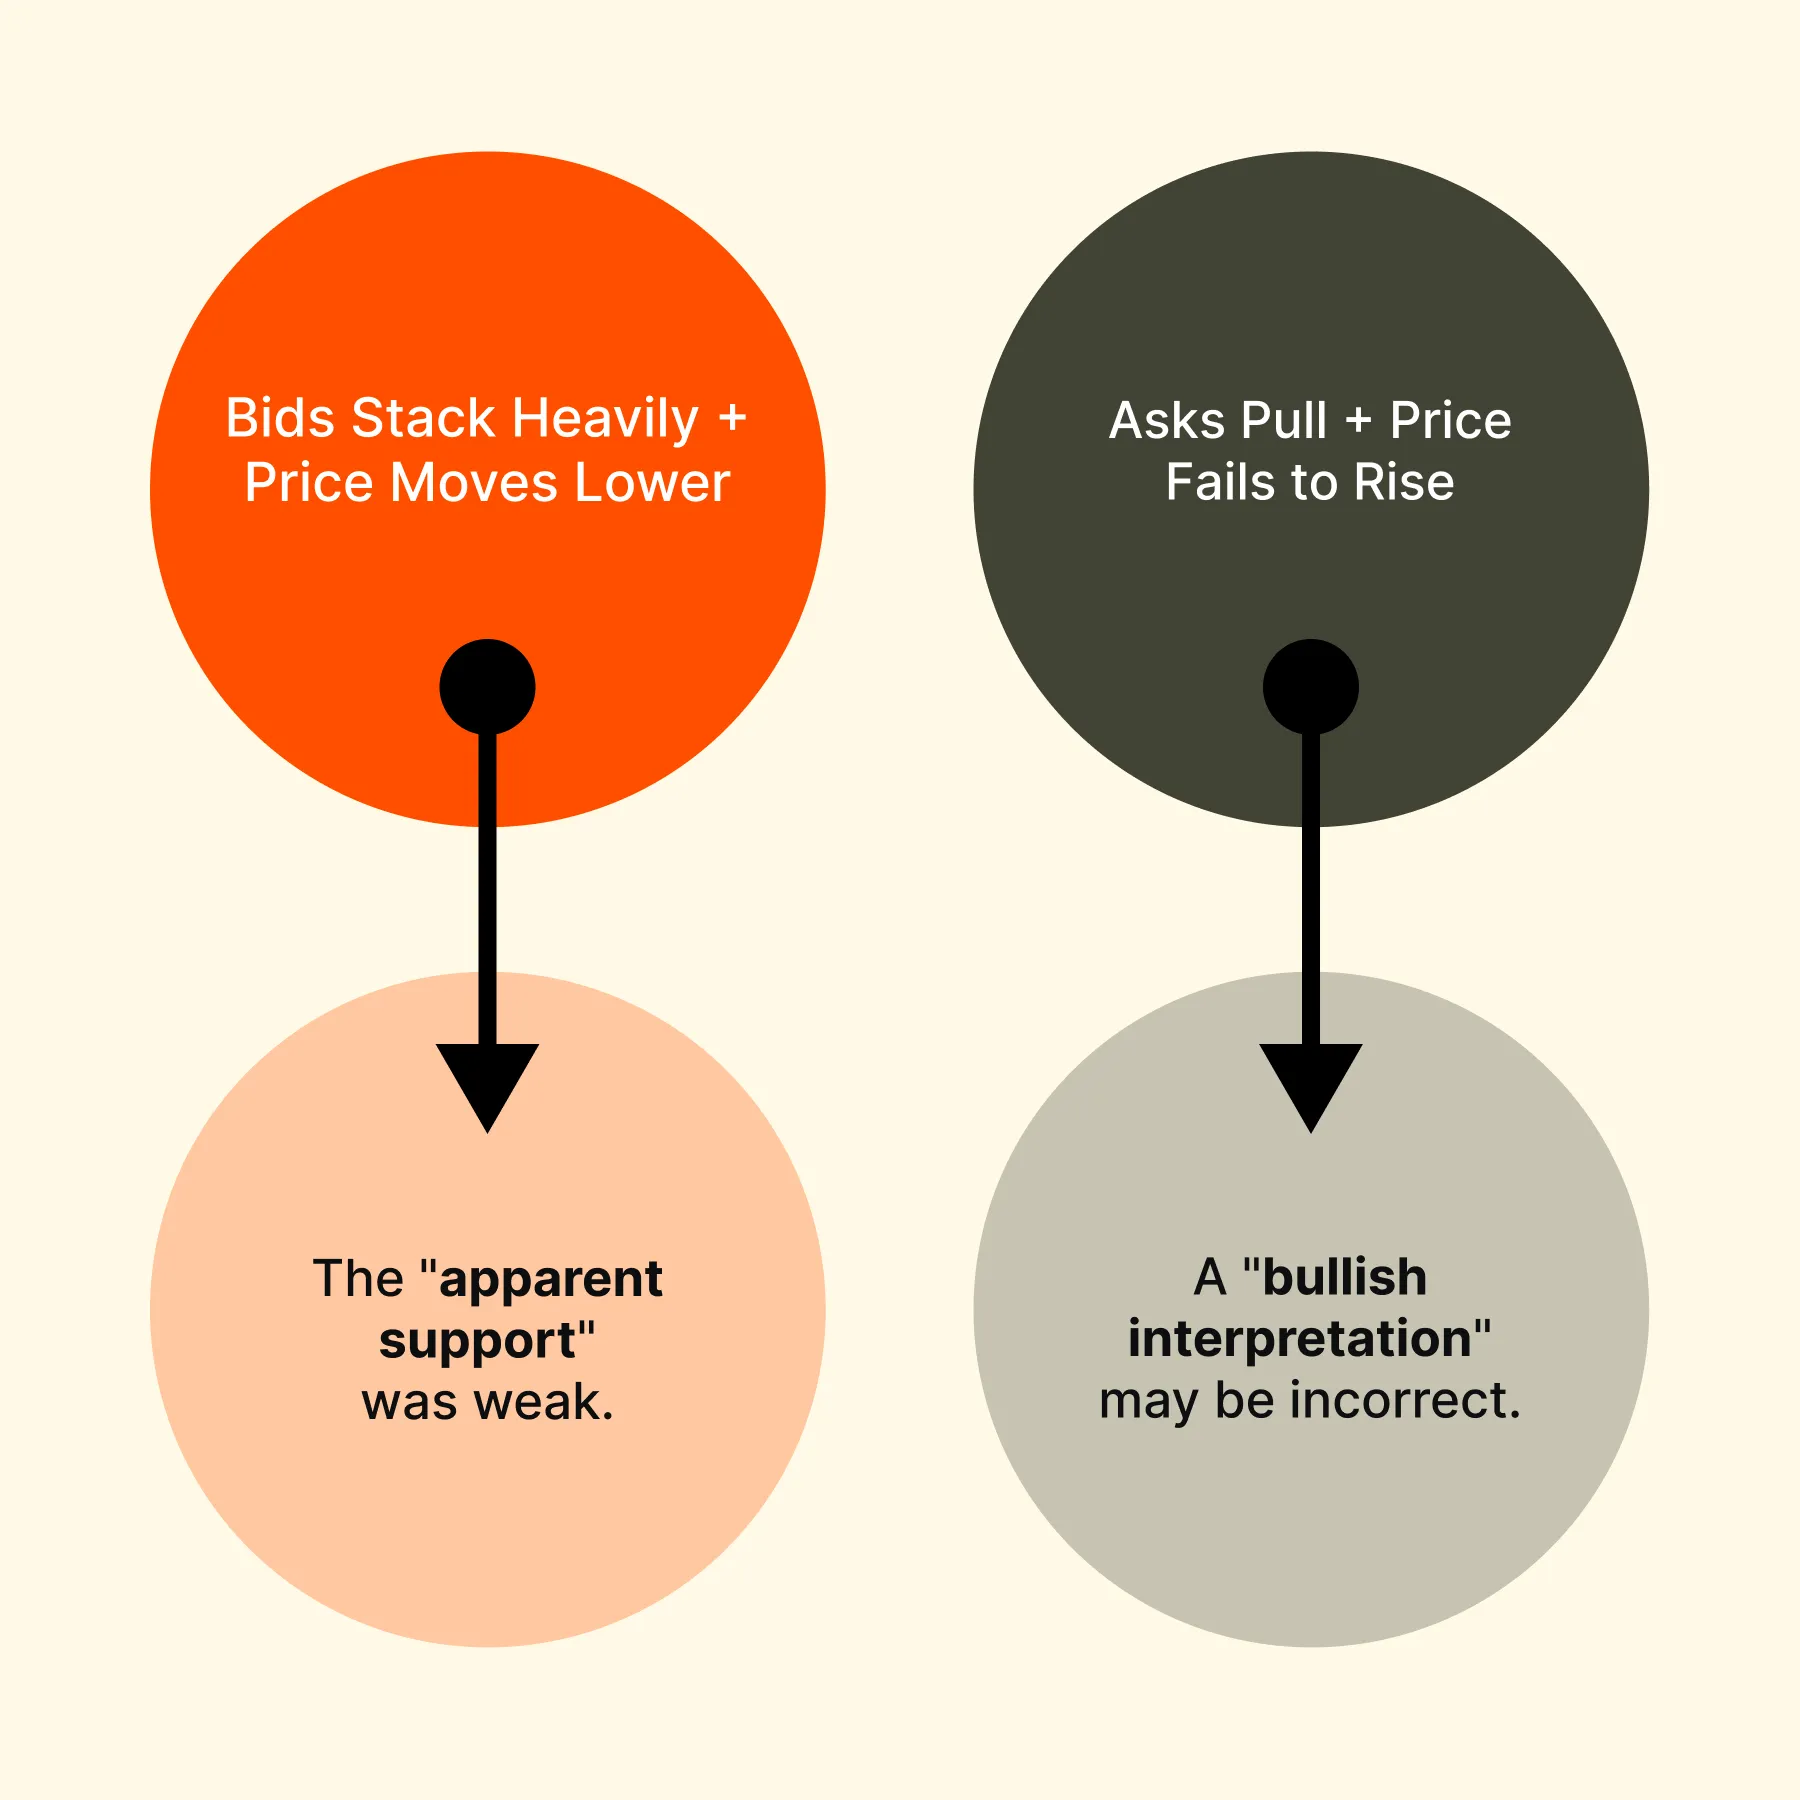
Note that this relationship between displayed liquidity and actual price movement is important in avoiding ladder trading errors.
Aggression Often Matters More Than Displayed Size
The Depth of Market shows resting limit orders, which represent passive liquidity. However, price movement is driven by aggressive orders that actively transact against this liquidity.
As a result, relying only on displayed size can lead to incomplete conclusions. Many level 2 trading mistakes occur when:
- Passive orders are treated as the primary signal, while
- Aggressive flow is overlooked.
In general, market orders reveal “true intent” because they show participants willing to trade immediately. When aggressive buyers or sellers enter in size, they can overwhelm visible liquidity and change the price direction.
Understand the claim made above better through an illustration:
- Assume that the DOM shows heavy offers above the price, suggesting resistance.
- This observation creates a “bearish impression” based on static size.
- However, aggressive buyers begin lifting the offers.
- Each level trades through with continued buying.
- Consequently, offers adjust higher instead of holding.
- Also, the price moves upward despite the initial setup.
In this sequence, market participants may observe that the passive picture appears bearish, yet the active flow remains bullish. This contrast explains why DOM signals fail when interpreted without transaction flow.
Therefore, order book signals become more accurate only when displayed liquidity is read alongside executed trades. Understand what order book signals actually mean in real time → Compare Plans.
Why Product Choice Changes Everything
DOM behavior varies significantly across instruments. A signal observed in one product may not carry the same meaning in another. This variation leads to many ladder-trading errors, as most traders transfer assumptions without adjusting for market structure. Here are some notable differences across products:
| Product I: S&P 500 Futures (ES) | Product II: Nasdaq Futures (NQ) | Product III: Crude Oil (CL) |
|
|
|
Due to such variations across products, the depth of the market in one product does not directly translate to another. Each instrument reflects its own:
- Liquidity profile,
- Participant behavior, and
- Response to order flow.
Therefore, misread DOM signals arise when product-specific behavior is ignored. The potentially “correct” approach could be to observe how each market reacts to both displayed size and aggressive execution within its own structure. See beyond static DOM snapshots with full liquidity context → Compare Packages.
The Biggest Psychological Mistake: Seeing What You Want to See
The DOM can reflect bias instead of reality when pre-existing expectations influence interpretation. Consequently, “selective attention” develops, in which traders may ignore contradictory signals, leading to a “confirmation bias”.
For more clarity, here’s an example:
- Assume a short bias is formed before reading the DOM.
- A large ask size appears, confirming that view.
- In response, a short position is initiated.
- Meanwhile:
- Buyers continue lifting offers, and
- Bids remain stable during pullbacks.
- Consequently, price shows a limited downside response.
In this situation, the DOM does not provide a “flawed signal”. Instead, the interpretation becomes selective. Consequently, what appears to be a clear read turns into one of the more common level 2 trading mistakes, in which the order book reflects expectations rather than actual market behavior.
What the DOM Is Actually Great For
The Depth of Market is most effective for “short-term execution” rather than for broad market prediction. It reflects immediate order flow conditions, which makes it useful for timing decisions around key levels.
When applied correctly, the DOM may help observe the following:
- Precise entries near important price zones,
- Short-term absorption, where aggressive orders meet strong passive liquidity,
- Whether liquidity is holding firm or being pulled away,
- Timing of executions during scalping conditions,
- Whether breakout pressure is building through repeated aggression, and
- Exit management when price moves become unstable.
Consequently, the depth of market promotes microstructure awareness and supports execution quality. See beyond static DOM snapshots with full liquidity context → Compare Plans.
Real Trade Example: DOM Pressure Confirmation vs Blind Ladder Reading
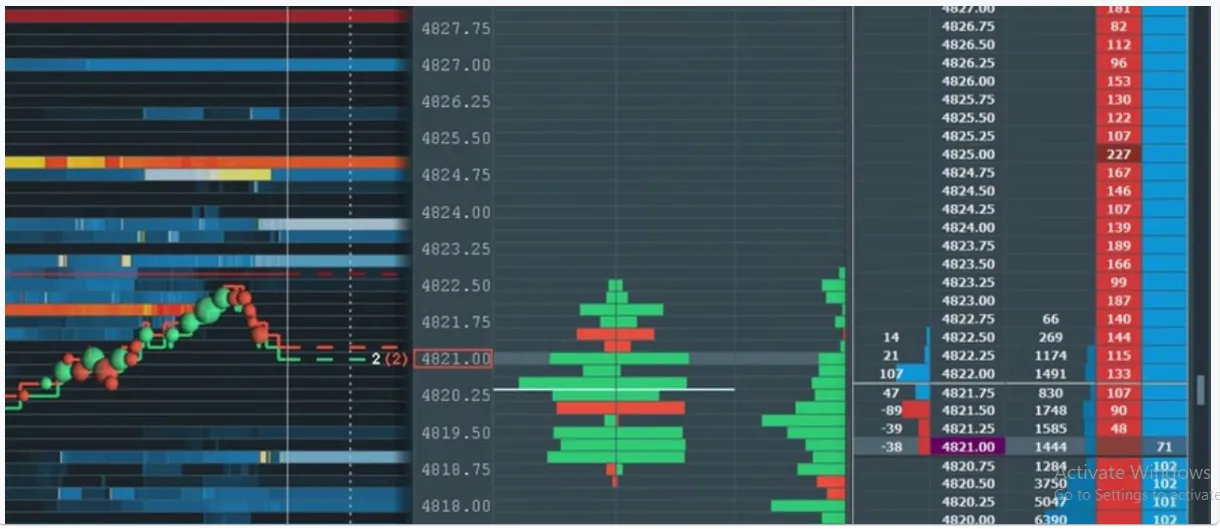
The above Bookmap Example relates to the use of DOM, where multiple tools are combined rather than relying solely on the ladder. This approach reduces common level 2 trading mistakes. Firstly, understand what the above chart shows:
| On the Left | In the Center | On the Right |
|
|
|
Additionally, trade bubbles indicate executed market orders: green shows aggressive buying and red indicates aggressive selling.
What Can Be Observed from the Above Bookmap Example?
Price initially moves higher as green trade bubbles increase, indicating aggressive buying. As the price approaches a visible liquidity zone, selling pressure appears as red bubbles increase. Consequently, the move slows down in this area, suggesting absorption.
Next, despite visible liquidity, the price does not reverse sharply, which indicates buyers are still active. Shortly after, the price stabilizes rather than collapsing, indicating that selling pressure was not strong enough to take control. Explore more real trade breakdowns here: https://bookmap.com/insights
Why Visual Liquidity Tools Often Help More Than Raw Numbers
The Depth of Market presents data in “numeric form”, which can become difficult to process during active market conditions. As a result, raw ladders usually increase cognitive load and lead to slower or inconsistent interpretation.
In contrast, visual tools such as heatmaps or transaction charts convert the same data into patterns. This makes it easier to observe how liquidity behaves over time rather than at a single point in time.
Visual representation makes market behavior clearer in the following manner:
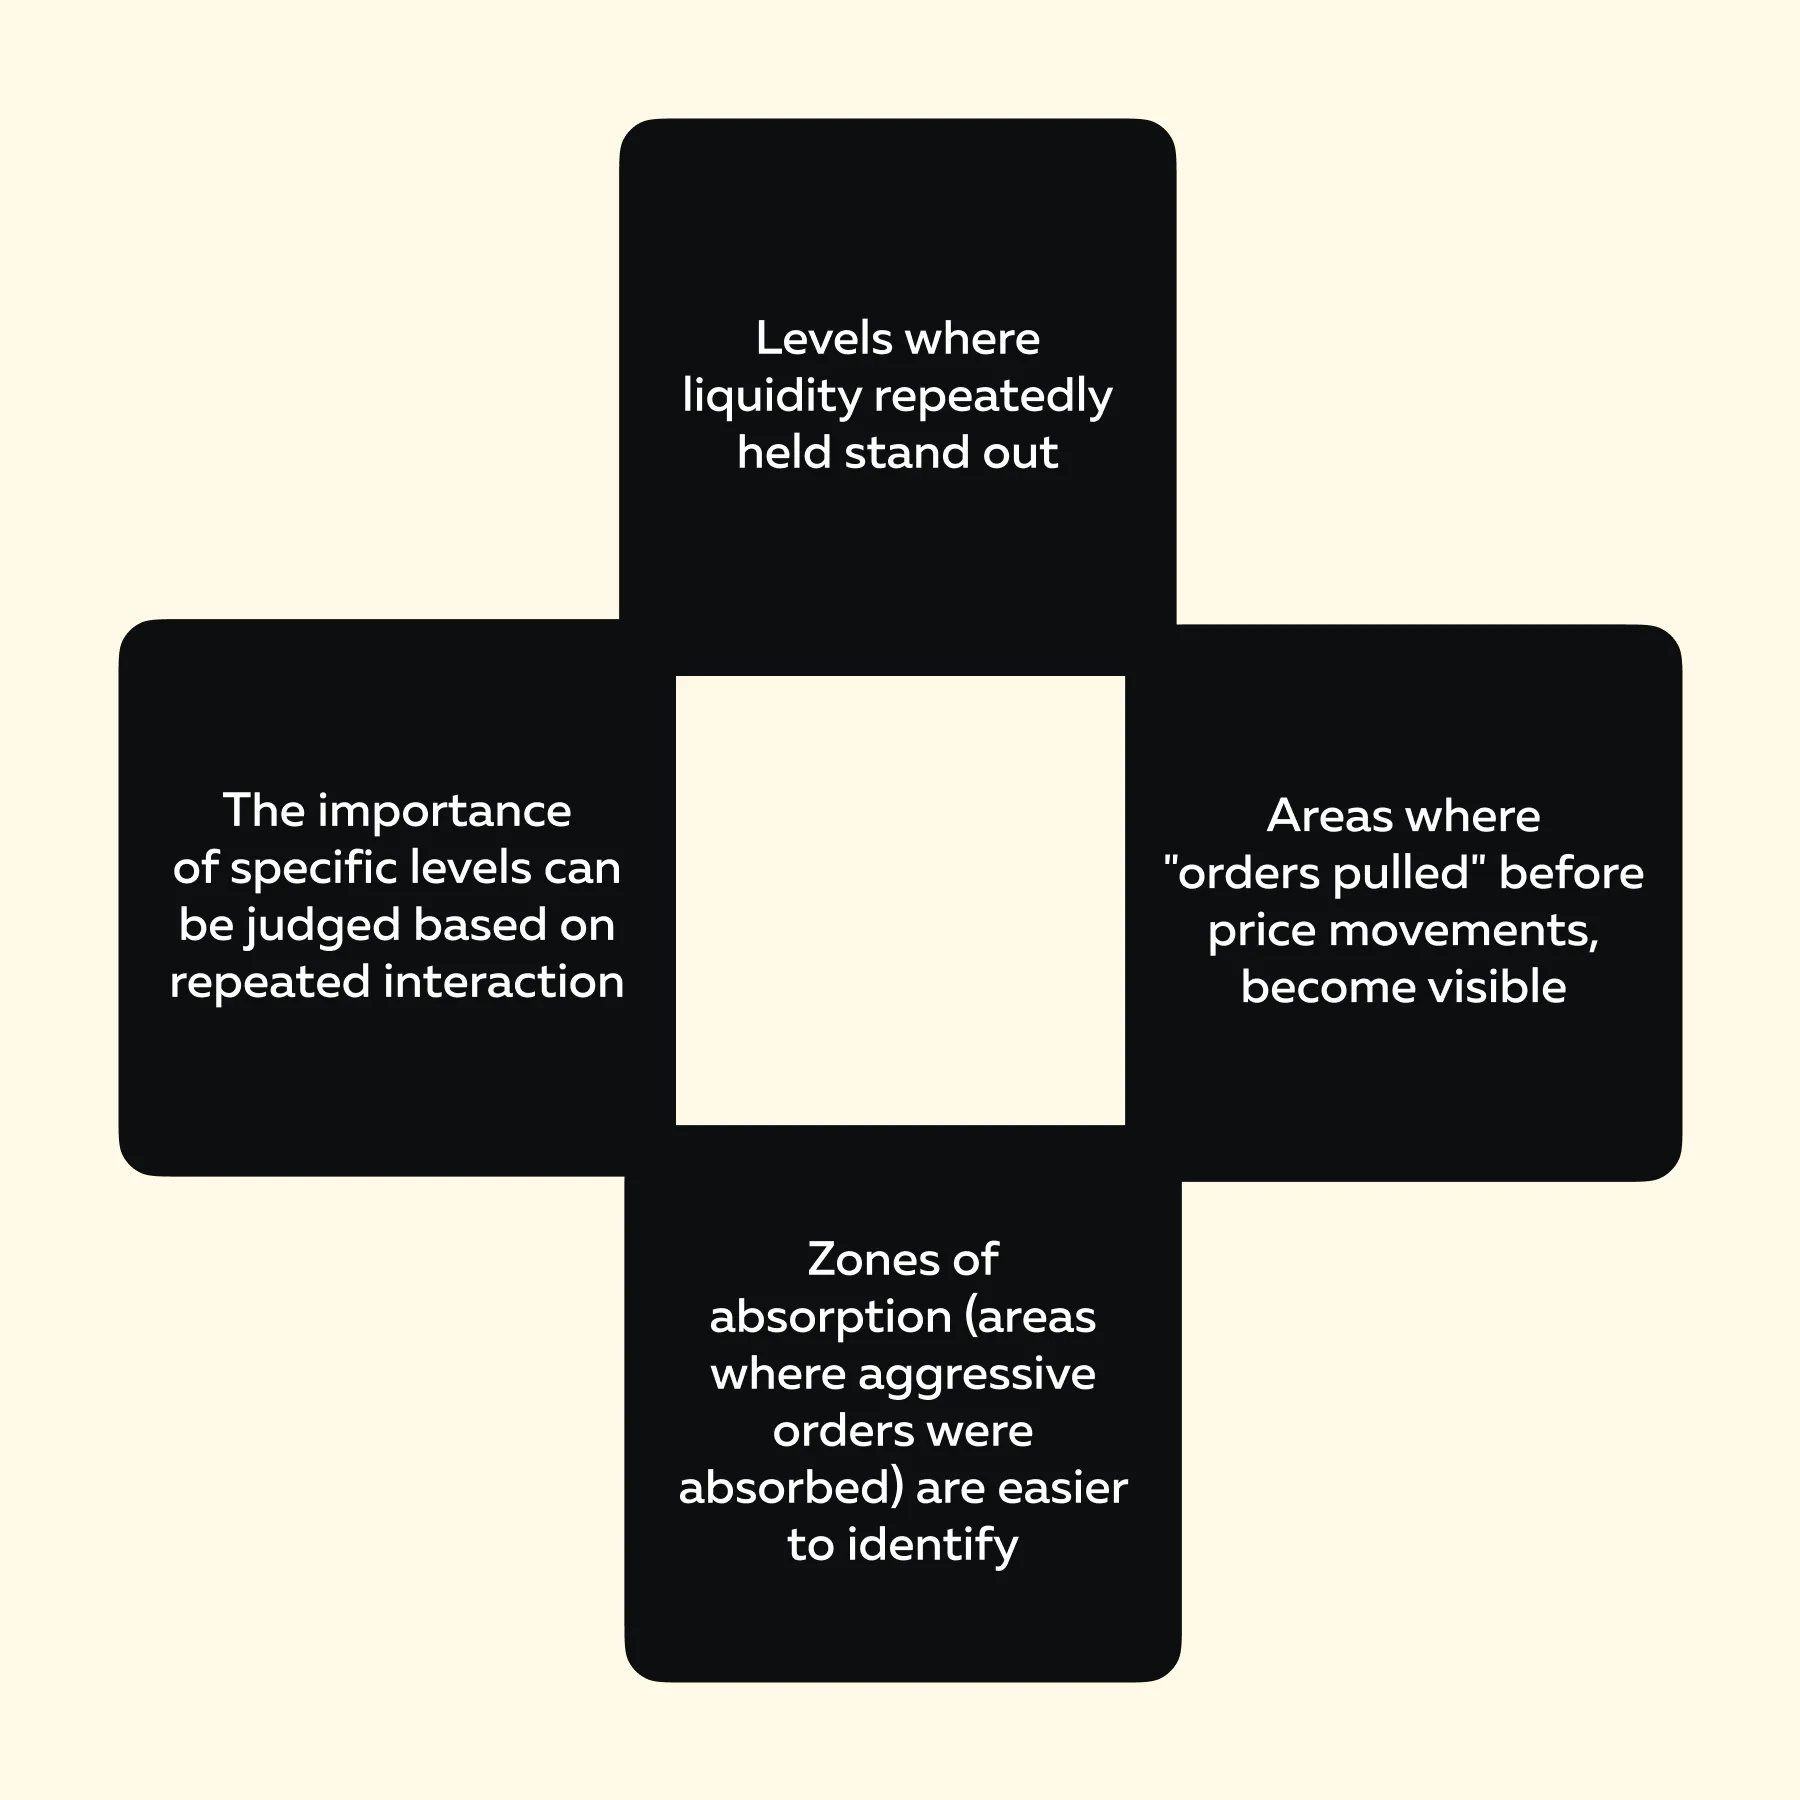
Therefore, many traders combine visual tools with the DOM rather than relying solely on numbers. This approach reduces misread DOM signals, and order-book signals become easier to interpret. Read market behavior instead of reacting to flashing numbers → Compare Packages.
Conclusion
Market participants often misread DOM signals because the ladder is treated as a source of certainty, whereas it provides only partial information. The Depth of Market reflects visible liquidity near the price, but it does not confirm future direction. That’s because:
- Large size may appear strong yet fail under pressure,
- Pulled liquidity may return when conditions change,
- Passive orders can be absorbed when aggressive buyers or sellers take control.
Therefore, the depth of the market points to behavior rather than static numbers. For this reason, market outcomes depend on how the price reacts to liquidity, not just where that liquidity sits. A better approach could be to observe the context, maintain trading discipline, and respond to the prevailing market conditions. Understand what order book signals actually mean in real time → Compare Packages.
FAQs
1. Why do DOM signals fail so often?
DOM signals fail because the Depth of Market only shows visible orders at a moment in time. These orders can disappear, change, or get absorbed by strong buying or selling. Consequently, what appears to be support or resistance may not hold, which is a common reason for misreading DOM signals and confusion in order-book signals trading.
2. Is the DOM still useful for trading?
Yes, the DOM remains useful, but mainly for short-term decisions. It may help with timing entries and exits, and observing how the price reacts near key levels.
However, it works best for execution rather than prediction. Most traders use DOM to perform a micro-level analysis instead of long-term direction.
3. What matters more: DOM size or market orders?
In isolation, neither may work better! DOM size shows passive interest, while market orders show active intent. The real insight comes from how they interact. If aggressive buyers or sellers overpower visible size, the price will move. This interaction explains why DOM signals fail when only one side of the equation is considered.
4. Should beginners rely only on the DOM?
For beginners, relying solely on the DOM may provide limited context and lead to level 2 trading mistakes. To achieve better results, novice traders can combine their analysis with:
- price structure,
- trend context, and
- executed trades.
This broader view reduces errors and improves how to read DOM trading in real conditions.
Sign Up Now
Latest Articles