See market more clearly in real time.
Compare plans to access deeper market visibility for market.
Education
March 11, 2026
Updated
SHARE
Depth of Market (DOM): From Basics to Evolution
Table of Contents
- The Basics of Depth of Market (DOM)
- The Evolution of DOM
- Why Traders Rely on DOM
- Advantages of Visual DOM over Traditional Formats
- Top-Rated DOM Trading Platforms for 2026
- Modern Market Microstructure and Liquidity Visualization Techniques
- A Beginner’s Guide to Understanding Market Depth and Price Discovery
- Practical Platform Considerations
- FAQ
What sets successful traders and investors apart from others in the market?
Can you, too, profit from financial markets? What are some must-have skills
to succeed?
To execute profitable stock market trades, you must develop the ability to
make rapid decisions and gauge market sentiments.
To acquire this skill, you must have a thorough understanding of market
supply and demand. This is where the concept of Depth of Market (DOM), also
known as the order book, comes into play.
Through this article, we will first understand the basics and then gradually
unravel the core components that make up DOM. We will also emphasize its
dynamic nature, where every new order, cancellation, or trade has a direct
impact on the order book. Let’s begin.
Top-Rated DOM Trading Platforms for 2026
In 2026, traders looking for a DOM platform are usually comparing more than just chart layout. They are evaluating how clearly a platform displays the order book, how stable it remains during fast markets, and whether it helps them interpret liquidity rather than just watch price move.
The strongest DOM platforms generally combine:
- real-time Level 2 or deeper market data
- a responsive order book interface
- visual tools for liquidity and execution behavior
- broker or execution connectivity where needed
For many active traders, the question is no longer whether to use a DOM, but whether the platform provides enough visibility into actual order book behavior to justify its cost.
Highest-rated order book visualization tools
Highly rated order book visualization tools help traders move beyond static bid/ask ladders and see how liquidity behaves through time. Instead of only showing where orders are now, stronger platforms help traders interpret where size is holding, where it is pulling, and where hidden participation may be influencing price.
The most useful tools tend to include:
- dynamic DOM ladders
- heatmap-style liquidity views
- historical replay
- volume and imbalance context
- faster visual updates during periods of heavy activity
These features are especially useful when the trader’s edge depends on timing entries and exits around visible liquidity.
Best software for viewing real-time Level 2 market data
For traders using real-time Level 2 data, the key difference between platforms is not simply whether they show bids and offers, but how clearly they present that information under pressure. A good platform should make it easy to monitor:
- changing bid and ask quantities
- spread behavior
- sudden liquidity withdrawal
- aggressive participation near key levels
Platforms that present Level 2 data in a clear, responsive format can make a major difference for scalpers and intraday traders who rely on immediate order book context.
Leading depth of market execution interfaces for professional traders
Professional traders often need execution interfaces that are tightly connected to the DOM itself. This includes one-click execution, fast order modification, and the ability to manage entries and exits directly from the ladder.
For traders evaluating a professional DOM interface, execution speed matters, but so does clarity of the ladder, visibility into liquidity shifts, and the ability to interact with the order book efficiently. Bookmap offers exactly this → learn more here.
The Basics of Depth of Market (DOM)
To grasp the essentials of the Depth of Market, let’s start by defining it
and dissecting its key components.
What is DOM?
Depth of Market (DOM), often referred to as the order book, is a real-time
representation of the supply and demand for a particular financial
instrument. It provides information about current market conditions,
including the prices at which people are willing to buy and sell an asset.
What are the Components of DOM?
There are three basic components of DOM:
|
Parameters |
Bid Price |
Ask Price |
Price Levels |
|
Meaning |
Bids are the prices at which potential buyers are |
Asks, also known as offers or sell orders, are the |
The price levels represent the range of prices at which |
|
Order of Listing |
These prices are listed in descending order, with the |
These prices are listed in ascending order, with the |
Traders can see a series of prices and corresponding |
|
Representation |
The bid quantity represents the total number of units or |
The ask quantity represents the total number of units or |
Price levels help them understand the current market |
What are the Buy Sides and Sell Sides of DOM?
-
The buy side of the DOM:
-
Represents the demand side of the market.
-
Shows the willingness of buyers to acquire the asset at various
price levels.
-
-
The sell side of the DOM:
-
Represents the supply side of the market.
-
Shows the offers from sellers to sell their assets at different
price levels.
-
How Dynamic Is DOM?
The DOM is highly dynamic and changes constantly due to:
-
New orders
-
Order cancellations, and
-
Trade executions
When traders place new buy and sell orders, these orders are added to their
respective sides of the DOM. When orders are filled or canceled, they are
removed from the DOM. Most traders often use this dynamic nature of DOM to
make several decisions, such as:
-
Choosing the best price at which to execute a trade or
-
Identifying potential support and resistance levels.
The Evolution of DOM
Traditionally, Depth of Market (DOM) originated as text-based order books.
These order books were essentially physical or manual records of buy and
sell orders that traders and brokers would maintain. Traders would
physically write down orders on paper or record them in ledger books.
This text-based system allowed market participants to see the current bid
and ask prices and the corresponding order quantities. However, it was a
slow and manual process, susceptible to human error.
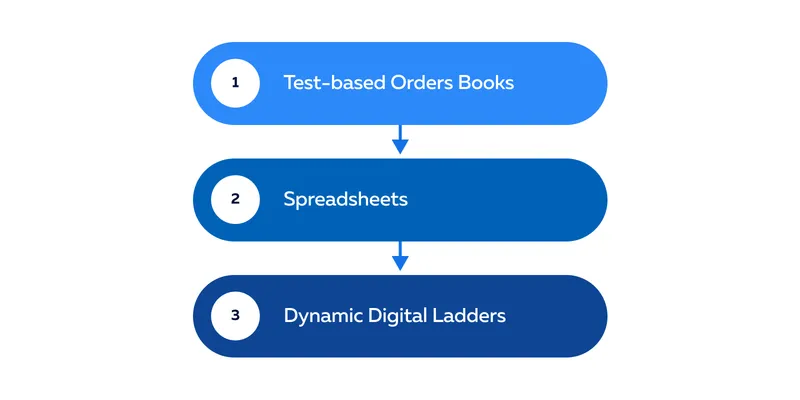
How The Transition Happened to Spreadsheets
In the late 20th century, text-based order books evolved and transitioned to
spreadsheets. This change allowed for more efficient record-keeping and
calculations. Traders and brokers could now use computer software to manage
order books in a digital format. This shift greatly improved order entry and
record-keeping accuracy.
How Spreadsheets Evolved into Dynamic Digital Ladders
The adoption of electronic trading platforms in the late 20th and early 21st
centuries revolutionized trading. These platforms digitized the entire
trading process, from order placement to execution. As a result, order books
transitioned from being physically maintained to being displayed in
real-time on computer screens.
Apart from the development of electronic trading platforms, several other
major events supported this transition. These are:
-
Many traders started
High-Frequency Trading
(HFT). This led to a demand for faster and more responsive order
book displays. -
Sophisticated market data feeds started evolving allowing traders to
access up-to-the-second information from various financial markets.
These feeds were instrumental in the development of dynamic digital
ladders. -
Over time, algorithmic trading became more prevalent. Now, traders
require advanced order book visualization tools to implement
automated trading strategies.
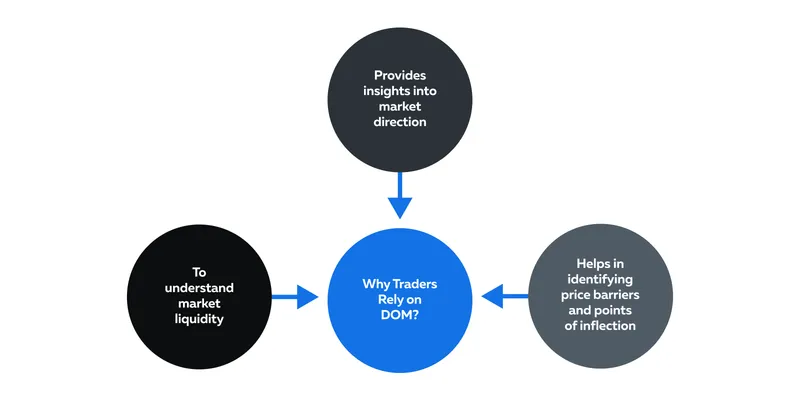
Why Traders Rely on DOM
Traders rely on the Depth of Market for a range of reasons, including:
-
To Understand Market Liquidity: The Depth of Market (DOM) allows
traders to gain valuable insights into market liquidity in the
following ways:-
Bid and Ask Quantities:
-
It allows traders to examine the quantities of bids and asks
at various price levels. -
If there are many buyers (high bid quantities) and sellers
(high ask quantities) at a particular price level, it
indicates a liquid market. -
Conversely, low quantities may suggest lower liquidity.
-
-
Spread Analysis:
-
The difference between the highest bid and the lowest ask
(the spread) is a measure of liquidity. -
Narrow spreads typically indicate a liquid market, while
wide spreads suggest lower liquidity.
-
-
-
Provides Insights into Market Direction: The DOM also helps traders
gain insights into the current market direction by letting them to:-
Visualize Market Orders:
-
The order flow in the DOM reflects the real-time actions of
market participants. -
An increase in buy orders (bids) often indicates a bullish
sentiment. -
Conversely, a surge in sell orders (asks) suggests a bearish
sentiment.
-
-
Understand Aggressiveness of Orders:
-
The sequence and aggressiveness of orders in the DOM can
provide clues about market direction. -
For example, a large market order suddenly appearing on the
buy side may indicate strong buying interest and a potential
upward move.
-
-
-
Helps in Identifying Price Barriers and Points of Inflection: The
DOM helps traders identify potential price barriers and points of
inflection in the market via:-
Support and Resistance Levels:
-
Most traders look at the DOM to identify significant support
and resistance levels. -
A support level is where there is a concentration of buy
orders, indicating a potential price floor. -
Conversely, a resistance level is where there is a cluster
of sell orders, suggesting a potential price ceiling.
-
-
Order Imbalance:
-
When there is a significant imbalance between buy and sell
orders at a particular price level, it can act as a point of
inflection. -
For example, if there are far more buy orders than sell
orders at a specific price, it could signal a potential
price rally.
-
-
Iceberg Orders:
-
Some traders use
hidden or iceberg orders
, which are not fully displayed in the DOM. -
Recognizing the presence of such orders helps in identifying
potential points of inflection.
-
-
A Beginner’s Guide to Understanding Market Depth and Price Discovery
For beginners, the core value of market depth is simple: it shows where participants are currently willing to trade. Price discovery happens when buyers and sellers interact through those visible and hidden orders.
A beginner should think of DOM as a live map of market interest:
- bids suggest where buyers may defend
- asks suggest where sellers may resist
- changes in those levels can signal shifts in sentiment
The DOM does not predict price on its own. What it does is provide context for how the next move may develop.
Essential software tools for high-frequency day trading
Not every trader needs high-frequency infrastructure, but active day traders usually benefit from:
- a responsive DOM
- real-time data feed stability
- visual order book tools
- replay or review capability
- broker integration where execution speed matters
These tools help reduce friction between market observation and trade execution.
Lowest-latency DOM platforms optimized for E-mini S&P 500 futures
For E-mini S&P 500 futures traders, latency matters most when trading around fast-moving events, volatile opens, and short-term liquidity shifts. The lowest-latency DOM platforms are typically those that pair stable infrastructure with efficient data handling and a ladder interface that does not lag when the book updates quickly.
Rather than focusing only on advertised speed, traders should also assess whether the platform remains readable and usable when activity spikes.
Visual order book analysis software for Mac with M3 chip support
An increasing number of traders are using modern Mac systems and want to know whether advanced market visualization tools can run effectively on Apple Silicon hardware. For these users, the main concerns are:
- stability
- rendering performance
- responsiveness during active sessions
- compatibility with data feeds and broker connections
The broader point is that platform choice now also includes operating environment, not just feature set.
Modern Market Microstructure and Liquidity Visualization Techniques
Modern DOM analysis sits inside a broader market microstructure framework. Traders are no longer just looking at static bids and offers. They are trying to understand how liquidity appears, disappears, and interacts with aggressive orders in real time.
Current liquidity visualization techniques often include:
- heatmaps that show liquidity concentration through time
- DOM ladders that update rapidly as size changes
- replay tools for reviewing market behavior after the fact
- order flow overlays that help interpret pressure and absorption
This matters because market depth is no longer just a list of prices. It is a moving system shaped by order placement, cancellation, and execution.
Most reliable platforms for monitoring the limit order book (LOB)
Reliable limit order book monitoring requires more than a simple ladder. Traders need tools that help them see whether displayed liquidity is firm, fleeting, or partially hidden.
Platforms that help traders recognize hidden liquidity and iceberg-style behavior provide a more realistic picture of the market than standard quoted depth alone.
Benefits of order flow analysis for individual trading performance
For individual traders, order flow analysis can improve performance in a few very practical ways:
- better timing around support and resistance
- fewer trades based on false breakouts
- clearer identification of absorption or exhaustion
- improved understanding of whether buyers or sellers are actually in control
Rather than replacing strategy, order flow analysis often improves decision quality inside an existing strategy.
Comprehensive reviews of electronic trading platforms for institutional use
Institutional-grade platforms are usually evaluated on a different standard than retail tools. Reviews at that level tend to focus on:
- data stability under heavy load
- order routing efficiency
- depth and granularity of market data
- execution workflow
- integration with proprietary systems
Even if a trader is not institutional, these standards are still useful when evaluating whether a DOM platform is built for real market conditions.
Advantages of Visual DOM over Traditional Formats
The visual representation of the Depth of Market offers traders a more
intuitive and efficient way to analyze market data. It allows for the rapid
identification of anomalies and trends, enabling quick decision-making and
action. Let’s understand this further.
Intuitive Analysis
Visual representations are more intuitive and require less cognitive effort
to understand. Instead of deciphering rows of numbers and text, traders can
quickly grasp the market situation by looking at visual graphs, charts, and
order book ladders.
This helps traders to make informed decisions faster as they can instantly
identify:
-
Key price levels,
-
Trends, and
-
Imbalances in the order book.
Additionally, a visual DOM also provides a comprehensive overview of the
market. Using it, traders can see the current state of the order book and
its historical changes.
Spotting Anomalies and Detecting Trends
In fast-moving markets, visual DOMs help traders quickly spot discrepancies
between:
-
Bid and ask quantities or
-
Sudden changes in order flow.
This can act as a signal for potential market-moving events, such as large
trades or shifts in sentiment. When anomalies or trends are detected
visually, traders can respond promptly.
For instance, if traders notice a sudden surge in buy orders, they may
choose to enter a long position to capitalize on the upward momentum.
Develop Tailored Trading Strategies
Visual DOM reveals current market conditions. This helps traders
create and adapt strategies
. For example, traders implement a:
-
Scalping strategy when they see tight bid-ask spreads or
-
Trend-following strategy when they detect a clear directional bias
in the order book.
Thus, by utilizing the most up-to-date information, visual DOM equips
traders to respond to the current state of market. Using the latest
information, traders can develop tailored strategies that can be highly
profitable, especially in volatile or rapidly changing markets.
Practical platform considerations
Choosing a DOM platform in 2026 usually comes down to five practical questions:
- how much does the full setup cost each month?
- how reliable is the data feed during active sessions?
- is the platform built for speed or for slower analytical review?
- does it support the specific market being traded?
- can it connect directly to the trader’s broker or preferred workflow?
These questions matter just as much as visual features.
Total monthly cost for Level 2 data subscriptions for retail scalpers
For retail scalpers, total monthly cost usually includes:
- platform license or subscription
- exchange data fees
- Level 2 or full-depth data access
- optional add-ons or advanced visual tools
This is why traders should evaluate the total stack, not just the platform fee by itself. A low software cost can still become expensive if the required data bundle is large.
Latency benchmarks for the best depth of market software available
Latency benchmarks are difficult to compare in a universal way because performance depends on:
- data source
- connection quality
- broker routing
- the local machine
- the platform’s data handling efficiency
Still, the practical benchmark for a trader is whether the DOM remains visually coherent and functionally responsive during rapid market updates.
Best online courses for learning to read order flow on a DOM
Many traders can access DOM tools but still struggle to interpret them. That is why education remains important. The most useful DOM education generally focuses on:
- how bids and asks shift in real time
- what absorption looks like
- how to distinguish genuine depth from weak liquidity
- how order flow changes around key levels
The strongest courses usually combine explanation, replay, and live examples rather than theory alone.
Proprietary trading firm requirements for DOM execution tools in 2026
Some proprietary firms now expect traders to be comfortable using DOM-based execution tools, particularly in futures markets. In 2026, common expectations may include:
- fast ladder navigation
- efficient order entry and cancellation
- understanding of spread and queue positioning
- comfort with liquidity-based decision-making
This does not mean every trader must use a DOM, but it does show how central these tools have become in professional futures trading.
Top-rated mobile apps for real-time market depth and heatmap visualization
Mobile apps are helpful for monitoring, but they rarely replace a full desktop DOM workflow. Traders using mobile tools are usually looking for:
- market depth snapshots
- alerts
- quote tracking
- high-level heatmap or liquidity views
They can be useful for staying connected, but serious DOM interpretation and execution are still typically handled on desktop platforms.
Conclusion
Depth of Market (DOM) provides critical insights into market dynamics,
liquidity, and price movements. This valuable understanding allows traders
to make informed decisions and execute well-thought-out strategies.
The visual representation of DOM offers a range of advantages over
traditional text-based formats. It promotes intuitive analysis by providing
a quick and comprehensive view of the market, reducing the cognitive effort
required to interpret data, and facilitating faster decision-making.
Additionally, it aids traders in identifying anomalies and trends with
greater precision. Thus, traders are encouraged to use visual DOM while they
are trading to stay ahead of the competition and ultimately achieve success
in the dynamic world of digital trading.
Are you ready to transform your trading approach with unparalleled DOM
visualization? Dive deeper with Bookmap’s
DOM Pro add-on
and elevate your market insights.
FAQ
Are you looking for live quotes or simply trading hours information?
Futures markets trade nearly 24 hours per day during the week. If you need live quotes, access to real-time futures data is required. If you are only researching trading hours, most major index futures follow the CME Globex schedule with brief daily pauses.
Which specific index or commodity are you tracking?
Different futures contracts influence different parts of the stock market. S&P 500 and Nasdaq-100 futures reflect broad equity sentiment, while crude oil, gold, and bond futures may influence sector-specific price movement.
Do you want to understand how futures predict the market open?
Futures reflect investor positioning before the stock market begins trading. When index futures rise or fall overnight, they often signal how equities may open, although actual stock performance depends on liquidity and new information at the opening bell.
Are you focused on Globex trading sessions or traditional pre-market equity hours?
Globex refers to the nearly 24-hour electronic futures trading session. Traditional pre-market equity hours apply to stocks trading before the regular exchange open. Understanding the distinction helps traders interpret where price signals originate.
Which asset class?
The type of heatmap you need depends on whether you trade stocks, futures, or crypto. A broad market treemap may be useful for sector-level analysis, while a market depth heatmap is more useful when trading a specific instrument and needing to see how liquidity behaves at exact price levels.
Looking for platform recommendations?
If you are comparing heatmap tools, the first step is deciding whether you need a market performance dashboard or an order book visualization platform. Traders focused on execution and liquidity behavior generally benefit more from a platform that shows real-time depth and trade interaction.
Need a tutorial?
If you want help getting started with Bookmap, use this guide:
https://bookmap.com/learning-center/en/getting-started/platform/downloading-and-installing-bookmap
This is the best place to begin if you want a practical walkthrough of installation, setup, and first use.
Are you trading stocks, futures, or crypto?
Order flow behavior varies by market:
Stocks → focus on liquidity shifts and hidden orders
Futures → emphasis on imbalances and absorption
Crypto → higher volatility and liquidity gaps
Is real-time speed a priority for you?
For many traders, speed and data accuracy are critical. Platforms that provide real-time data and low-latency updates offer a clearer view of market behavior:
https://bookmap.com/blog/stock-trading-tools-with-real-time-data-how-modern-traders-monitor-markets
Faster data allows traders to react to liquidity changes before they fully impact price.
Do you need API connectivity?
Some traders require direct integration with data feeds or execution systems, especially when building automated strategies or custom dashboards.
What is your experience level?
Your platform choice should reflect your experience:
New traders → prioritize clarity and ease of use
Experienced traders → prioritize depth, speed, and customization
Are you tracking US benchmarks or international markets like the FTSE or Nikkei?
U.S. futures provide the clearest signal for the American cash session, but international markets often shape sentiment first. FTSE, Nikkei, DAX, and other overseas benchmarks can influence U.S. futures before the opening bell.
Do you require real-time streaming quotes or a summary of analyst forecasts?
Real-time streaming quotes are best for traders actively monitoring overnight positioning. A summary of analyst forecasts is more useful for higher-level planning, but it may miss immediate changes in liquidity and sentiment.
Are you focusing on specific indices like the Russell 2000 or the S&P 500?
Different indices reflect different parts of the market. The S&P 500 is the broadest benchmark, Nasdaq is more tech-sensitive, Dow is more industrial and blue-chip oriented, and Russell 2000 is more tied to small caps and domestic risk appetite.
Are you looking for technical entry points or general market sentiment?
Some traders only want a directional read for tomorrow’s open. Others want specific technical levels for entries, exits, and risk management. Futures can support both, but the analysis should be tailored accordingly.
Do you need information on commodity futures like oil and gold as well?
Oil, gold, and Treasury futures often influence equity sector behavior and overall sentiment. Traders preparing for tomorrow’s open frequently monitor these alongside equity index futures.
Are you looking for academic research papers or industry news alerts for traders?
If you’re focused on theory and models, academic research can provide deep insight into liquidity behavior and price formation. If you’re trading actively, real-time news and market updates are often more practical for decision-making.
Do you want updates on traditional equity markets or decentralized finance (DeFi) microstructure?
Equity market microstructure is more standardized and regulated, while DeFi markets are still evolving with different liquidity dynamics. Your focus will determine which data and tools are most relevant.
Are you focusing on specific venues like the NYSE, CME, or Eurex?
Each venue has different matching rules, liquidity profiles, and participant behavior. Understanding the nuances of your primary trading venue can improve execution and strategy development.
Is your interest in high-frequency trading (HFT) regulations or general liquidity trends?
HFT regulation focuses on fairness, latency, and market stability, while broader liquidity trends help traders understand how markets behave across different conditions. Both perspectives are valuable depending on your strategy.
Would you prefer a summary of weekly institutional insights or real-time news feeds?
Weekly summaries provide structured context and longer-term perspective, while real-time feeds help you react to immediate market changes. Many traders use both to balance preparation and execution.
Are you looking for software specifically for equities, futures, or the crypto market?
DOM behavior differs by market. Futures traders often rely on centralized depth, equity traders may deal with fragmented liquidity, and crypto traders typically face more venue variation and wider shifts in displayed depth.
Do you require a platform with one-click execution or a standalone analytical tool?
Some traders want a DOM directly tied to execution, while others primarily want a visual analysis platform. The right choice depends on whether speed of order entry or depth of observation is more important.
Is your primary focus on high-speed scalping or long-term liquidity trend analysis?
High-speed scalpers typically need faster DOM interaction and highly responsive data. Traders studying liquidity over a longer intraday horizon may prioritize replay, clarity, and visualization over direct speed.
What is your preferred monthly budget for software licensing and data feeds?
Budget matters because DOM trading usually includes both platform cost and data cost. It helps to evaluate the full monthly setup before choosing software.
Do you need a platform that integrates directly with brokers like Interactive Brokers or Tradestation?
Broker integration is important if you want to place trades directly from the platform. Traders who use the DOM more as an analytical tool may have more flexibility in how they connect execution.
Sign Up Now