4th of July Sale
50% Off Bookmap Global+, Data & Add-Ons
Save on Global+, market data, and add-ons from July 3–13.
Education
April 1, 2024
Updated
SHARE
5 Tips on Market Cycles, Patterns, and Sentiment Analysis
Technical analysis boosts a trader’s ability to predict market movements. However, this predictive power cannot be fully utilized without a thorough understanding of market cycles and patterns.
We will begin this article with a discussion on market cycles and patterns to describe how markets move and how to spot potential opportunities. Then, we’ll dive into momentum indicators to give you insights into the strength of trends and potential turning points in the market.
Also, we’ll cover intermarket analysis and show you how different markets and assets can influence each other. Finally, we’ll discuss order flow and market sentiment to explain how to read the signs hidden in volume and price changes, so you can make better-informed trading decisions. Let’s begin.
Understanding Market Cycles and Patterns
Market cycles and patterns are essential components of technical analysis. Most traders and investors use them to understand the behavior of financial markets.
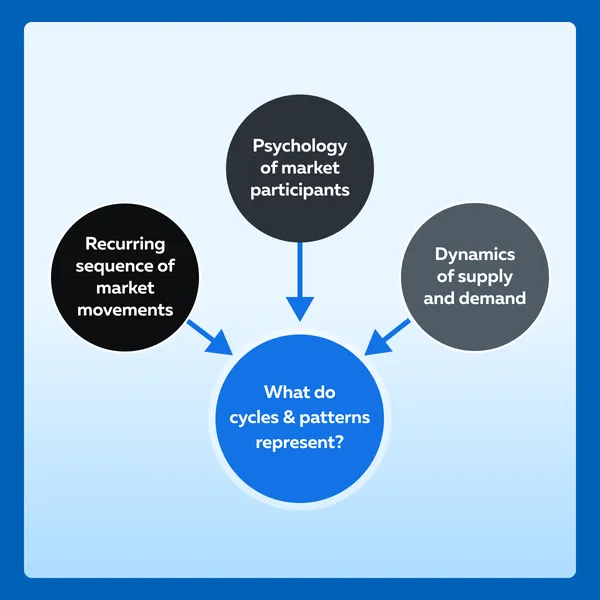
A thorough recognition and interpretation of these patterns allow traders to make more informed decisions about buying, selling, or holding assets.
Understanding Market Cycles
Understanding market cycles provides valuable insights into market dynamics and enhances trading decisions. These can be divided into four major segments, which are described in the given table:
| Expansion Phase (Bull Market) | Peak | Contraction Phase (Bear Market) | Trough |
|
|
|
|
Popular Market Cycle Analysis Strategies
To better their trading outcomes, traders follow several cycle analysis techniques, such as:
- Elliott Wave Theory
-
-
- Developed by Ralph Nelson Elliott, this theory proposes that market prices move in repetitive patterns or waves.
- These waves consist of:
- Impulsive waves (trending phases) and
- Corrective waves (counter-trend phases).
- By identifying these patterns, traders attempt to predict future price movements.
-
- Fibonacci Retracements
-
-
- Fibonacci retracements are based on the Fibonacci sequence and ratios (such as 0.382, 0.5, and 0.618).
- Traders use these retracement levels to identify potential support and resistance levels during market corrections.
- The idea is that market retracements often occur at these key Fibonacci levels.
-
- Gann Theory
-
- Developed by legendary trader W.D. Gann, this theory is based on:
- Geometric angles and
- Patterns derived from price and time analysis.
- Gann believed that specific geometric angles could predict future price movements and the timing of market reversals.
- Developed by legendary trader W.D. Gann, this theory is based on:
Real-world Examples of Market Cycles and Patterns
To gain a better understanding, read some real-world examples of market cycles and associated patterns:
Example 1: S&P 500 Bull and Bear Markets (2000 – 2020)
Market Cycle
- Expansion Phase (Bull Market): From 2003 to 2007, the S&P 500 experienced a prolonged bull market phase, fueled by economic growth and low interest rates.
- Peak: The peak occurred in October 2007, when the S&P 500 reached its all-time high before the onset of the global financial crisis.
- Contraction Phase (Bear Market): The bear market phase lasted from 2007 to early 2009. This period witnessed a sharp decline in stock prices due to the housing market collapse and financial system turmoil.
- Trough: The market trough occurred in March 2009, followed by a period of recovery and stabilization.
Pattern Significance
By recognizing the stages of the market cycle, traders could:
- Anticipate the transition from expansion to contraction and
- Adjust their trading strategies accordingly.
For example, traders could shift from bullish to defensive positions as signs of economic weakness emerged before the bear market.
Example 2: Bitcoin Market Cycles (2017 – 2020)
Market Cycle
- Expansion Phase (Bull Market): Bitcoin experienced a massive bull market from late 2016 to December 2017, with prices surging from around $1,000 to nearly $20,000.
- Peak: The peak occurred in December 2017 when Bitcoin reached its all-time high, followed by a sharp correction.
- Contraction Phase (Bear Market): The bear market phase lasted throughout 2018 and early 2019. This period witnessed significant price declines and a period of consolidation.
- Trough: The market trough occurred in December 2018, followed by a gradual recovery and the beginning of a new bull market phase.
Pattern Significance
Traders and investors could use technical analysis tools like Fibonacci retracements and trendlines to identify key support and resistance levels during Bitcoin’s market cycles. By recognizing these patterns, traders can identify entering or exiting positions based on price action and market sentiment.
Example 3: Gold Price Cycles (1970s – 2020s)
Market Cycle
- Expansion Phase (Bull Market): During the 1970s, gold experienced a prolonged bull market phase driven by inflation fears and geopolitical uncertainty.
- Peak: The peak occurred in January 1980 when gold reached a record high of over $800 per ounce.
- Contraction Phase (Bear Market): Gold entered a bear market phase from 1980 to the early 2000s. This period witnessed a prolonged period of declining prices and subdued investor interest.
- Trough: The market trough occurred around the early 2000s, followed by a gradual uptrend and the beginning of a new bull market phase.
Pattern Significance
Gold’s market cycles are influenced by a combination of macroeconomic factors, including:
- Inflation,
- Interest rates, and
- Currency movements.
Traders and investors often use gold as a hedge against economic uncertainty and inflation. Hence, it is essential to understand its cyclical nature and price behavior over time.
The Power of Momentum Indicators
Momentum indicators are widely used in technical analysis to:
- Measure the rate of change in price movements,
- Identify potential trend reversals or continuations, and
- Gauge the strength and direction of price momentum.
Let’s explore some popular momentum indicators in detail:
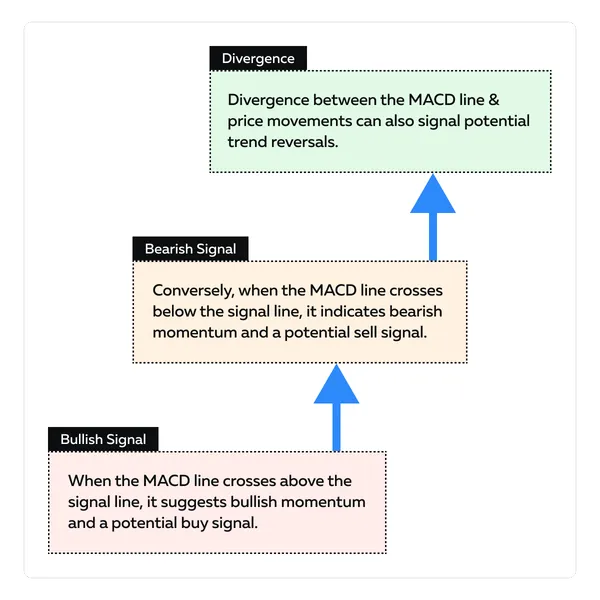
1. Moving Average Convergence Divergence (MACD):
Mechanics
MACD is calculated by subtracting the longer-term Exponential Moving Average (EMA) from the shorter-term EMA. Additionally, a signal line (often a 9-day EMA of the MACD) is plotted to identify potential buy or sell signals.
Interpretation
Pros and Cons
| Strengths | Weaknesses |
MACD is effective in:
|
It may produce false signals during ranging or choppy market conditions. |
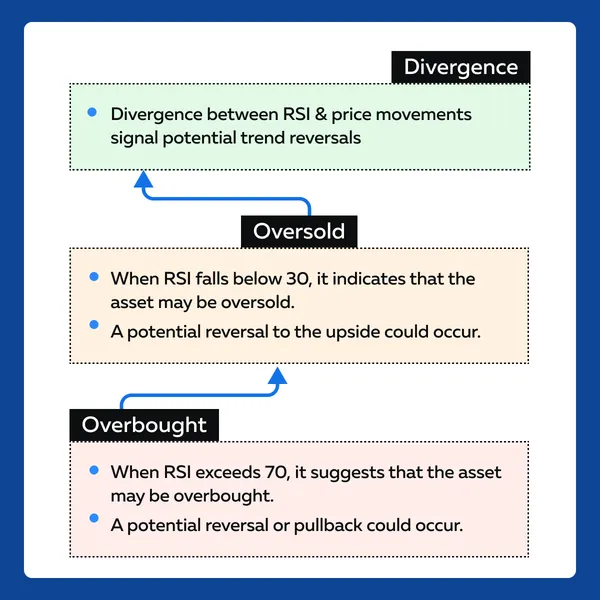
2. Relative Strength Index (RSI)
Mechanics
RSI measures the speed and change of price movements by comparing the magnitude of recent gains to recent losses over a specified period (usually 14 periods).
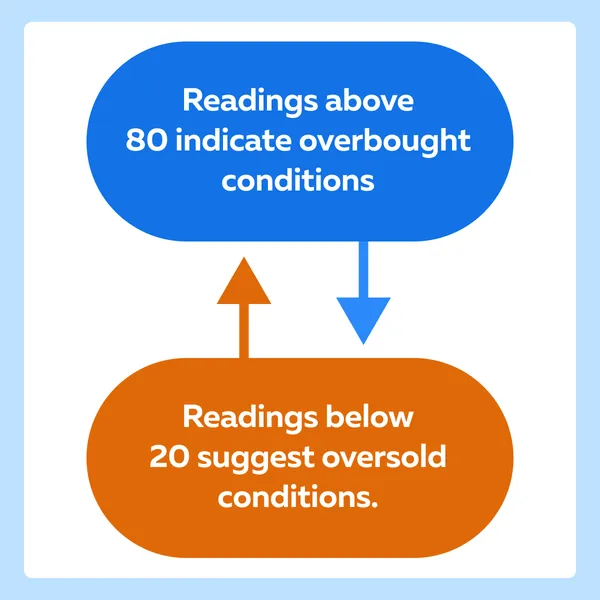
Interpretation
Pros and Cons
| Strengths | Weaknesses |
| RSI is effective in identifying overbought and oversold conditions, as well as potential divergences. | In strongly trending markets, RSI can remain overbought or oversold for extended periods, leading to false signals. |
3. Stochastic Oscillator
Mechanics
The Stochastic Oscillator compares the closing price of an asset to its price range over a specified period (usually 14 periods). It indicates the location of the closing price relative to the high-low range.
Interpretation
Additionally, some traders use a signal line (usually a 3-day Simple Moving Average of the Stochastic Oscillator) to generate buy or sell signals.
Pros and Cons
| Strengths | Weaknesses |
| Stochastic Oscillator is effective in identifying overbought and oversold conditions and potential reversals. | Like RSI, the Stochastic Oscillator can generate false signals in strongly trending markets. |
New Momentum Indicators
While traditional momentum indicators like MACD, RSI, and Stochastic Oscillators have proven their effectiveness over time, it’s also worthwhile to explore newer indicators like:
When to Use Momentum Indicators?
Let’s discuss some optimal usage scenarios:
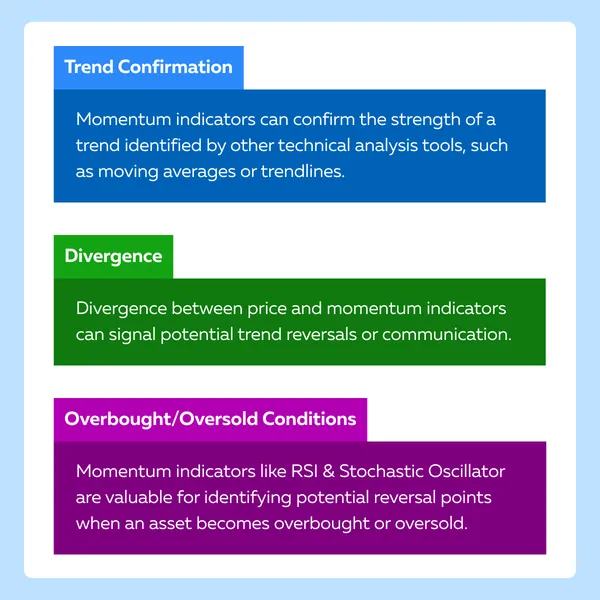
Crucial Integration with Technical Analysis Tools
Most traders maximize the predictive capabilities of momentum indicators by integrating them with other technical analysis tools. Here’s a 7-step guide on how to perform an effective integration:
| Steps | Explanation |
| I. Understand Indicator Mechanics. |
|
| II. Combine Multiple Indicators. |
|
| III. Define Clear Entry and Exit Rules. |
|
| IV. Use Multiple Time Frames. |
|
| V. Adapt to Market Conditions. |
|
| VI. Backtest and Refine. |
|
| VII. Stay Disciplined and Manage Risk. |
|
How to Leverage Intermarket Analysis for Enhanced Timing
Intermarket analysis involves studying the relationships between different asset classes and markets. This study helps in analyzing the interconnectedness of various markets. By using it, traders and investors can:
- Anticipate market turns and
- Identify trends.
Let’s study intermarket analysis in detail:
What is Intermarket Analysis?
Intermarket analysis examines the relationships between different asset classes, such as stocks, bonds, currencies, commodities, and sectors. It recognizes that these markets are interconnected and influence each other’s movements. The key principles of Intermarket analysis include:
- Asset Class Relationships
-
-
- Changes in one asset class can have ripple effects across other asset classes.
- For example,
- Rising bond yields impact equity markets, and
- Changes in commodity prices affect currencies.
-
-
-
- Positive correlations indicate that two assets tend to move in the same direction.
- On the other hand, negative correlations suggest an inverse relationship.
-
- Leading Indicators
-
- Some asset classes or sectors act as leading indicators for others.
- For instance,
- Changes in commodity prices may precede shifts in inflation expectations.
- This precedence impacts bond yields and currency exchange rates.
How to Perform Intermarket Analysis
Most traders perform an intermarket analysis following these two strategies:
| Sector Rotation Strategies | Cross-Asset Correlations |
|
|
Let’s understand the concept better using some illustrative examples:
- Example 1: Gold and US Dollar (USD)
- Intermarket Relationship
- Gold prices often have an inverse relationship with the US dollar.
- When the dollar strengthens, gold prices tend to decline, and vice versa.
- This relationship is driven by factors such as:
- Inflation expectations,
- Interest rates, and
- Geopolitical uncertainty.
- Trading Strategy
-
-
-
- Traders can use this relationship to their advantage by monitoring the US dollar index (DXY) and gold prices simultaneously.
- For example, if the DXY shows signs of weakness, traders can consider long positions in gold futures or ETFs.
-
-
- Example 2: Technology Stocks and Treasury Yields:
-
- Intermarket Relationship
- Technology stocks (e.g., FAANG stocks) often exhibit sensitivity to changes in Treasury yields.
- Rising yields lead to higher borrowing costs for tech companies.
- This surge impacted their profitability and stock prices.
- Trading Strategy
- Traders can analyze the correlation between:
- Technology stock indices (e.g., Nasdaq 100) and
- Treasury yields (e.g., 10-year Treasury yield).
- This analysis can help them anticipate potential reversals or trend continuations in tech stocks.
- For example, a divergence between rising tech stock prices and falling Treasury yields may signal a potential trend reversal in tech stocks.
- Traders can analyze the correlation between:
- Intermarket Relationship
Order Flow and Market Sentiment: Reading Between the Lines
Understanding order flow is crucial for:
- Deciphering market sentiment and
- Anticipating shifts in market dynamics.
Most often, changes in order flow are reflected through volume and price movements. A thorough analysis of order flow helps in understanding:
- The behavior of market participants and
- Their sentiment towards a particular asset.
How to Analyze Order Flow Data
Read the step-by-step guide below to easily analyze order flow data and identify changes in market sentiment:
Step I: Interpret Changes in Order Flow: These changes can be interpreted in two ways:
| Volume Analysis | Price Action Analysis |
|
|
Step II: Identify Changes in Market Sentiment: Most traders perform the following dual analysis to identify sentiment changes:
| Imbalance Analysis | Market Depth Analysis |
|
|
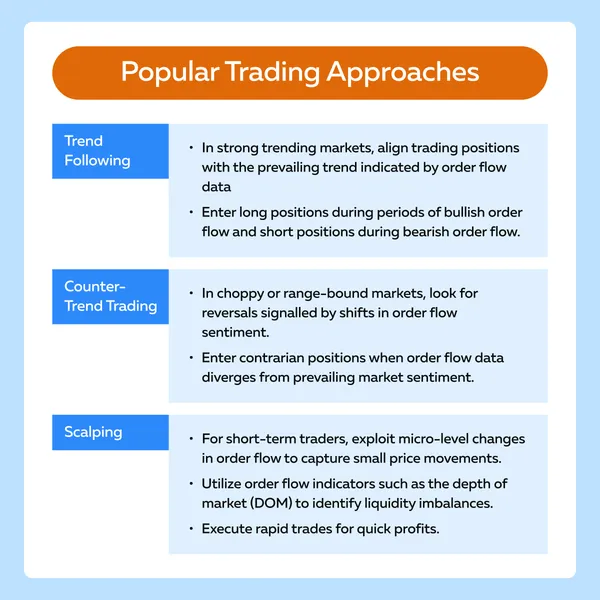
Step III: Adapt Trading Approaches
Post interpretation and identification, traders must adapt trading approaches based on the gained insights. As a general thumb rule, traders should focus on a general strategy for aligning with market movements rather than precise timing. Here are some popular trading approaches:
Step IV: Continuously Monitor and Adapt
- Stay Updated
-
-
- Continuously monitor and stay informed about:
- Evolving market conditions,
- Order flow data,
- Volume profiles, and
- Price action.
- Be vigilant for changes in market sentiment that could impact trading decisions.
- Continuously monitor and stay informed about:
-
- Adapt Strategy
-
- Adapt trading strategies based on changes in:
- Order flow sentiment and
- Market dynamics.
- Remain flexible and open to adjusting positions.
- Keep changing trading approaches as market conditions warrant.
- Adapt trading strategies based on changes in:
Conclusion
To achieve trading success, mastering market analysis is inevitable. Traders must be aware of the various tools and techniques, from understanding market cycles and patterns to leveraging momentum indicators, intermarket analysis, and order flow data.
By recognizing the stages of market cycles and patterns, traders can anticipate shifts in market sentiment and adjust their strategies accordingly. The use of momentum indicators enhances predictive capabilities and provides valuable insights into trend strength and potential reversals.
Also, intermarket analysis offers a broader perspective and highlights the interconnectedness of different asset classes and markets. By analyzing correlations and divergences, traders can develop better trading strategies.
Ready to elevate your trading game and achieve precision timing in your trades? Dive deeper into advanced trading techniques with Bookmap’s comprehensive guide on How to Trade with Bookmap. Unlock the secrets of expert traders and take your trading to new heights.
Sign Up Now