See election more clearly in real time.
Compare plans to access deeper market visibility for election.
Education
January 3, 2025
SHARE
Election Volatility and Sector Trends: How Traders Can Navigate Market Reactions

The election season is here, and it is not just campaign ads filling the airwaves! Even markets feel its strong effects, too. That’s because most veteran investors know that election cycles can bring sharp swings in stock prices due to party priorities. But beyond the headline drama, there’s a deeper opportunity. By understanding the election impact on stock sectors, you can make smarter trading decisions. Wondering how?
This article shows how elections influence market volatility and which sectors are likely to gain or lose depending on the administration. You’ll learn about key sectors, such as defense stocks, that may benefit under a Republican-led government or alternative energy stocks that usually rise with Democratic policies. Additionally, we’ll cover how traders can use both long-term and short-term strategies to position themselves around election-driven market shifts. Moreover, you will learn how tools like Bookmap offer real-time insights for smartly managing these changes.
Let’s begin by seeing how you can make informed decisions during one of the most impactful periods for financial markets.
How Election Outcomes Influence Market Volatility
Numerous studies have shown that election cycles introduce a level of uncertainty in the market. Generally, they lead to increased market volatility. Thus, investors often adjust their portfolios by speculating on how election results might impact:
- Policies,
- Regulations, and
- The broader economic environment.
For example, let’s say an election’s outcome could shift focus toward alternative energy stocks or boost defense stocks. This uncertainty around policy direction results in noticeable swings because investors weigh the likelihood of different scenarios.
Now, let’s enhance our understanding and study about “pre-election volatility”:
Leading up to an election, market volatility usually intensifies. This pre-election volatility occurs due to:
- Fluctuating polling data,
and
- Evolving campaign announcements.
These factors majorly influence investor sentiment. In past election cycles like 2016 and 2020, markets saw significant swings as polling data suggested different outcomes. As a result, investors responded to the likely economic impacts of each candidate’s platform.
Example:
- During the 2020 election, polls indicated a tight race in swing states.
- This created additional market uncertainty.
- Also, this caused sharp shifts in sectors like:
- Alternative energy,
and
- Defense stocks.
- Consequently, investors assessed which industries might benefit or suffer under new leadership.
Similarly, in the lead-up to the 2024 election, traders are observing polling trends and debates closely. They are trying to predict sector-specific impacts, such as on alternative energy stocks if environmental policies become a priority or on defense stocks if national security gains emphasis.
In this way, election volatility trading becomes an important strategy for investors. By practicing this strategy, traders can better deal with these fluctuations and position themselves in sectors that benefit from anticipated policy shifts.
Sector Trends Based on Election Outcomes
During election times, investors must try to understand the sectoral trends based on election outcomes. This allows investors to make informed decisions on stock sectors that can benefit from the policies and regulations of the incoming government. Let’s understand in detail and see the focus areas of both Republican-led and Democrat-led governments:
Republican-Led Government: Focus on Defense, Oil, and Traditional Industries
When a Republican-led government comes into power, certain specific stock sectors see increased attention and growth. Check the graphic below:
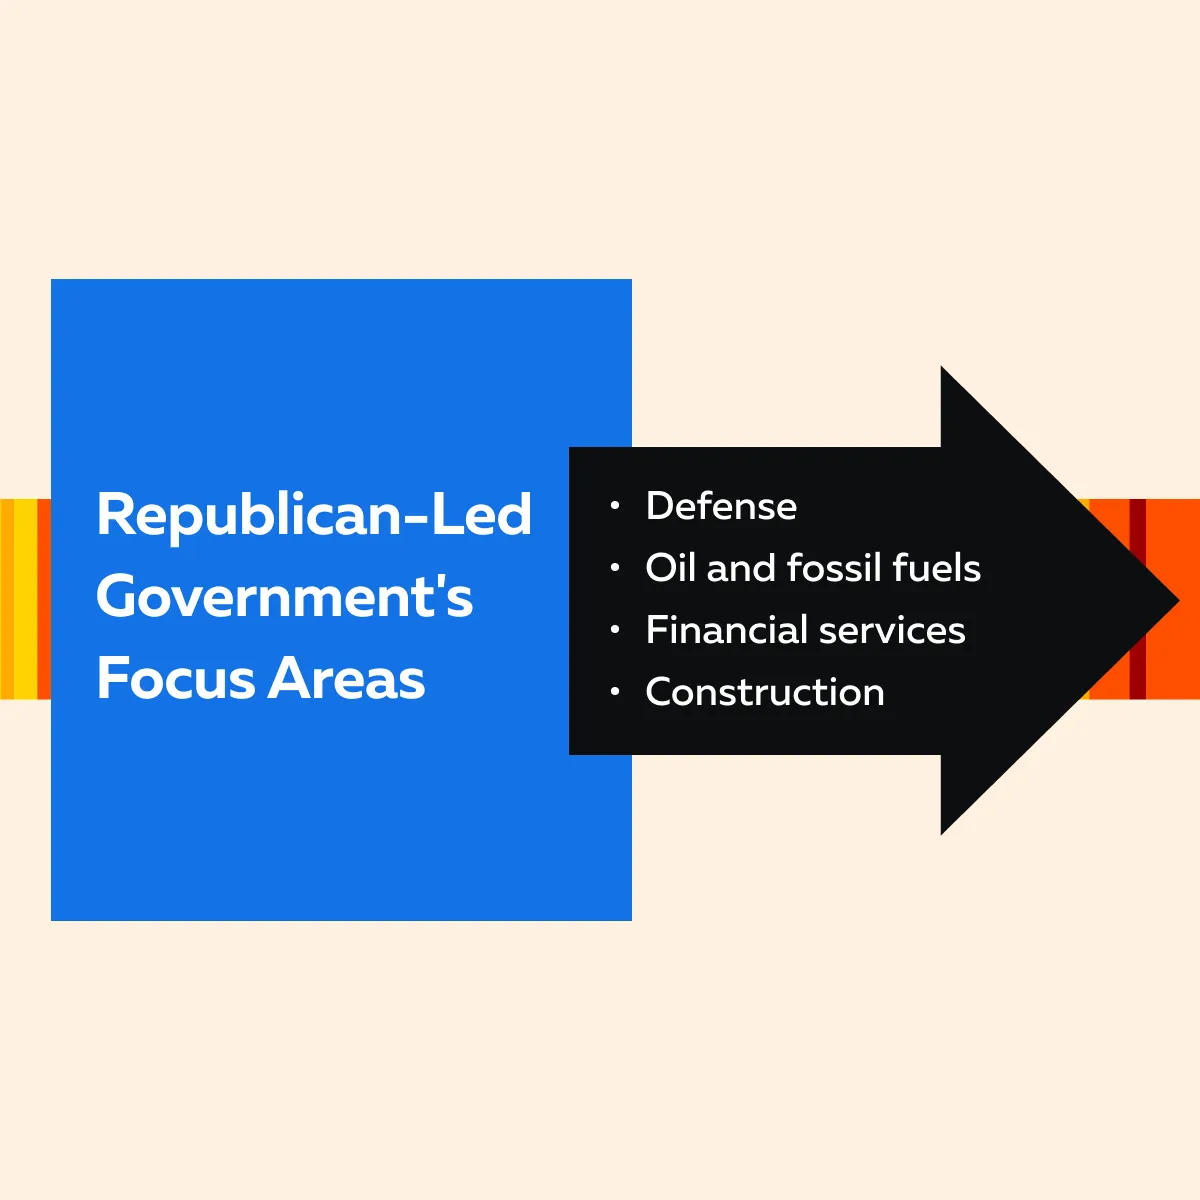
Now, let’s study these focus areas in detail:
A) Defense Stocks
Historically, Republican administrations have prioritized national security. This often leads to higher defense budgets, which often benefit defense stocks. Companies in aerospace and defense (such as Lockheed Martin or Northrop Grumman) have historically performed well under these administrations due to increased defense spending.
For investors involved in election volatility trading, these stocks are attractive when Republican candidates are expected to win. That’s because they strengthen during periods of anticipated policy support.
B) Oil and Fossil Fuels
A Republican government is generally favorable toward the oil and fossil fuel sectors. They advocate for fewer regulations and provide greater support for traditional energy industries. This pro-oil stance benefits stocks in companies like ExxonMobil and Chevron.
When the republican government comes into power, most investors anticipate policies that increase growth in oil and natural gas.
C) Financial and Construction Sectors
Other sectors that benefit generally include:
- Financial services,
and
- Construction.
Republican administrations often support tax cuts. Also, they propose infrastructure spending. Both these sectors positively impact the financial and construction sectors.
Democrat-Led Government: Support for Alternative Energy, Healthcare, and Social Programs
When Democrats hold power, market trends typically shift to favor sectors related to environmental sustainability, health, and social program expansion. Check the graphic below:
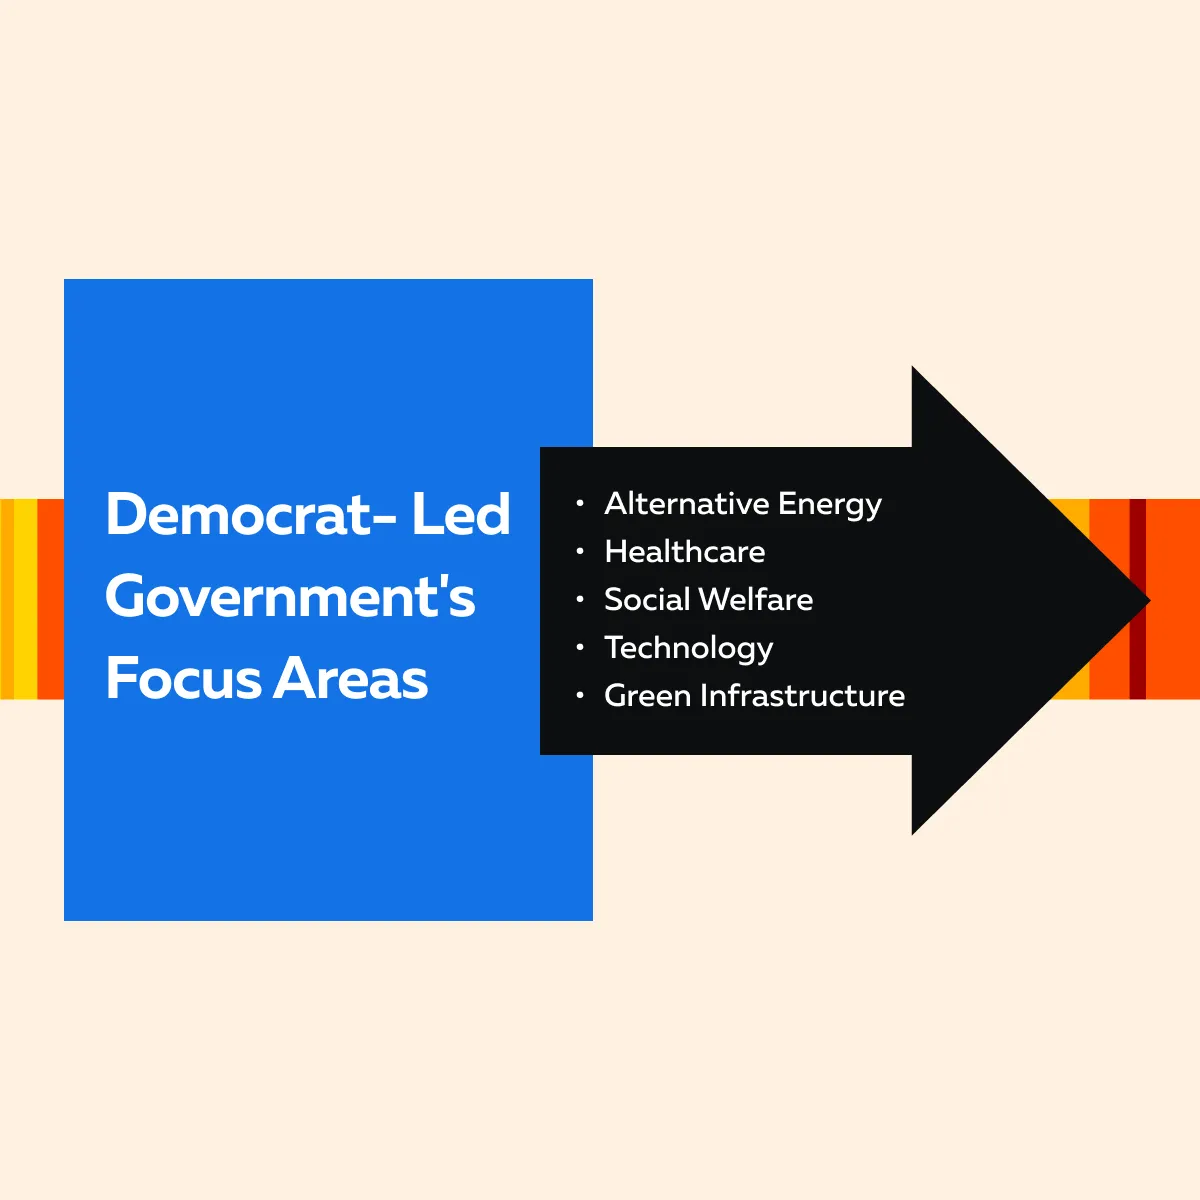
These priorities create a clear election impact on stock sectors. Let’s see how:
A) Alternative Energy Stocks
Democratic administrations prioritize:
- Clean energy,
and
- Climate-focused policies.
This creates strong support for alternative energy stocks. Such an emphasis on renewable energy results in government incentives and increased investments in solar, wind, and other sustainable energy sources. For example, companies like NextEra Energy and First Solar may see their stocks rise due to Democrats’ policies. These policies generally promote renewable energy infrastructure and climate action. Thus, for investors focusing on election volatility trading, the alternative energy sector often becomes an appealing option.
B) Healthcare and Social Programs
Democratic policies frequently focus on expanding healthcare access and social services benefiting companies in the healthcare sector. Stocks like UnitedHealth and CVS Health experience growth under these administrations.
The influence of election cycles on these stocks is evident. That’s because most investors anticipate that Democratic-led healthcare reforms will positively impact healthcare service providers. Additionally, pharmaceutical companies can better expand their customer base more effectively.
C) Tech and Green Infrastructure
Another sector that often benefits under Democratic leadership is technology. Particularly, tech companies focused on green infrastructure and sustainable innovation increase in value. Democratic administrations generally support policies that promote:
- Technological advancements,
and
- Green infrastructure projects.
This focus leads to gains in tech stocks with a sustainability angle. Many companies in these areas also receive incentives for innovation and eco-friendly development.
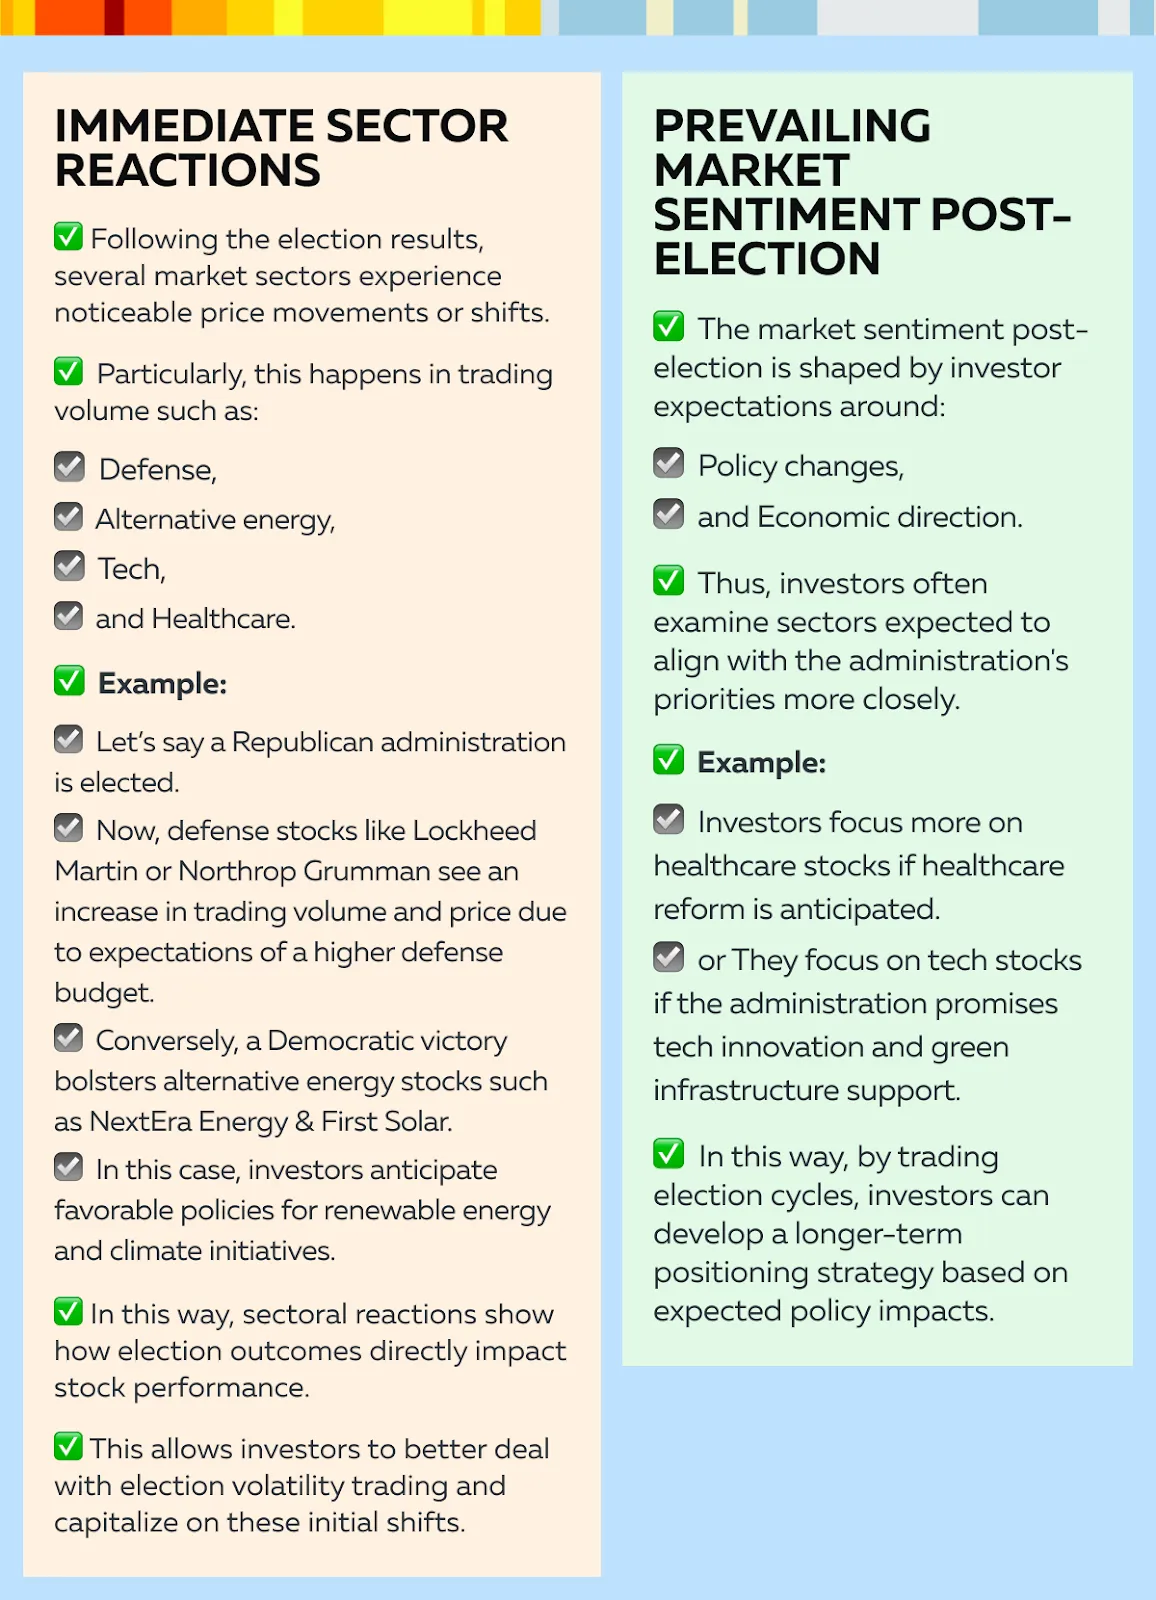
Post-Election Analysis: Sector Reactions and Key Takeaways
After an election, certain key sectors show immediate reactions. This shows investor sentiment around the expected policy direction of the elected administration. Moreover, this post-election period provides insights into sector-specific performance as traders react to the election’s impact on stock sectors and position themselves accordingly. Let’s learn in detail:
Use Bookmap’s advanced visualization tools to track shifts in market sentiment during election cycles.
Strategic Adjustments for the Post-Election Landscape
In the post-election period, traders look to refine their strategies. They do so based on:
- Sector trends,
and
By considering both short-term fluctuations and long-term policy impacts, investors strategically adjust their portfolios. They try to align with the new administration’s priorities. To smartly make this alignment, you can use our advanced market analysis tool, Bookmap, which supplies data-driven insights that allow you to track market shifts in real-time. Now, let’s see how you can make strategic adjustments after the elections:
- A) Long-Term vs. Short-Term Approaches
Ideally, traders looking at the election impact on stock sectors should consider whether they want to take a long-term or short-term approach. Those focused on long-term growth should gradually build positions in sectors that align with the administration’s agenda.
Let’s see how through the graphic below:
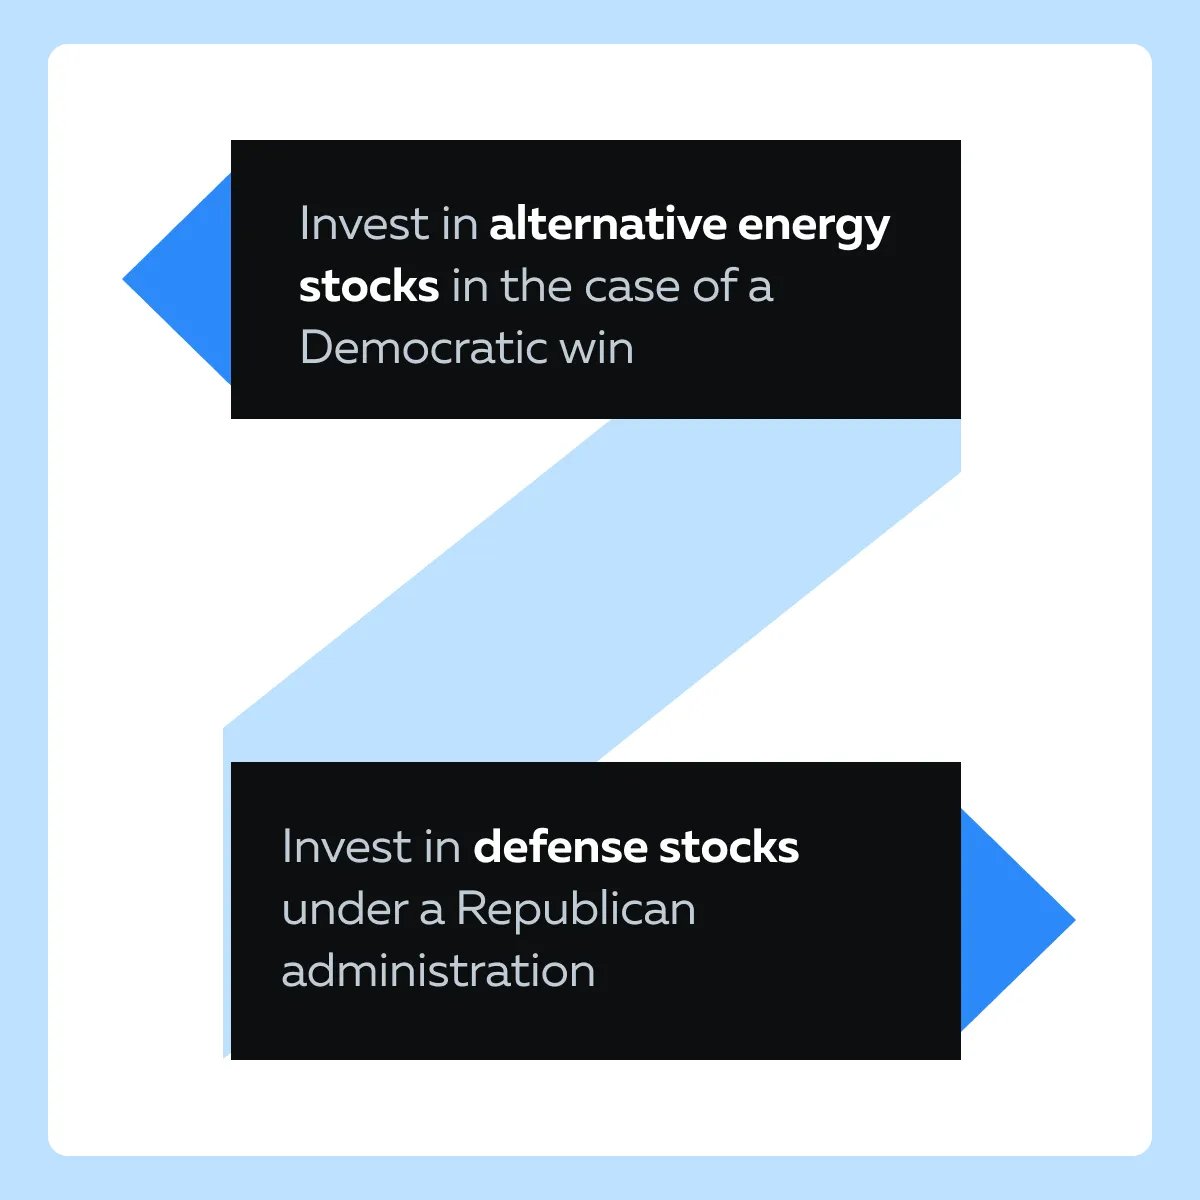
This strategy allows traders to capture gains as policies develop over time and helps them align their investments with expected policy-driven growth. On the other hand, short-term traders involved in election volatility trading should try to capitalize on immediate post-election price swings. To do so, they can focus on stocks likely to respond quickly to anticipated policy changes.
- B) Adapting to Sector Rotations
As new policies influence sector rotations, traders can adapt their portfolios by observing where institutional money is flowing. For example,
- Let’s say post-election policies favor infrastructure or clean energy.
- Now, traders can see increased inflows into:
- Alternative energy stocks,
or
- Construction-related sectors.
- By staying updated about sector rotations, investors can make changes to their portfolios and include stocks in these areas.
- This way, they can benefit from the new administration’s policy-driven demand.
Get prepared for election-related market swings with Bookmap’s comprehensive tools for sector analysis.
Use Bookmap to Monitor Shifts and Gain Advantage

Bookmap is an advanced market visualization and analysis tool. It allows traders to monitor shifts in:
- Liquidity,
and
Generally, this monitoring happens in certain key sectors, which provides a practical edge in the post-election market. For example,
-
- If traders notice higher liquidity and increased buy orders in alternative energy stocks like NextEra Energy or First Solar.
- They use Bookmap’s heatmap and learn about areas of concentrated buying interest.
- This shows opportunities to join in or avoid market congestion.
Similarly, for defense stocks under a Republican administration, using Bookmap, you can easily identify support and resistance levels based on order flow. This allows you to react to liquidity shifts smartly in real-time. In this way, by using Bookmap to track sector-specific liquidity changes, traders gain an understanding of market sentiment.
Whether it’s short-term election volatility trading or longer-term positioning, Bookmap can give you actionable insights and help you deal with the post-election landscape easily.
Conclusion
Elections often bring uncertainty and rapid market shifts as investors respond to anticipated policies. This impacts everything from defense stocks to alternative energy stocks. By recognizing these patterns, traders can better position themselves in sectors that are likely to benefit from the incoming administration’s focus, whether in renewable energy, healthcare, or traditional industries.
Furthermore, by using our advanced market analysis tool, Bookmap, you can access real-time data and easily see shifts in liquidity and sentiment within key sectors. This helps you to adjust your strategies in response to changing market conditions. Additionally, you can smartly monitor where large buy or sell orders are occurring, allowing you to identify trends early and act before major price movements. Stay ahead of election-driven volatility with Bookmap’s real-time market insights.
Sign Up Now